6601 E US Highway 60 -- #324 · Gold Canyon, AZ
Flood risk 1/10 · Minimal
- FEMA flood zone
- X (unshaded)
- Chance of flooding over 30 yrs
- 0.0%
- Est. flood insurance / yr
- $507 – $1,088
Fire risk 6/10 · Moderate
- Est. fire insurance / yr
- $610 – $1,132
Heat risk 8/10 · Major
- Hot days now (above 111°F)
- 6 days/yr
- Hot days in 30 yrs
- 15 days/yr
Wind risk 1/10 · Minimal
- Chance of severe wind over 30 yrs
- —
Air-quality risk 3/10 · Minor
- Unhealthy air days now
- 3 days/yr
- Unhealthy air days in 30 yrs
- 4 days/yr
Risk factors via First Street. Map © Google.
Why this score? — see what drove the D grade
The composite is a weighted blend of 9 inputs, each scored 0–100. Each bar is that input's sub-score; the figure is the points it added to the 100-point composite (weight × sub-score).
- Cash flow +14.1/30.0
- ARV discount +7.5/15.0
- DSCR +4.3/10.0
- Condition / age +4.0/5.0
- 1% rule +3.9/10.0
- Livability +2.9/5.0
- Rent growth +2.5/5.0
- Schools +1.5/10.0
- Appreciation +0.0/10.0
$150,000
🖨 Deal sheet 📄 Offer letter ✓ Due diligence
Listing remarks
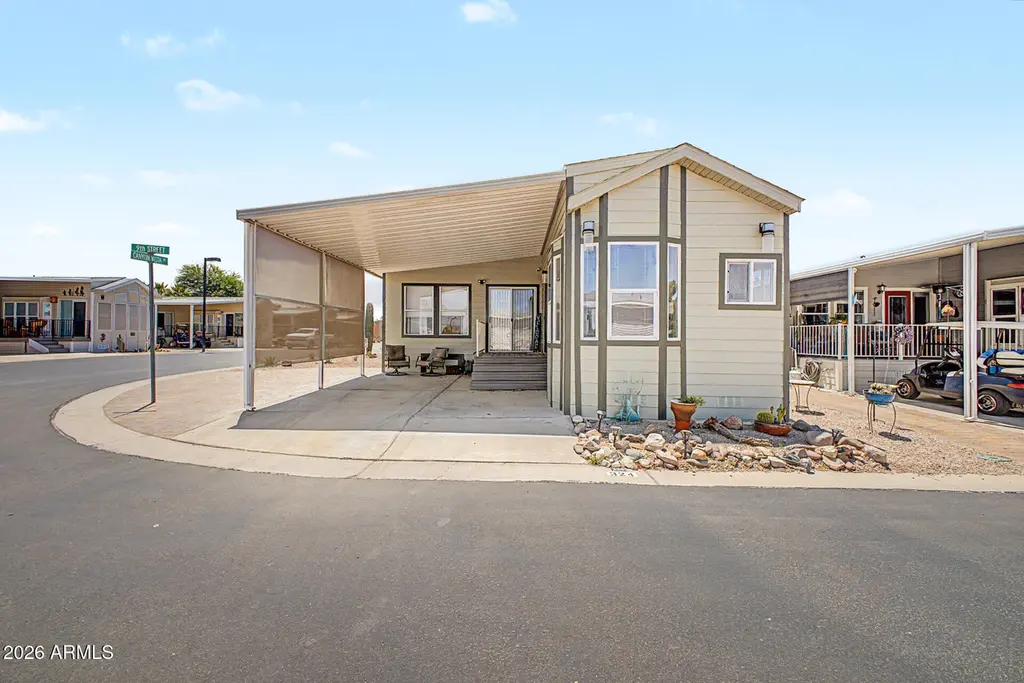
Find your ideal retirement haven in the 55+ Canyon Vistas RV Resort! Sits on a corner lot, this charming manufactured home displays a carport parking that doubles as a covered patio, where you can relax while taking in fantastic mountain views. The inviting interior features a formal living room, vaulted ceilings, tons of natural light, a neutral palette, and wood-look flooring t/out. The eat-in kitchen boasts built-in appliances, two-tone cabinetry, a skylight, and a breakfast nook. With 1 bed and 1 bath, this gem offers low-maintenance living. Laundry room w/ utility sink. The workshop is an added perk! Enjoy the resort-style amenities including pools, spas, pickleball courts, fitness cen
Key facts
- Carport parking
- Covered patio
- Formal living room
Tags
Property features AI
Finance
- Other: Building area reported by owner
- HOA & community: Land lease (annual $10,000); No association fees included; Community pool; Community spa; Community media room; Pickleball courts; Fitness center; Biking/walking paths
Exterior
- Parking: 1 covered parking space; 1 carport space
- Security: Guarded entry
- Utilities: Private water company; Public sewer and private sewer available
- Home design: Manufactured/mobile home; Leasehold ownership
- Construction: Wood siding and wood frame construction; Painted exterior; Other-style roof
- Exterior features: Corner lot; Desert front landscaping; Gravel/stone front and back; No fencing
Interior
- Kitchen: Built-in microwave; Laminate counters; Refrigerator; Dishwasher; Garbage disposal
- Bedrooms: Possible 1 bedroom
- Flooring: Vinyl
- Bathrooms: 1 full bathroom (total 1)
- Heating & cooling: Heat pump; Electric heating; Central air conditioning
- Interior features: High-speed internet; Eat-in kitchen; Vaulted ceilings; 3/4 bath in primary bedroom; Skylight(s)
- Laundry & utility: Laundry inside
Neighborhood map
What this means for you Summary
Snapshot
- This is a 1-bed/1.0-bath manufactured listed at $150k. Condition is rated good.
Deal economics
- At list price, monthly cash flow is $21 ($255/yr) — positive.
- The deal already cash-flows at list — no discount required.
- To meet the 1% rule (rent ≥ 1% of price), the offer needs to be $134k (10.7% below list).
- Recommended offer: $134k (10.7% below list) — sets the bar for 1% rule.
- Cap rate 6.5% vs local median 3.9% in Gold Canyon — top-decile yield for the area; either an underpriced asset or a hidden risk that comps aren't pricing in. Stress-test before assuming the spread holds.
Location & tenants
- Location reads 57/100 on livability (#225 in AZ) — a working-class tenant base; expect higher turnover. Strengths: crime A+, housing A+, employment A; Watch: schools D+, amenities F, commute F.
- Apache Junction Unified District (4443) (suburban): math 15% / reading 20% proficiency, ranked #195 of 249 in AZ (top 78%) — low school quality limits family demand, transient renter base, plan for 1-2y turnover.
- Market conditions: 425 active listings in the ZIP; solid renter incomes; 9,504 units permitted in Pinal County in 2024 (776 in 5+ unit buildings).
Forward outlook
- Local home prices are declining (-3.0%/yr); year-one equity from $1k of loan paydown is wiped out by about $4k of value loss. Plan a longer hold.
Negotiation context
- It's been on market 23 days — a 2% lower offer ($148k) is reasonable based on typical stale-listing flexibility.
Risks & watch-outs
- Climate carrying-cost: major wildfire risk; extreme-heat days projected 6→15/yr by 2055 (HVAC capex compounding) — expect insurance premiums to compound above CPI over the hold.
Questions for the listing agent
- Is there a deadline driving the sale (1031 exchange, divorce, estate, relocation)? That informs how much negotiation room exists.
- Schools are D-rated, which usually means shorter tenancies and higher turnover. Who's the typical renter profile here, and what's been the actual vacancy rate?
- The area grade is low — what's the realistic commute time and amenity access for the typical tenant pool here? Any planned neighborhood developments (good or bad) we should know about?
- What's the average days-on-market for RENTAL listings here right now (not sales)? A rising rental-DOM trend means longer vacancies and softer asking-rent achievability than the comps imply.
- What's the recent tenant-quality profile in this submarket — average credit score on applications, eviction rate, late-payment / NSF rate, and stable-employment percentage? A property-management company in the area should have these aggregated.
- How much new for-sale + rental construction is in the pipeline within 1–3 miles? Heavy new supply typically softens prices + rents 12–24 months out; constrained supply supports both.
Investment metrics
- 1% rule
- 0.89% ✗
- Cap rate
- 6.46%
- Cash-on-cash
- 0.61%
- DSCR
- 1.03
- GRM
- 9.3
CMA / ARV
No comps found within radius.
Projected returns pro-forma
-3.0% appreciation · 3.0% rent growth · sell at horizon
- IRR
- -15.3%
- Equity multiple
- 0.45×
- Total profit
- $-22,935
- Equity at exit
- $22,365
- IRR
- -6.8%
- Equity multiple
- 0.57×
- Total profit
- $-18,150
- Equity at exit
- $12,969
Cash invested: $42,000 (down + closing). Projections, not guarantees.
Landlord ↔ Tenant lean methodology
- Overall (STATE)
- 87 Strongly Landlord-Friendly
- State Arizona
- 87 Strongly Landlord-Friendly · R+3
- County
- — inherits STATE
- City
- — inherits STATE
ZIP-level market 85118
- Home prices YoY
- -32.4%
- Active inventory
- 425
- Price-to-rent
- 9.3×
Monthly cashflow live
- Estimated rent
- $1,339 medium interval (Pro) →
- Mortgage (P&I)
- −$787
- Tax est. 1.5%
- −$188 /mo · $2,250/yr
- Insurance
- −$62
- HOA
- −$0
- Vacancy / Maint / Mgmt
- −$281
- Net cashflow
- $21
Break-even live
UW: 25.0% down · 7.5% · 30yr · 1.5% tax · 5.0% vac · 8.0% maint · 8.0% mgmt
Financing live
Cash to close
- Down payment
- $37,500
- Closing costs
- $4,500
- Reserves months
- —
- Total cash needed
- —
Loan-product check · same deal, 3 products live
Conventional
25% down · 7.5% · 30yr
- Down + closing
- —
- Monthly P&I
- —
- Monthly cashflow
- —
- DSCR
- —
- Eligible?
- —
Personal DTI + credit; lowest rate.
DSCR
20% down · 8.5% · 30yr
- Down + closing
- —
- Monthly P&I
- —
- Monthly cashflow
- —
- DSCR
- —
- Eligible?
- —
No personal income docs; deal must DSCR.
Hard money
10% down · 12.0% · 12mo
- Down + closing
- —
- Monthly P&I
- —
- Monthly cashflow
- —
- DSCR
- —
- Eligible?
- —
Short-term bridge; refi at stabilization.
Listing history 10 events
-
2026-06-13days on market $150,000 Active 23 DOM
-
2026-06-09days on market $150,000 Active 19 DOM
-
2026-06-08days on market $150,000 Active 18 DOM
-
2026-06-07days on market $150,000 Active 17 DOM
-
2026-06-04days on market $150,000 Active 14 DOM
-
2026-06-03days on market $150,000 Active 13 DOM
-
2026-06-02days on market $150,000 Active 12 DOM
-
2026-06-01days on market $150,000 Active 11 DOM
-
2026-05-31days on market $150,000 Active 10 DOM
-
2026-05-21$150,000 Active
ⓘ Source: listings_history table (triggers on properties + properties_extension) + one-shot
backfill from property_details.listing_events for pre-trigger history.
Climate risk First Street
- Flood 1/10 Low FEMA zone X (unshaded) · 0% chance over 30 yrs
- Wildfire 6/10 Major
- Heat 8/10 Severe 6 d/yr ≥111°F today · 15 d/yr by 30 yrs out
- Wind 1/10 Low
- Air quality 3/10 Moderate 3 unhealthy d/yr today · 4 by 30 yrs out
Nearby sold comps map
Loading sold comps map…
Walkable amenities ~0.75 mi
Loading nearby amenities…
Taxation est. · year 1
- Rental income
- $16,068
- − Mortgage interest
- −$8,402
- − Property taxes
- −$2,250
- − Insurance
- −$750
- − Repairs & maintenance
- −$1,285
- − Management
- −$1,285
- − Depreciation
- −$4,364
- Taxable loss
- −$2,269
- Est. tax savings @ 24.0%
- +$544
- After-tax cash flow
- $799/yr
For passive investors: Depreciation is non-cash, so a rental often shows a tax loss while cash-flowing — sheltering income. Rental losses are passive: they offset passive income freely, and up to $25,000/yr can offset ordinary (W-2) income if you actively participate and your MAGI is under $100k (phasing out to $0 by $150k); unused losses carry forward. On sale, claimed depreciation is recaptured at up to 25%, and gains may owe capital-gains tax (a 1031 exchange can defer both). Figures are a year-1 estimate at your 24.0% rate — not tax advice; consult a CPA.
Condition & rehab AI · 30 photos
This well-maintained 55+ manufactured home in Canyon Vistas RV Resort offers a charming and low-maintenance living experience with a corner lot, covered patio, and resort-style amenities.
Value-add opportunities
- Both Paint exterior — Enhances curb appeal and resale value
- Both Replace blinds — Improves natural light and aesthetics
- Both Upgrade kitchen appliances — Modernizes kitchen and increases resale value
Renovation cost estimate screening
Value-add ROI direction
- Both Paint exterior — Enhances curb appeal and resale value ↑
- Both Replace blinds — Improves natural light and aesthetics ↑
- Both Upgrade kitchen appliances — Modernizes kitchen and increases resale value ↑
ⓘ Cost ranges are severity-bucket heuristics (US national rule-of-thumb). Get contractor quotes + a written scope before underwriting a rehab budget.
Schools (NCES district)
- District
- Apache Junction Unified District (4443)
- NCES district ID
- 0400790
- Math proficiency
- 15% ▼ -17.00%
- Reading proficiency
- 20% ▼ -13.00%
- Median HH income
- $44,930
- Composite
- 15.34/100
- National rank
- #9325
- State rank
- #195 of 249 in AZ
Livability — Gold Canyon
- Score
- 57/100
- State rank
- #225
- US rank
- #21732
Category grades
Schools grade is shown separately in the Schools card above.
Census & demographics
- Census place
- Gold Canyon, AZ
- County
- Pinal County · 399,947 people
- City population
- 14,932
- Metro
- Phoenix-Mesa-Chandler, AZ
- Population (ZIP)
- 14,932
- Household income
- $86,393
- Rent vs Own
- Severe rent burden
- 160.0
Population outlook (Pinal County) Hauer SSP2
- Today (2025)
- 437,574 people
- By 2030
- 446,903 · +2.1%
- By 2040
- 452,589 · +3.4%
- By 2050
- 444,126 · +1.5%
- By 2075
- 430,300 · -1.7%
- By 2100
- 393,536 · -10.1%
Race, ethnicity, and origin ACS 2023
- Neighborhood character
- Predominantly White (86%)
- Race & ethnicity
- White 86% Hispanic / Latino 8% Two or more races 6%
- Hispanic origin (detail)
- Mexican 7%
- Common ancestry
- Portuguese 7% Romanian 4% Slovak 4%
- Foreign-born
- 5% · Canada
- Languages at home
- 96% English-only · Spanish 3%
Political lean MEDSL · Pinal
- 2024 margin
- Strong R (+22.1) · D 38.5% · R 60.6%
- 2008→2024 swing
- -7.6pp toward R · 2008: -14.5pp · 2024: -22.1pp
- All cycles
- 2024: R+22.1 2020: R+17.3 2016: R+19.3 2012: R+17.1 2008: R+14.5
Not yet ingested
- Civics
- —
Market trends
- HPI YoY
- ▼ -122.27%
- Current HPI
- 255.6958
- Rent YoY
- —
- Metro
- Phoenix-Mesa-Chandler, AZ
- State GDP YoY
- ▲ 4.54%
- F500 in state
- 20
Industry mix (Fortune 500 HQ in AZ)
| Industry | F500 HQs | Revenue |
|---|---|---|
| Technology | 2 | $13B |
|
||
| Mining / Metals | 1 | $23B |
|
||
| Environmental Services | 1 | $16B |
|
||
| Metals / Steel | 1 | $14B |
|
||
| Technology Distribution | 1 | $9B |
|
||
| Homebuilding | 1 | $8B |
|
||
Price history
1 event — show timeline
- 2026-05-21 Listed $150,000 ARMLS
Cash-flow waterfall
monthlySold comps — $/sqft
last 12 mo · ≤1 miLoading sold comps…