158 Oakwood Rd · Shady Spring, WV
Flood risk 1/10 · Minimal
- FEMA flood zone
- X (unshaded)
- Chance of flooding over 30 yrs
- 0.0%
- Est. flood insurance / yr
- $507 – $1,088
Fire risk 3/10 · Minor
- Est. fire insurance / yr
- $787 – $1,461
Heat risk 2/10 · Minimal
- Hot days now (above 90°F)
- 7 days/yr
- Hot days in 30 yrs
- 20 days/yr
Wind risk 1/10 · Minimal
- Chance of severe wind over 30 yrs
- —
Air-quality risk 1/10 · Minimal
- Unhealthy air days now
- 0 days/yr
- Unhealthy air days in 30 yrs
- 0 days/yr
Risk factors via First Street. Map © Google.
Why this score? — see what drove the B- grade
The composite is a weighted blend of 9 inputs, each scored 0–100. Each bar is that input's sub-score; the figure is the points it added to the 100-point composite (weight × sub-score).
- Cash flow +26.3/30.0
- DSCR +8.9/10.0
- ARV discount +7.5/15.0
- Appreciation +7.0/10.0
- 1% rule +5.7/10.0
- Schools +3.0/10.0
- Livability +3.0/5.0
- Rent growth +2.5/5.0
- Condition / age +2.5/5.0
$119,000
🖨 Deal sheet (PDF) 📄 Offer letter ✓ Due diligence
Listing remarks
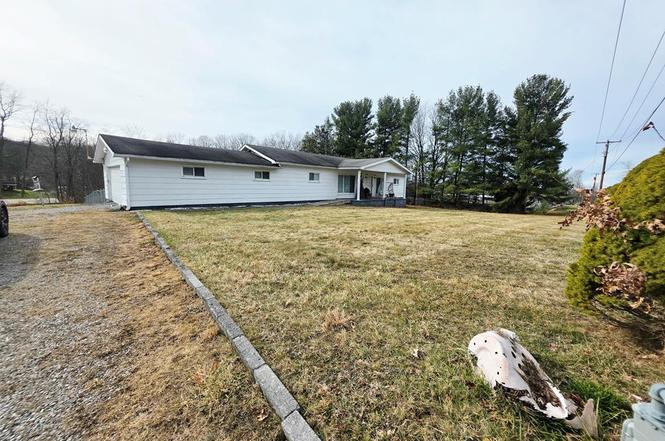
Welcome home to this property located in the desirable Shady Spring School District. Situated on a large corner lot just under an acre, this home offers space, comfort, and flexibility both inside and out. The home features 3 bedroom 2 full baths, plus a bonus room that can easily serve as a 4th bedroom, home office, or pantry, depending on your needs. The very large family room is perfect for gatherings and everyday living, highlighted by a gas fireplace that adds warmth and charm. A bright sunroom with a pellet stove provides a cozy space to relax year-round. Enjoy outdoor living with a covered front porch and a fenced yard, ideal for pets, play, entertaining. The property also boasts a 2
Key facts
- Covered front porch
- Large corner lot
- Fenced yard
Tags
Property features AI
Exterior
- Parking: 2 total parking spaces; 2 covered spaces; 2-car attached garage; Open parking available; Gravel driveway
- Utilities: Public water; Public sewer
- Home design: Residential property; Double wide mobile home
- Construction: Shingle roof; Other construction materials
- Exterior features: Covered patio/porch; Fenced yard; Shed(s); Level, landscaped lot; Has view
Interior
- Kitchen: Cooktop; Refrigerator; Gas water heater
- Bedrooms: 9 total rooms (includes bedrooms and living spaces)
- Flooring: Laminate
- Bathrooms: 2 full bathrooms
- Heating & cooling: Central air conditioning; Natural gas heating; Wood heating
- Interior features: Walk-in closets; Fireplace
- Laundry & utility: Washer hookup; Crawl space basement
Neighborhood map
What this means for you Summary
Snapshot
- This is a 3-bed/2.0-bath single-family listed at $119k.
Deal economics
- At list price, monthly cash flow is $306 ($4k/yr) — positive.
- The deal already cash-flows at list — no discount required.
- Meets the 1% rule at list price ($1k rent vs $119k).
- Recommended offer: $105k (12.0% below list) — sets the bar for market timing.
- Cap rate 9.4% vs local median 1.8% in Shady Spring — top-decile yield for the area; either an underpriced asset or a hidden risk that comps aren't pricing in. Stress-test before assuming the spread holds.
Location & tenants
- Location reads 60/100 on livability (#214 in WV) — a middle-class / working-renter tenant base. Strengths: crime A+, cost of living A+, housing B+; Watch: amenities F, commute F, health & safety F.
- Raleigh County Schools (rural): math 29% / reading 42% proficiency, ranked #14 of 55 in WV (top 26%) — families likely to look elsewhere, expect single-tenant / working-renter base with shorter leases.
- Zoned schools: Shady Spring Elementary (math 36% / reading 43%, grade F, #108 of 377 statewide, top 33%, 414 students, 0% FRL); Shady Spring Middle School (math 30% / reading 46%, grade F, #25 of 109 statewide, top 23%, 578 students, 0% FRL); Shady Spring High (math 32% / reading 57%, grade F, #11 of 110 statewide, top 11%, 828 students, 0% FRL) — zoned schools average 0% FRL vs 46% district-wide (46 pts lower); this property's tenant base skews higher-income than the district average.
- Market conditions: 124 active listings in the ZIP; 41 units permitted in Raleigh County in 2024 (0 in 5+ unit buildings).
Forward outlook
- In year one you build about $6k of equity ($823 loan paydown + $5k appreciation (4.1% local appreciation)).
- Raleigh County population projected at -16% by 2050 — secular population decline; favor cash flow + early exit over multi-decade hold.
- At projected returns (4.1% appreciation + 3.0% rent growth), your $33k cash investment doubles in ~4 years — after that, you're playing with house money.
- By year 6, paydown + projected appreciation supports a ~$30k cash-out refi (75% LTV) — recoverable capital for the next deal without selling this one.
Negotiation context
- It's been on market 158 days — a 12% lower offer ($105k) is reasonable based on typical stale-listing flexibility.
- 2 sale attempts with the ask held roughly flat each time — persistent listings suggest the price (not the market) is what's stuck; bring a comps-based counter.
Questions for the listing agent
- It's been on market 158 days. Have you received any prior offers? Is the seller open to a 12% concession, seller financing, or rate buy-down credit?
- Built in 1971 — when were the roof, HVAC, electrical panel, plumbing, and water heater last replaced?
- Why hasn't it sold? Are there any deal-killer items the seller is aware of (foundation, flood, title, zoning, code violations)?
- Is there a deadline driving the sale (1031 exchange, divorce, estate, relocation)? That informs how much negotiation room exists.
- What's the average days-on-market for RENTAL listings here right now (not sales)? A rising rental-DOM trend means longer vacancies and softer asking-rent achievability than the comps imply.
- What's the recent tenant-quality profile in this submarket — average credit score on applications, eviction rate, late-payment / NSF rate, and stable-employment percentage? A property-management company in the area should have these aggregated.
- How much new for-sale + rental construction is in the pipeline within 1–3 miles? Heavy new supply typically softens prices + rents 12–24 months out; constrained supply supports both.
Investment metrics
- 1% rule
- 1.07% ✓
- Cap rate
- 9.38%
- Cash-on-cash
- 11.02%
- DSCR
- 1.49
- GRM
- 7.8
CMA / ARV
- ARV (on-the-fly)
- $256,200
- Comps found
- 7
Show comp detail 7 sales within ~0.75 mi
| Address | Dist | Beds/Ba | Sqft | Sold | Price | $/sf | Match |
|---|---|---|---|---|---|---|---|
| 156 Division St | 0.53mi | 3/2.0 | 2,268 (+8%) | 3mo | $499,000 | $220 | 60 |
| 107 Warren St | 0.44mi | 3/2.5 | 1,866 (-11%) | 3mo | $390,000 | $209 | 56 |
| 318 Briarwood Dr | 0.25mi | 3/1.5 | 1,911 (-9%) | 22mo | $162,500 | $85 | 53 |
| 130 Warren St | 0.46mi | 3/2.5 | 1,969 (-6%) | 18mo | $325,000 | $165 | 51 |
| 353 1 St St | 0.74mi | 3/1.5 | 1,899 (-10%) | 1mo | $206,000 | $108 | 46 |
| 134 Skelton Ln | 0.70mi | 4/2.5 (+1) | 2,142 (+2%) | 14mo | $235,000 | $110 | 46 |
| 123 South Kimberly St | 0.67mi | 4/3.0 (+1) | 2,150 (+2%) | 17mo | $262,000 | $122 | 42 |
Match score weights: distance 35% · size 25% · config 20% · recency 20%. Top-matched comps best support the ARV.
Projected returns pro-forma
4.06% appreciation · 3.0% rent growth · sell at horizon
- IRR
- 20.2%
- Equity multiple
- 2.22×
- Total profit
- $40,581
- Equity at exit
- $60,759
- IRR
- 20.6%
- Equity multiple
- 4.27×
- Total profit
- $109,057
- Equity at exit
- $99,717
Cash invested: $33,320 (down + closing). Projections, not guarantees.
Landlord ↔ Tenant lean methodology
- Overall (STATE)
- 83 Strongly Landlord-Friendly
- State West Virginia
- 83 Strongly Landlord-Friendly · R+22
- County
- — inherits STATE
- City
- — inherits STATE
ZIP-level market 25918
- Home prices YoY
- 1.7%
- Active inventory
- 124
- Price-to-rent
- 7.8×
Monthly cashflow live
- Estimated rent
- $1,277 medium interval (Pro) →
- Mortgage (P&I)
- −$624
- Tax from tax record
- −$30 /mo · $354/yr
- Insurance
- −$50
- HOA
- −$0
- Vacancy / Maint / Mgmt
- −$268
- Net cashflow
- $306
Break-even live
Sensitivity live
| Price | -10% $373 | -5% $340 | +0% $306 | +5% $272 | +10% $239 |
|---|---|---|---|---|---|
| Rent | -10% $205 | -5% $255 | +0% $306 | +5% $356 | +10% $407 |
| Rate | -1.0pp $366 | -0.5pp $336 | base $306 | +0.5pp $275 | +1.0pp $244 |
UW: 25.0% down · 7.5% · 30yr · 1.5% tax · 5.0% vac · 8.0% maint · 8.0% mgmt
Financing live
Cash to close
- Down payment
- $29,750
- Closing costs
- $3,570
- Reserves months
- —
- Total cash needed
- —
Loan-product check · same deal, 3 products live
Conventional
25% down · 7.5% · 30yr
- Down + closing
- —
- Monthly P&I
- —
- Monthly cashflow
- —
- DSCR
- —
- Eligible?
- —
Personal DTI + credit; lowest rate.
DSCR
20% down · 8.5% · 30yr
- Down + closing
- —
- Monthly P&I
- —
- Monthly cashflow
- —
- DSCR
- —
- Eligible?
- —
No personal income docs; deal must DSCR.
Hard money
10% down · 12.0% · 12mo
- Down + closing
- —
- Monthly P&I
- —
- Monthly cashflow
- —
- DSCR
- —
- Eligible?
- —
Short-term bridge; refi at stabilization.
Listing history 15 events
-
2026-06-19days on market $119,000 Active 158 DOM
-
2026-06-18days on market $119,000 Active 157 DOM
-
2026-06-17days on market $119,000 Active 156 DOM
-
2026-06-16days on market $119,000 Active 155 DOM
-
2026-06-15days on market $119,000 Active 154 DOM
-
2026-06-14days on market $119,000 Active 152 DOM
-
2026-06-12days on market $119,000 Active 151 DOM
-
2026-06-09days on market $119,000 Active 148 DOM
-
2026-06-08days on market $119,000 Active 147 DOM
-
2026-06-07days on market $119,000 Active 146 DOM
-
2026-06-03statusdays on market $119,000 Active 142 DOM
-
2026-04-11historical Active Under Contract
-
2026-03-13status Active
-
2026-02-01historical Active Under Contract
-
2026-01-07$119,000 Active
ⓘ Source: listings_history table (triggers on properties + properties_extension) + one-shot
backfill from property_details.listing_events for pre-trigger history.
Tax reassessment forecast WV · Resets to sale price
- Current annual tax
- $354 · $30/mo
- Projected year-2 tax
- $702 · $59/mo
- Expected delta
- +$348/yr (+$29/mo · 98.2%)
ⓘ Screening estimate from a state-policy table — verify with the county assessor before closing.
Climate risk First Street
- Flood 1/10 Low FEMA zone X (unshaded) · 0% chance over 30 yrs
- Wildfire 3/10 Moderate
- Heat 2/10 Low 7 d/yr ≥90°F today · 20 d/yr by 30 yrs out
- Wind 1/10 Low
- Air quality 1/10 Low 0 unhealthy d/yr today · 0 by 30 yrs out
Nearby sold comps map
Loading sold comps map…
Walkable amenities ~0.75 mi
Loading nearby amenities…
Taxation est. · year 1
- Rental income
- $15,327
- − Mortgage interest
- −$6,666
- − Property taxes
- −$354
- − Insurance
- −$595
- − Repairs & maintenance
- −$1,226
- − Management
- −$1,226
- − Depreciation
- −$3,462
- Taxable income
- $1,798
- Est. tax owed @ 24.0%
- −$432
- After-tax cash flow
- $3,239/yr
For passive investors: Depreciation is non-cash, so a rental often shows a tax loss while cash-flowing — sheltering income. Rental losses are passive: they offset passive income freely, and up to $25,000/yr can offset ordinary (W-2) income if you actively participate and your MAGI is under $100k (phasing out to $0 by $150k); unused losses carry forward. On sale, claimed depreciation is recaptured at up to 25%, and gains may owe capital-gains tax (a 1031 exchange can defer both). Figures are a year-1 estimate at your 24.0% rate — not tax advice; consult a CPA.
Schools (NCES district)
- District
- Raleigh County Schools
- NCES district ID
- 5401230
- Math proficiency
- 29% ▼ -8.00%
- Reading proficiency
- 42% ▼ -3.00%
- Median HH income
- $39,828
- Composite
- 29.74/100
- National rank
- #6445
- State rank
- #14 of 55 in WV
Livability — Shady Spring
- Score
- 60/100
- State rank
- #214
- US rank
- #18668
Category grades
Schools grade is shown separately in the Schools card above.
Census & demographics
- Census place
- Shady Spring, WV
- Population (ZIP)
- 4,659
Population outlook (Raleigh County) Hauer SSP2
- Today (2025)
- 73,505 people
- By 2030
- 70,954 · -3.5%
- By 2040
- 66,038 · -10.2%
- By 2050
- 61,919 · -15.8%
- By 2075
- 51,954 · -29.3%
- By 2100
- 39,724 · -46.0%
Race, ethnicity, and origin ACS 2023
- Neighborhood character
- Predominantly White (96%)
- Race & ethnicity
- White 96% Black 4%
- Common ancestry
- Portuguese 1% Lithuanian 1%
- Foreign-born
- 0%
- Languages at home
- 99% English-only · Spanish 1%
Political lean MEDSL · Raleigh
- 2024 margin
- Solid R (+54.3) · D 22.0% · R 76.3% · Other 1.6%
- 2008→2024 swing
- -28.5pp toward R · 2008: -25.9pp · 2024: -54.3pp
- All cycles
- 2024: R+54.3 2020: R+50.4 2016: R+52.8 2012: R+44.6 2008: R+25.9
Not yet ingested
- Civics
- —
Market trends
- HPI YoY
- ▲ 4.06%
- Current HPI
- 240.2868
- Rent YoY
- —
- Metro
- —
- State GDP YoY
- —
- F500 in state
- 0
Price history
4 events — show timeline
- 2026-04-11 Contingent — BBOR
- 2026-03-13 Relisted — BBOR
- 2026-02-01 Contingent — BBOR
- 2026-01-07 Listed $119,000 BBOR
Property tax history
+6.2%/yrLatest (2025): $354 · +6.2% YoY. Source: county tax records.
Cash-flow waterfall
monthlySold comps — $/sqft
last 12 mo · ≤1 miLoading sold comps…