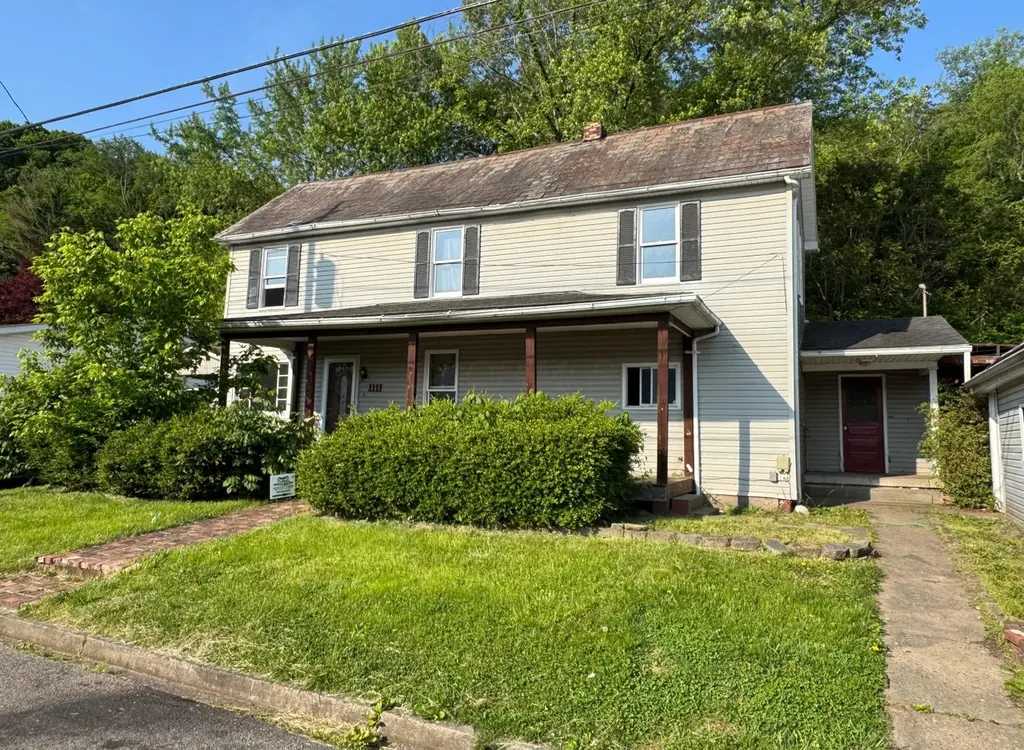
1111 Echo St N · Malta, OH
Flood risk 1/10 · Minimal
- FEMA flood zone
- X (unshaded)
- Chance of flooding over 30 yrs
- 0.0%
- Est. flood insurance / yr
- $507 – $1,088
Fire risk 1/10 · Minimal
- Est. fire insurance / yr
- $713 – $1,323
Heat risk 4/10 · Minor
- Hot days now (above 98°F)
- 7 days/yr
- Hot days in 30 yrs
- 19 days/yr
Wind risk 1/10 · Minimal
- Chance of severe wind over 30 yrs
- 1.0%
Air-quality risk 2/10 · Minimal
- Unhealthy air days now
- 0 days/yr
- Unhealthy air days in 30 yrs
- 1 days/yr
Risk factors via First Street. Map © Google.
Why this score? — see what drove the B grade
The composite is a weighted blend of 9 inputs, each scored 0–100. Each bar is that input's sub-score; the figure is the points it added to the 100-point composite (weight × sub-score).
- Cash flow +23.3/30.0
- ARV discount +15.0/15.0
- Appreciation +8.8/10.0
- DSCR +7.5/10.0
- 1% rule +5.7/10.0
- Schools +4.4/10.0
- Livability +3.2/5.0
- Rent growth +2.5/5.0
- Condition / age +2.5/5.0
$113,900
🖨 Deal sheet 📄 Offer letter ✓ Due diligence
Listing remarks MLS
Most recent used as a rental property offering 3+ bedrooms, 2 full bath. Current tenants have vacated. Motivated seller. Seller may entertain owner financing.
Key facts
- 8,712 sq ft lot
- Garage
- Built 1900
Neighborhood map
What this means for you Summary
Snapshot
- This is a 3-bed/1.0-bath single-family listed at $114k.
Deal economics
- At list price, monthly cash flow is $208 ($2k/yr) — positive.
- The deal already cash-flows at list — no discount required.
- Meets the 1% rule at list price ($1k rent vs $114k).
- Recommended offer: $104k (9.0% below list) — sets the bar for market timing.
Location & tenants
- Location reads 63/100 on livability (#835 in OH) — a middle-class / working-renter tenant base. Strengths: cost of living A+, housing A+, schools B+; Watch: health & safety C-, crime D, amenities F.
- Morgan Local (rural): math 46% / reading 60% proficiency, ranked #420 of 656 in OH (top 64%) — acceptable for families but not a draw, mixed tenant base, ~2y average lease.
- Market conditions: 17 active listings in the ZIP; 34 units permitted in Morgan County in 2024 (0 in 5+ unit buildings).
Forward outlook
- In year one you build about $9k of equity ($787 loan paydown + $9k appreciation (7.6% local appreciation)).
- Morgan County population projected at -22% by 2050 — secular population decline; favor cash flow + early exit over multi-decade hold.
- At projected returns (7.6% appreciation + 3.0% rent growth), your $32k cash investment doubles in ~3 years — after that, you're playing with house money.
- By year 4, paydown + projected appreciation supports a ~$32k cash-out refi (75% LTV) — recoverable capital for the next deal without selling this one.
Negotiation context
- It's been on market 107 days — a 9% lower offer ($104k) is reasonable based on typical stale-listing flexibility.
- 8 sale attempts since 21y ago; this cycle's ask has dropped $10k (8%) from the opening price — seller is motivated, your offer sets the floor, not the list.
Risks & watch-outs
- Watch-outs: built in 1900 — expect roof / HVAC / electrical / plumbing capex.
Questions for the listing agent
- It's been on market 107 days. Have you received any prior offers? Is the seller open to a 9% concession, seller financing, or rate buy-down credit?
- Built in 1900 — when were the roof, HVAC, electrical panel, plumbing, and water heater last replaced?
- Why hasn't it sold? Are there any deal-killer items the seller is aware of (foundation, flood, title, zoning, code violations)?
- Is there a deadline driving the sale (1031 exchange, divorce, estate, relocation)? That informs how much negotiation room exists.
- Schools are B-rated — typically a magnet for longer-tenancy family renters. What's the average tenant stay here, and is there a school-zone premium baked into asking?
- Crime grade is D in this area — have there been break-ins, vandalism, or insurance claims at this property in the last 3 years? What carrier currently insures it and at what premium?
- What's the average days-on-market for RENTAL listings here right now (not sales)? A rising rental-DOM trend means longer vacancies and softer asking-rent achievability than the comps imply.
- What's the recent tenant-quality profile in this submarket — average credit score on applications, eviction rate, late-payment / NSF rate, and stable-employment percentage? A property-management company in the area should have these aggregated.
- How much new for-sale + rental construction is in the pipeline within 1–3 miles? Heavy new supply typically softens prices + rents 12–24 months out; constrained supply supports both.
Investment metrics
- 1% rule
- 1.07% ✓
- Cap rate
- 8.49%
- Cash-on-cash
- 7.83%
- DSCR
- 1.35
- GRM
- 7.8
CMA / ARV
- ARV (median comp)
- $163,747
- List price
- $113,900
- Delta
- -30.44%
- Verdict
- UNDERPRICED
- Comps
- 20 within 1.0 mi
Show comp detail 5 sales within ~0.75 mi
| Address | Dist | Beds/Ba | Sqft | Sold | Price | $/sf | Match |
|---|---|---|---|---|---|---|---|
| 307 11th St | 0.04mi | 3/1.0 | 1,606 (-9%) | 8mo | $175,000 | $109 | 76 |
| 843 High St N | 0.18mi | 4/1.0 (+1) | 1,665 (-5%) | 18mo | $118,500 | $71 | 63 |
| 1002 Echo St N | 0.13mi | 3/2.0 | 1,550 (-12%) | 10mo | $95,000 | $61 | 61 |
| 361 W Jefferson Ave | 0.65mi | 3/1.5 | 1,716 (-2%) | 6mo | $260,000 | $152 | 58 |
| 4018 N State Route 376 NW | 0.67mi | 4/2.0 (+1) | 1,950 (+11%) | 3mo | $140,000 | $72 | 39 |
Match score weights: distance 35% · size 25% · config 20% · recency 20%. Top-matched comps best support the ARV.
Projected returns pro-forma
7.56% appreciation · 3.0% rent growth · sell at horizon
- IRR
- 25.1%
- Equity multiple
- 2.79×
- Total profit
- $57,026
- Equity at exit
- $83,179
- IRR
- 22.9%
- Equity multiple
- 5.88×
- Total profit
- $155,573
- Equity at exit
- $162,010
Cash invested: $31,892 (down + closing). Projections, not guarantees.
Landlord ↔ Tenant lean methodology
- Overall (STATE)
- 73 Landlord-Friendly
- State Ohio
- 73 Landlord-Friendly · R+6
- County
- — inherits STATE
- City
- — inherits STATE
ZIP-level market 43758
- Home prices YoY
- 4.2%
- Active inventory
- 17
- Price-to-rent
- 7.8×
Monthly cashflow live
- Estimated rent
- $1,220 medium interval (Pro) →
- Mortgage (P&I)
- −$597
- Tax from tax record
- −$111 /mo · $1,327/yr
- Insurance
- −$47
- HOA
- −$0
- Vacancy / Maint / Mgmt
- −$256
- Net cashflow
- $208
Break-even live
UW: 25.0% down · 7.5% · 30yr · 1.5% tax · 5.0% vac · 8.0% maint · 8.0% mgmt
Financing live
Cash to close
- Down payment
- $28,475
- Closing costs
- $3,417
- Reserves months
- —
- Total cash needed
- —
Loan-product check · same deal, 3 products live
Conventional
25% down · 7.5% · 30yr
- Down + closing
- —
- Monthly P&I
- —
- Monthly cashflow
- —
- DSCR
- —
- Eligible?
- —
Personal DTI + credit; lowest rate.
DSCR
20% down · 8.5% · 30yr
- Down + closing
- —
- Monthly P&I
- —
- Monthly cashflow
- —
- DSCR
- —
- Eligible?
- —
No personal income docs; deal must DSCR.
Hard money
10% down · 12.0% · 12mo
- Down + closing
- —
- Monthly P&I
- —
- Monthly cashflow
- —
- DSCR
- —
- Eligible?
- —
Short-term bridge; refi at stabilization.
Listing history 40 events
-
2026-06-18days on market $113,900 Active 107 DOM
-
2026-06-17pricedays on market $113,900 Active 106 DOM
-
2026-06-16days on market $115,000 Active 105 DOM
-
2026-06-15days on market $115,000 Active 104 DOM
-
2026-06-13days on market $115,000 Active 102 DOM
-
2026-06-12days on market $115,000 Active 101 DOM
-
2026-06-09days on market $115,000 Active 98 DOM
-
2026-06-08days on market $115,000 Active 97 DOM
-
2026-06-08days on market $115,000 Active 96 DOM
-
2026-06-07days on market $115,000 Active 95 DOM
-
2026-06-04days on market $115,000 Active 92 DOM
-
2026-06-02days on market $115,000 Active 91 DOM
-
2026-06-01days on market $115,000 Active 90 DOM
-
2026-05-31days on market $115,000 Active 89 DOM
-
2026-05-12price $115,000 158-char remark
Show marketing remark (158 chars)
Most recent used as a rental property offering 3+ bedrooms, 2 full bath. Current tenants have vacated. Motivated seller. Seller may entertain owner financing.
-
2026-05-12price $115,000 158-char remark
Show marketing remark (158 chars)
Most recent used as a rental property offering 3+ bedrooms, 2 full bath. Current tenants have vacated. Motivated seller. Seller may entertain owner financing.
-
2026-05-01price $120,000 158-char remark
Show marketing remark (158 chars)
Most recent used as a rental property offering 3+ bedrooms, 2 full bath. Current tenants have vacated. Motivated seller. Seller may entertain owner financing.
-
2026-04-21price $120,000 158-char remark
Show marketing remark (158 chars)
Most recent used as a rental property offering 3+ bedrooms, 2 full bath. Current tenants have vacated. Motivated seller. Seller may entertain owner financing.
-
2026-04-05$124,000 Active 158-char remark
Show marketing remark (158 chars)
Most recent used as a rental property offering 3+ bedrooms, 2 full bath. Current tenants have vacated. Motivated seller. Seller may entertain owner financing.
-
2026-03-03$124,000 Active 158-char remark
Show marketing remark (158 chars)
Most recent used as a rental property offering 3+ bedrooms, 2 full bath. Current tenants have vacated. Motivated seller. Seller may entertain owner financing.
-
2024-03-13soldstatus $245,500
-
2023-11-07historical
-
2023-09-19price $129,900
-
2023-08-14price $134,900
-
2023-07-17price $139,900
-
2023-06-13price $144,900
-
2023-05-04$149,900 Active
-
2022-02-18soldstatus $133,400
-
2019-12-13soldstatus $19,500
-
2019-06-20$28,000
-
2013-08-28soldstatus $74,500
-
2013-08-23soldstatus $74,500
-
2013-08-23soldstatus $74,500
-
2013-04-01$76,900
-
2013-03-27historical
-
2012-09-27$76,900
-
2012-09-27$79,900
-
2005-03-31soldstatus $74,000
-
2005-01-24$78,500
-
1996-08-02soldstatus $40,000
ⓘ Source: listings_history table (triggers on properties + properties_extension) + one-shot
backfill from property_details.listing_events for pre-trigger history.
Tax reassessment forecast OH · Partial reset (capped growth)
- Current annual tax
- $1,327 · $111/mo
- Projected year-2 tax
- $1,552 · $129/mo
- Expected delta
- +$225/yr (+$19/mo · 17.0%)
ⓘ Screening estimate from a state-policy table — verify with the county assessor before closing.
Climate risk First Street
- Flood 1/10 Low FEMA zone X (unshaded) · 0% chance over 30 yrs
- Wildfire 1/10 Low
- Heat 4/10 Moderate 7 d/yr ≥98°F today · 19 d/yr by 30 yrs out
- Wind 1/10 Low 100% chance of damaging wind over 30 yrs
- Air quality 2/10 Low 0 unhealthy d/yr today · 1 by 30 yrs out
Nearby sold comps map
Loading sold comps map…
Walkable amenities ~0.75 mi
Loading nearby amenities…
Taxation est. · year 1
- Rental income
- $14,635
- − Mortgage interest
- −$6,380
- − Property taxes
- −$1,327
- − Insurance
- −$570
- − Repairs & maintenance
- −$1,171
- − Management
- −$1,171
- − Depreciation
- −$3,313
- Taxable income
- $704
- Est. tax owed @ 24.0%
- −$169
- After-tax cash flow
- $2,329/yr
For passive investors: Depreciation is non-cash, so a rental often shows a tax loss while cash-flowing — sheltering income. Rental losses are passive: they offset passive income freely, and up to $25,000/yr can offset ordinary (W-2) income if you actively participate and your MAGI is under $100k (phasing out to $0 by $150k); unused losses carry forward. On sale, claimed depreciation is recaptured at up to 25%, and gains may owe capital-gains tax (a 1031 exchange can defer both). Figures are a year-1 estimate at your 24.0% rate — not tax advice; consult a CPA.
Schools (NCES district)
- District
- Morgan Local
- NCES district ID
- 3904877
- Math proficiency
- 46% ▼ -20.00%
- Reading proficiency
- 60% ▼ -9.00%
- Median HH income
- $36,523
- Composite
- 43.93/100
- National rank
- #2907
- State rank
- #420 of 656 in OH
Livability — Malta
- Score
- 63/100
- State rank
- #835
- US rank
- #15616
Category grades
Schools grade is shown separately in the Schools card above.
Census & demographics
- Census place
- Malta, OH
- County
- Morgan · 19,509 people
- Population (ZIP)
- 2,900
- Household income
- $56,477
- Rent vs Own
- Severe rent burden
- 10.9
Population outlook (Morgan County) Hauer SSP2
- Today (2025)
- 14,024 people
- By 2030
- 13,485 · -3.8%
- By 2040
- 12,222 · -12.8%
- By 2050
- 10,912 · -22.2%
- By 2075
- 8,181 · -41.7%
- By 2100
- 5,838 · -58.4%
Race, ethnicity, and origin ACS 2023
- Neighborhood character
- Predominantly White (95%)
- Race & ethnicity
- White 95% Black 3% Two or more races 2%
- Common ancestry
- Serbian 3%
- Foreign-born
- 1%
- Languages at home
- 95% English-only · German/W. Germanic 4%
Political lean MEDSL · Morgan
- 2024 margin
- Solid R (+53.2) · D 23.0% · R 76.2%
- 2008→2024 swing
- -46.0pp toward R · 2008: -7.2pp · 2024: -53.2pp
- All cycles
- 2024: R+53.2 2020: R+48.4 2016: R+41.4 2012: R+6.0 2008: R+7.2
Not yet ingested
- Civics
- —
Market trends
- HPI YoY
- ▲ 7.56%
- Current HPI
- 188.0191
- Rent YoY
- —
- Metro
- —
- State GDP YoY
- ▲ 1.98%
- F500 in state
- 48
Industry mix (Fortune 500 HQ in OH)
| Industry | F500 HQs | Revenue |
|---|---|---|
| Insurance | 3 | $145B |
|
||
| Industrial Machinery | 3 | $49B |
|
||
| Financial Services | 3 | $24B |
|
||
| Consumer Goods | 2 | $93B |
|
||
| Aerospace / Defense | 2 | $47B |
|
||
| Utilities | 2 | $33B |
|
||
Price history
+187.5% since first listed26 events — show timeline
- 2026-05-12 Price Changed $115,000 CBRMLS
- 2026-05-12 Price Changed $115,000 MLSNOW
- 2026-05-01 Price Changed $120,000 MLSNOW
- 2026-04-21 Price Changed $120,000 CBRMLS
- 2026-04-05 Listed $124,000 MLSNOW
- 2026-03-03 Listed $124,000 CBRMLS
- 2024-03-13 Sold (Public Records) $245,500 Public Records
- 2023-11-07 Listing Removed — MLSNOW
- 2023-09-19 Price Changed $129,900 MLSNOW
- 2023-08-14 Price Changed $134,900 MLSNOW
- 2023-07-17 Price Changed $139,900 MLSNOW
- 2023-06-13 Price Changed $144,900 MLSNOW
- 2023-05-04 Listed $149,900 MLSNOW
- 2022-02-18 Sold (Public Records) $133,400 Public Records
- 2019-12-13 Sold (MLS) $19,500 MLSNOW
- 2019-06-20 Listed $28,000 MLSNOW
- 2013-08-28 Sold (Public Records) $74,500 Public Records
- 2013-08-23 Sold (MLS) $74,500 MLSNOW
- 2013-08-23 Sold (MLS) $74,500 MLSNOW
- 2013-04-01 Listed $76,900 MLSNOW
- 2013-03-27 Listing Removed — MLSNOW
- 2012-09-27 Listed $79,900 MLSNOW
- 2012-09-27 Listed $76,900 MLSNOW
- 2005-03-31 Sold (Public Records) $74,000 Public Records
- 2005-01-24 Listed $78,500 MLSNOW
- 1996-08-02 Sold (Public Records) $40,000 Public Records
Property tax history
+5.5%/yrLatest (2025): $1,327 · +7.9% YoY. Source: county tax records.
Cash-flow waterfall
monthlySold comps — $/sqft
last 12 mo · ≤1 miLoading sold comps…