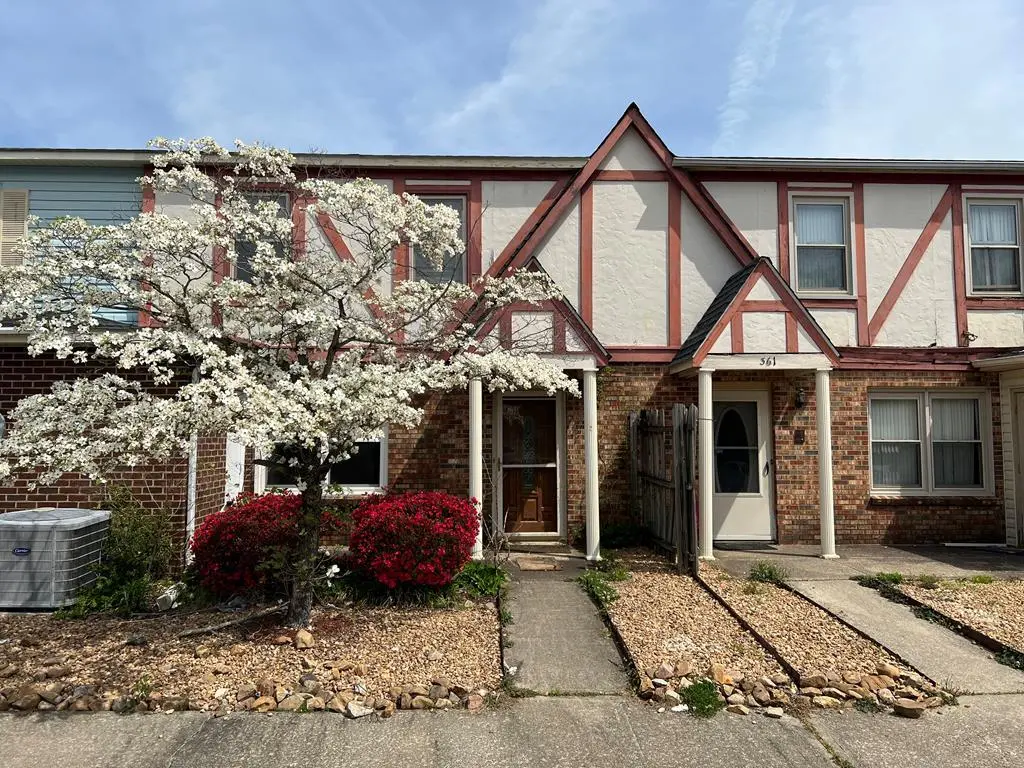
357 Seminole Trl · Danville, VA
Flood risk 1/10 · Minimal
- FEMA flood zone
- X (unshaded)
- Chance of flooding over 30 yrs
- 0.0%
- Est. flood insurance / yr
- $507 – $1,088
Fire risk 3/10 · Minor
- Est. fire insurance / yr
- $666 – $1,236
Heat risk 6/10 · Moderate
- Hot days now (above 105°F)
- 7 days/yr
- Hot days in 30 yrs
- 18 days/yr
Wind risk 4/10 · Minor
- Chance of severe wind over 30 yrs
- 8.0%
Air-quality risk 2/10 · Minimal
- Unhealthy air days now
- 0 days/yr
- Unhealthy air days in 30 yrs
- 1 days/yr
Risk factors via First Street. Map © Google.
Why this score? — see what drove the B- grade
The composite is a weighted blend of 9 inputs, each scored 0–100. Each bar is that input's sub-score; the figure is the points it added to the 100-point composite (weight × sub-score).
- Cash flow +30.0/30.0
- 1% rule +10.0/10.0
- DSCR +10.0/10.0
- ARV discount +4.2/15.0
- Livability +3.9/5.0
- Schools +3.0/10.0
- Rent growth +2.5/5.0
- Condition / age +2.5/5.0
- Appreciation +0.0/10.0
$75,000
🖨 Deal sheet 📄 Offer letter ✓ Due diligence
Listing remarks MLS
Great investment opportunity with this 2-bedroom 1.5 bath condo in Cabin Creek. Spacious living room with kitchen and all appliances will convey including washer and dryer. Storage room just left of front door entrance.
Key facts
- Built 1976
- Listed 72 days
Neighborhood map
What this means for you Summary
Snapshot
- This is a 2-bed/1.5-bath other listed at $75k.
Deal economics
- At list price, monthly cash flow is $460 ($6k/yr) — positive.
- The deal already cash-flows at list — no discount required.
- Meets the 1% rule at list price ($1k rent vs $75k).
- Recommended offer: $70k (6.0% below list) — sets the bar for market timing.
- Cap rate 13.7% vs local median 5.3% in Danville — top-decile yield for the area; either an underpriced asset or a hidden risk that comps aren't pricing in. Stress-test before assuming the spread holds.
Location & tenants
- Location reads 77/100 on livability (#91 in VA, #2,952 nationally) — a middle-class / working-renter tenant base. Strengths: cost of living A+, housing A+, health & safety A+; Watch: amenities D+, crime D-, commute F.
- Danville City Public School District (town): math 30% / reading 44% proficiency, ranked #128 of 131 in VA (top 98%) — families likely to look elsewhere, expect single-tenant / working-renter base with shorter leases; 71% free/reduced lunch — lower-income household profile, screen leases tightly.
- Market conditions: 211 active listings in the ZIP; 4 comparable units currently listed for rent nearby; rentals lingering (median 44d on market — plan ~5-8 weeks vacancy on turnover, expect pricing pressure); 75% of comp listings sitting > 30 days — soft ceiling on asking rent; 54 units permitted in Danville city in 2024 (40 in 5+ unit buildings).
Forward outlook
- Local home prices are declining (-3.0%/yr); year-one equity from $519 of loan paydown is wiped out by about $2k of value loss. Plan a longer hold.
- Danville County population projected to shrink 7% by 2050 — rents likely to lag national; underwrite the cash flow, not the appreciation.
- At projected returns (-3.0% appreciation + 3.0% rent growth), your $21k cash investment doubles in ~5 years — after that, you're playing with house money.
Negotiation context
- It's been on market 73 days — a 6% lower offer ($70k) is reasonable based on typical stale-listing flexibility.
- Current owner paid $37k; list at $75k implies a 103% gain — meaningful room to come down on a strong offer.
Risks & watch-outs
- Climate carrying-cost: extreme-heat days projected 7→18/yr by 2055 (HVAC capex compounding) — expect insurance premiums to compound above CPI over the hold.
Questions for the listing agent
- It's been on market 73 days. Have you received any prior offers? Is the seller open to a 6% concession, seller financing, or rate buy-down credit?
- Built in 1976 — when were the roof, HVAC, electrical panel, plumbing, and water heater last replaced?
- Why hasn't it sold? Are there any deal-killer items the seller is aware of (foundation, flood, title, zoning, code violations)?
- Is there a deadline driving the sale (1031 exchange, divorce, estate, relocation)? That informs how much negotiation room exists.
- Schools are B-rated — typically a magnet for longer-tenancy family renters. What's the average tenant stay here, and is there a school-zone premium baked into asking?
- Crime grade is D in this area — have there been break-ins, vandalism, or insurance claims at this property in the last 3 years? What carrier currently insures it and at what premium?
- What's the average days-on-market for RENTAL listings here right now (not sales)? A rising rental-DOM trend means longer vacancies and softer asking-rent achievability than the comps imply.
- What's the recent tenant-quality profile in this submarket — average credit score on applications, eviction rate, late-payment / NSF rate, and stable-employment percentage? A property-management company in the area should have these aggregated.
- How much new for-sale + rental construction is in the pipeline within 1–3 miles? Heavy new supply typically softens prices + rents 12–24 months out; constrained supply supports both.
Investment metrics
- 1% rule
- 1.52% ✓
- Cap rate
- 13.66%
- Cash-on-cash
- 26.30%
- DSCR
- 2.17
- GRM
- 5.5
CMA / ARV
- ARV (median comp)
- $69,925
- List price
- $75,000
- Delta
- 7.26%
- Verdict
- FAIR
- Comps
- 18 within 1.0 mi
Projected returns pro-forma
-3.0% appreciation · 3.0% rent growth · sell at horizon
- IRR
- 20.0%
- Equity multiple
- 1.82×
- Total profit
- $17,127
- Equity at exit
- $11,183
- IRR
- 28.3%
- Equity multiple
- 3.50×
- Total profit
- $52,536
- Equity at exit
- $6,485
Cash invested: $21,000 (down + closing). Projections, not guarantees.
Landlord ↔ Tenant lean methodology
- Overall (STATE)
- 55 Moderately Landlord-Leaning
- State Virginia
- 55 Moderately Landlord-Leaning · D+2
- County
- — inherits STATE
- City
- — inherits STATE
ZIP-level market 24540
- Home prices YoY
- -20.0%
- Active inventory
- 211
- Price-to-rent
- 5.5×
Monthly cashflow live
- Estimated rent
- $1,143 medium interval (Pro) →
- Mortgage (P&I)
- −$393
- Tax from tax record
- −$18 /mo · $218/yr
- Insurance
- −$31
- HOA
- −$0
- Vacancy / Maint / Mgmt
- −$240
- Net cashflow
- $460
Break-even live
UW: 25.0% down · 7.5% · 30yr · 1.5% tax · 5.0% vac · 8.0% maint · 8.0% mgmt
Financing live
Cash to close
- Down payment
- $18,750
- Closing costs
- $2,250
- Reserves months
- —
- Total cash needed
- —
Loan-product check · same deal, 3 products live
Conventional
25% down · 7.5% · 30yr
- Down + closing
- —
- Monthly P&I
- —
- Monthly cashflow
- —
- DSCR
- —
- Eligible?
- —
Personal DTI + credit; lowest rate.
DSCR
20% down · 8.5% · 30yr
- Down + closing
- —
- Monthly P&I
- —
- Monthly cashflow
- —
- DSCR
- —
- Eligible?
- —
No personal income docs; deal must DSCR.
Hard money
10% down · 12.0% · 12mo
- Down + closing
- —
- Monthly P&I
- —
- Monthly cashflow
- —
- DSCR
- —
- Eligible?
- —
Short-term bridge; refi at stabilization.
Rent comps 4 comps
| Address | Beds | Baths | Sqft | Rent | $/sqft | DOM | Units | Dist |
|---|---|---|---|---|---|---|---|---|
| 357 Terry Ave Danville, VA | 3.0 | 1.0 | 900 | $1,165 | $1.29 | 43d | 1 | 0.91mi |
| 117 Ida St Danville, VA | 3.0 | 1.0 | 925 | $1,163 | $1.26 | 43d | 1 | 1.12mi |
| 119 Crosland Ave Danville, VA | 2.0 | 1.5 | 776 | $910 | $1.17 | 21d | 1 | 1.16mi |
| 1300 Franklin Tpke Danville, VA | 2.0 | 1.5 | 1000 | $1,265 | $1.26 | 43d | 1 | 1.44mi |
Listing history 18 events
-
2026-06-19days on market $75,000 Active 73 DOM
-
2026-06-18days on market $75,000 Active 72 DOM
-
2026-06-17days on market $75,000 Active 71 DOM
-
2026-06-16days on market $75,000 Active 70 DOM
-
2026-06-15days on market $75,000 Active 69 DOM
-
2026-06-14days on market $75,000 Active 67 DOM
-
2026-06-13days on market $75,000 Active 66 DOM
-
2026-06-10days on market $75,000 Active 64 DOM
-
2026-06-09days on market $75,000 Active 63 DOM
-
2026-06-08days on market $75,000 Active 62 DOM
-
2026-06-07days on market $75,000 Active 61 DOM
-
2026-06-05days on market $75,000 Active 58 DOM
-
2026-06-02days on market $75,000 Active 56 DOM
-
2026-06-01days on market $75,000 Active 55 DOM
-
2026-05-31days on market $75,000 Active 54 DOM
-
2026-05-30days on market $75,000 Active 53 DOM
-
2026-04-08$75,000 Active 219-char remark
Show marketing remark (219 chars)
Great investment opportunity with this 2-bedroom 1.5 bath condo in Cabin Creek. Spacious living room with kitchen and all appliances will convey including washer and dryer. Storage room just left of front door entrance.
-
1995-04-20soldstatus $37,000
ⓘ Source: listings_history table (triggers on properties + properties_extension) + one-shot
backfill from property_details.listing_events for pre-trigger history.
Tax reassessment forecast VA · Resets to sale price
- Current annual tax
- $218 · $18/mo
- Projected year-2 tax
- $615 · $51/mo
- Expected delta
- +$397/yr (+$33/mo · 181.7%)
ⓘ Screening estimate from a state-policy table — verify with the county assessor before closing.
Climate risk First Street
- Flood 1/10 Low FEMA zone X (unshaded) · 0% chance over 30 yrs
- Wildfire 3/10 Moderate
- Heat 6/10 Major 7 d/yr ≥105°F today · 18 d/yr by 30 yrs out
- Wind 4/10 Moderate 8% chance of damaging wind over 30 yrs
- Air quality 2/10 Low 0 unhealthy d/yr today · 1 by 30 yrs out
Nearby sold comps map
Loading sold comps map…
Walkable amenities ~0.75 mi
Loading nearby amenities…
Taxation est. · year 1
- Rental income
- $13,716
- − Mortgage interest
- −$4,201
- − Property taxes
- −$218
- − Insurance
- −$375
- − Repairs & maintenance
- −$1,097
- − Management
- −$1,097
- − Depreciation
- −$2,182
- Taxable income
- $4,545
- Est. tax owed @ 24.0%
- −$1,091
- After-tax cash flow
- $4,432/yr
For passive investors: Depreciation is non-cash, so a rental often shows a tax loss while cash-flowing — sheltering income. Rental losses are passive: they offset passive income freely, and up to $25,000/yr can offset ordinary (W-2) income if you actively participate and your MAGI is under $100k (phasing out to $0 by $150k); unused losses carry forward. On sale, claimed depreciation is recaptured at up to 25%, and gains may owe capital-gains tax (a 1031 exchange can defer both). Figures are a year-1 estimate at your 24.0% rate — not tax advice; consult a CPA.
Schools (NCES district)
- District
- Danville City Public School District
- NCES district ID
- 5101110
- Math proficiency
- 30% ▼ -22.00%
- Reading proficiency
- 44% ▼ -8.00%
- Median HH income
- $31,952
- Composite
- 30.23/100
- National rank
- #6298
- State rank
- #128 of 131 in VA
Livability — Danville
- Score
- 77/100
- State rank
- #91
- US rank
- #2952
Category grades
Schools grade is shown separately in the Schools card above.
Census & demographics
- Census place
- Danville, VA
- County
- Danville City · 59,055 people
- City population
- 59,055
- Metro
- Danville, VA
- Population (ZIP)
- 31,013
- Household income
- $47,924
- Rent vs Own
- Severe rent burden
- 1170.0
Population outlook (Danville County) Hauer SSP2
- Today (2025)
- 40,989 people
- By 2030
- 40,432 · -1.4%
- By 2040
- 39,255 · -4.2%
- By 2050
- 38,035 · -7.2%
- By 2075
- 35,612 · -13.1%
- By 2100
- 30,365 · -25.9%
Race, ethnicity, and origin ACS 2023
- Neighborhood character
- Diverse neighborhood (Simpson 0.57)
- Race & ethnicity
- White 50% Black 42% Two or more races 5% Hispanic / Latino 4%
- Common ancestry
- Slovak 1% Lithuanian 1% Serbian 1%
- Foreign-born
- 2% · Canada
- Languages at home
- 97% English-only · Spanish 2%
Political lean MEDSL · Danville
- 2024 margin
- Strong D (+21.1) · D 60.1% · R 39.0%
- 2008→2024 swing
- +1.9pp toward D · 2008: 19.1pp · 2024: 21.1pp
- All cycles
- 2024: D+21.1 2020: D+22.1 2016: D+19.9 2012: D+22.1 2008: D+19.1
Not yet ingested
- Civics
- —
Market trends
- HPI YoY
- ▼ -58.79%
- Current HPI
- 235.1746
- Rent YoY
- —
- Metro
- Danville, VA
- State GDP YoY
- ▲ 2.40%
- F500 in state
- 50
Industry mix (Fortune 500 HQ in VA)
| Industry | F500 HQs | Revenue |
|---|---|---|
| Aerospace / Defense | 4 | $236B |
|
||
| Technology / Defense | 3 | $32B |
|
||
| Financial Services | 2 | $176B |
|
||
| Utilities | 2 | $27B |
|
||
| Insurance | 2 | $25B |
|
||
| Technology | 2 | $15B |
|
||
Price history
+102.7% since first listed2 events — show timeline
- 2026-04-08 Listed $75,000 DRRAR
- 1995-04-20 Sold (Public Records) $37,000 Public Records
Property tax history
-1.1%/yrLatest (2025): $218 · +0.0% YoY. Source: county tax records.
Cash-flow waterfall
monthlySold comps — $/sqft
last 12 mo · ≤1 miLoading sold comps…