 🏷️ Likely Rental
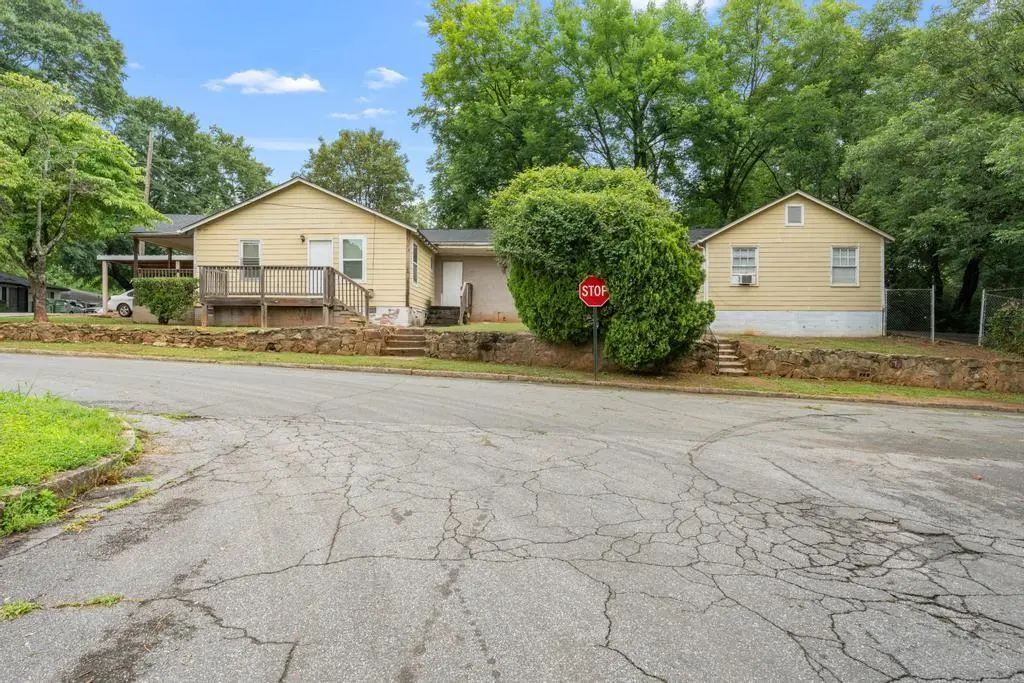
1318 Eason St NW · Atlanta, GA
Flood risk 1/10 · Minimal
- FEMA flood zone
- X (unshaded)
- Chance of flooding over 30 yrs
- 0.0%
- Est. flood insurance / yr
- $473 – $860
Fire risk 1/10 · Minimal
- Est. fire insurance / yr
- $963 – $1,789
Heat risk 5/10 · Moderate
- Hot days now (above 103°F)
- 6 days/yr
- Hot days in 30 yrs
- 16 days/yr
Wind risk 6/10 · Moderate
- Chance of severe wind over 30 yrs
- 27.0%
Air-quality risk 4/10 · Minor
- Unhealthy air days now
- 5 days/yr
- Unhealthy air days in 30 yrs
- 7 days/yr
Risk factors via First Street. Map © Google.
Why this score? — see what drove the C+ grade
The composite is a weighted blend of 9 inputs, each scored 0–100. Each bar is that input's sub-score; the figure is the points it added to the 100-point composite (weight × sub-score).
- Cash flow +22.8/30.0
- ARV discount +15.0/15.0
- DSCR +7.3/10.0
- 1% rule +6.4/10.0
- Livability +4.2/5.0
- Rent growth +3.1/5.0
- Schools +2.7/10.0
- Condition / age +2.5/5.0
- Appreciation +0.0/10.0
$199,000
🖨 Deal sheet 📄 Offer letter ✓ Due diligence
Listing remarks MLS
Exceptional investment opportunity in Atlanta’s rapidly growing Hunter Hills neighborhood! This fully tenant-occupied 6-bedroom property is currently generating $3,500 per month in rental income, offering immediate cash flow for investors. Ideally located just minutes from Downtown Atlanta, Midtown, Mercedes-Benz Stadium, and Georgia Tech, the property also enjoys convenient access to the Atlanta BeltLine, making it highly attractive to tenants seeking connectivity to the city’s top employment, entertainment, and recreation destinations. With six bedrooms, strong rental income, and a location in one of Atlanta’s most active redevelopment corridors, this property presents an excellent opportunity for both seasoned and first-time investors. Add a cash-flowing asset to your portfolio while benefiting from the continued growth and appreciation of Atlanta’s Westside.
Key facts
- Tenant occupied
- Convenient access
- Rental income
Tags
Property features AI
Finance
- Other: Located on an asphalt county road; directions: please use GPS
- HOA & community: Near Beltline; Near public transport; Close to schools; Near shopping; Near trails/greenway; Park nearby
Exterior
- Parking: Driveway parking; Open parking available for four vehicles (total 4 spaces)
- Utilities: Public water; Public sewer; 220 volt electric service; Underground utilities; Sewer and water available
- Home design: One-level home; Resale property
- Construction: Cedar and other construction materials; Tar/gravel roof; Block foundation
- Exterior features: Covered side porch; Other exterior features
Interior
- Kitchen: Kitchen with additional/other features; Appliances: other
- Bedrooms: Six main-level bedrooms; Roommate floor plan
- Flooring: Other flooring
- Bathrooms: Six full bathrooms; Master bath with additional/other features
- Heating & cooling: Central heating; Natural gas heating; Ceiling fans for cooling
- Interior features: No shared/common walls; Crawl space foundation
- Laundry & utility: Laundry with other features
Neighborhood map
What this means for you Summary
Snapshot
- This is a 4-bed/2.0-bath single-family listed at $199k.
Deal economics
- At list price, monthly cash flow is $346 ($4k/yr) — positive.
- The deal already cash-flows at list — no discount required.
- Meets the 1% rule at list price ($2k rent vs $199k).
- Cap rate 8.4% vs local median 3.1% in Atlanta — top-decile yield for the area; either an underpriced asset or a hidden risk that comps aren't pricing in. Stress-test before assuming the spread holds.
Location & tenants
- Location reads 83/100 on livability (#6 in GA, #919 nationally) — a professional / high-income tenant draw. Strengths: amenities A+, commute A+, housing A+; Watch: schools C-, cost of living C-.
- Atlanta Public Schools (urban): math 28% / reading 35% proficiency, ranked #80 of 174 in GA (top 46%) — families likely to look elsewhere, expect single-tenant / working-renter base with shorter leases; 71% free/reduced lunch — lower-income household profile, screen leases tightly.
- Market conditions: Rents rising (+2.5%/yr); 293 active listings in the ZIP; 40 comparable units currently listed for rent nearby; rentals at typical pace (median 24d on market — plan ~3-4 weeks tenant-placement turnaround); lower-income renter base — watch delinquency; 11,565 units permitted in Fulton County in 2024 (8,159 in 5+ unit buildings).
- At $2,272/mo this rent would consume 65% of the median local household income ($42k/yr) (locally 1293% of renters already pay >50% of income on rent) — very limited rent-growth headroom before tenants either downsize or default.
Forward outlook
- Local home prices are declining (-3.0%/yr); year-one equity from $1k of loan paydown is wiped out by about $6k of value loss. Plan a longer hold.
- Fulton County population projected at +38% by 2050 — long-run rental-demand tailwind backs the buy-and-hold thesis.
Negotiation context
- Only 6 days on market — expect competitive offers; lowballing is unlikely to land.
- 8 sale attempts since 13y ago with the ask held roughly flat each time — persistent listings suggest the price (not the market) is what's stuck; bring a comps-based counter.
- Current owner paid $17k; list at $199k implies a 1071% gain — meaningful room to come down on a strong offer.
Risks & watch-outs
- Watch-outs: built in 1940 — expect roof / HVAC / electrical / plumbing capex.
- Climate carrying-cost: major wind risk, 27% chance of damaging wind over 30y; extreme-heat days projected 6→16/yr by 2055 (HVAC capex compounding) — expect insurance premiums to compound above CPI over the hold.
Questions for the listing agent
- Built in 1940 — when were the roof, HVAC, electrical panel, plumbing, and water heater last replaced?
- Is there a deadline driving the sale (1031 exchange, divorce, estate, relocation)? That informs how much negotiation room exists.
- What's the average days-on-market for RENTAL listings here right now (not sales)? A rising rental-DOM trend means longer vacancies and softer asking-rent achievability than the comps imply.
- What's the recent tenant-quality profile in this submarket — average credit score on applications, eviction rate, late-payment / NSF rate, and stable-employment percentage? A property-management company in the area should have these aggregated.
- How much new for-sale + rental construction is in the pipeline within 1–3 miles? Heavy new supply typically softens prices + rents 12–24 months out; constrained supply supports both.
Investment metrics
- 1% rule
- 1.14% ✓
- Cap rate
- 8.38%
- Cash-on-cash
- 7.44%
- DSCR
- 1.33
- GRM
- 7.3
CMA / ARV
- ARV (on-the-fly)
- $362,142
- Comps found
- 12
Show comp detail 12 sales within ~0.75 mi
| Address | Dist | Beds/Ba | Sqft | Sold | Price | $/sf | Match |
|---|---|---|---|---|---|---|---|
| 95 Arcadia Cir NW | 0.21mi | 3/2.0 (-1) | 1,766 (-3%) | 6mo | $195,000 | $110 | 74 |
| 106 Stafford St NW | 0.31mi | 3/2.0 (-1) | 1,750 (-4%) | 2mo | $399,000 | $228 | 72 |
| 224 Chappell Rd NW | 0.25mi | 5/2.5 (+1) | 1,748 (-4%) | 9mo | $215,000 | $123 | 67 |
| 1497 Eason St NW | 0.35mi | 3/2.0 (-1) | 1,710 (-6%) | 6mo | $300,000 | $175 | 63 |
| 1336 Sharon St | 0.27mi | 4/2.0 | 1,612 (-12%) | 6mo | $187,000 | $116 | 63 |
| 1049 Martin Luther King Jr Dr NW | 0.56mi | 4/3.0 | 1,920 (+5%) | 2mo | $303,000 | $158 | 60 |
| 1373 M L King Jr Dr | 0.30mi | 3/2.5 (-1) | 2,054 (+12%) | 0mo | $407,000 | $198 | 58 |
| 185 Rockmart Dr SW | 0.54mi | 4/3.0 | 1,768 (-3%) | 10mo | $325,000 | $184 | 57 |
| 1422 Kennesaw Dr | 0.58mi | 3/2.0 (-1) | 1,624 (-11%) | 1mo | $370,000 | $228 | 49 |
| 1337 M L King Jr Dr NW | 0.30mi | 3/3.0 (-1) | 1,612 (-12%) | 10mo | $410,000 | $254 | 48 |
| 1459 Mozley Pl | 0.53mi | 3/2.5 (-1) | 1,599 (-13%) | 1mo | $389,900 | $244 | 46 |
| 136 Stafford St | 0.53mi | 3/2.0 (-1) | 1,571 (-14%) | 6mo | $445,000 | $283 | 42 |
Match score weights: distance 35% · size 25% · config 20% · recency 20%. Top-matched comps best support the ARV.
Projected returns pro-forma
-3.0% appreciation · 2.53% rent growth · sell at horizon
- IRR
- -5.4%
- Equity multiple
- 0.80×
- Total profit
- $-11,228
- Equity at exit
- $29,672
- IRR
- 3.7%
- Equity multiple
- 1.26×
- Total profit
- $14,540
- Equity at exit
- $17,206
Cash invested: $55,720 (down + closing). Projections, not guarantees.
Landlord ↔ Tenant lean methodology
- Overall (STATE)
- 90 Strongly Landlord-Friendly
- State Georgia
- 90 Strongly Landlord-Friendly · R+3
- County
- — inherits STATE
- City
- — inherits STATE
ZIP-level market 30314
- Home prices YoY
- -22.9%
- Rents YoY
- 2.5%
- Active inventory
- 293
- Price-to-rent
- 7.3×
Monthly cashflow live
- Estimated rent
- $2,272 high interval (Pro) →
- Mortgage (P&I)
- −$1,044
- Tax from tax record
- −$323 /mo · $3,877/yr
- Insurance
- −$83
- HOA
- −$0
- Vacancy / Maint / Mgmt
- −$477
- Net cashflow
- $346
Break-even live
UW: 25.0% down · 7.5% · 30yr · 1.5% tax · 5.0% vac · 8.0% maint · 8.0% mgmt
Financing live
Cash to close
- Down payment
- $49,750
- Closing costs
- $5,970
- Reserves months
- —
- Total cash needed
- —
Loan-product check · same deal, 3 products live
Conventional
25% down · 7.5% · 30yr
- Down + closing
- —
- Monthly P&I
- —
- Monthly cashflow
- —
- DSCR
- —
- Eligible?
- —
Personal DTI + credit; lowest rate.
DSCR
20% down · 8.5% · 30yr
- Down + closing
- —
- Monthly P&I
- —
- Monthly cashflow
- —
- DSCR
- —
- Eligible?
- —
No personal income docs; deal must DSCR.
Hard money
10% down · 12.0% · 12mo
- Down + closing
- —
- Monthly P&I
- —
- Monthly cashflow
- —
- DSCR
- —
- Eligible?
- —
Short-term bridge; refi at stabilization.
Rent comps 40 comps
| Address | Beds | Baths | Sqft | Rent | $/sqft | DOM | Units | Dist |
|---|---|---|---|---|---|---|---|---|
| 1332 Akridge St NW Atlanta, GA | 3.0 | 2.0 | 1400 | $1,775 | $1.27 | 24d | 1 | 0.04mi |
| 120 Burbank Dr NW Atlanta, GA | 3.0 | 2.0 | 1331 | $1,795 | $1.35 | 24d | 1 | 0.08mi |
| 29 Chappell Rd NW Atlanta, GA | 3.0 | 2.0 | 1670 | $1,953 | $1.17 | 21d | 1 | 0.25mi |
| 66 Holly Rd NW Atlanta, GA | 3.0 | 2.5 | 1632 | $2,228 | $1.37 | 1d | 1 | 0.42mi |
| 1448 Rome Dr NW Unit 1448 Atlanta, GA | 3.0 | 2.5 | 1400 | $2,300 | $1.64 | 12d | 1 | 0.42mi |
| 221 Stafford St NW Atlanta, GA | 3.0 | 2.0 | 2293 | $2,400 | $1.05 | 24d | 1 | 0.43mi |
| 1064 Westmoor Dr NW Atlanta, GA | 3.0 | 3.0 | 1770 | $2,300 | $1.30 | 24d | 1 | 0.48mi |
| 1380 Mozley Pl SW Atlanta, GA | 3.0 | 2.0 | 1941 | $1,400 | $0.72 | 7d | 1 | 0.50mi |
| 167 Rockmart Dr SW Atlanta, GA | 4.0 | 3.5 | 2347 | $3,033 | $1.29 | 24d | 1 | 0.51mi |
| 1603 Ezra Church Dr NW Atlanta, GA | 5.0 | 4.0 | 2448 | $6,000 | $2.45 | 24d | 1 | 0.52mi |
| 15 Ollie St NW Atlanta, GA | 3.0 | 2.5 | 1594 | $3,150 | $1.98 | 24d | 1 | 0.60mi |
| 1004 Desoto St NW Atlanta, GA | 3.0 | 2.0 | 1550 | $1,995 | $1.29 | 24d | 1 | 0.60mi |
| 1005 Westmoor Dr NW Unit A Atlanta, GA | 4.0 | 2.0 | 1348 | $1,695 | $1.26 | 24d | 1 | 0.61mi |
| 155 Rosser St SW Atlanta, GA | 3.0 | 2.0 | 1500 | $2,073 | $1.38 | 24d | 1 | 0.63mi |
| 220 Napoleon Dr SW Atlanta, GA | 4.0 | 3.0 | 2500 | $3,199 | $1.28 | 10d | 1 | 0.68mi |
| 1400 North Ave NW Unit A Atlanta, GA | 3.0 | 2.0 | 2456 | $2,600 | $1.06 | 24d | 1 | 0.68mi |
| 198 Wellington St SW Atlanta, GA | 3.0 | 2.5 | 1787 | $2,700 | $1.51 | 24d | 1 | 0.69mi |
| 492 Pierce Ave NW Unit A Atlanta, GA | 4.0 | 2.5 | 2470 | $1,800 | $0.73 | 18d | 1 | 0.73mi |
| 195 W Lake Ave NW Unit 1 Atlanta, GA | 3.0 | 2.0 | 1245 | $2,654 | $2.13 | 24d | 1 | 0.73mi |
| 1000 Palmetto Ave SW Atlanta, GA | 3.0 | 2.0 | 1566 | $1,925 | $1.23 | 24d | 1 | 0.75mi |
| 1181 Westview Dr SW Atlanta, GA | 4.0 | 2.0 | 1392 | $2,400 | $1.72 | 24d | 1 | 0.77mi |
| 176 Racine St SW Atlanta, GA | 3.0 | 2.0 | 1423 | $2,800 | $1.97 | 24d | 1 | 0.78mi |
| 211 Laurel Ave SW Atlanta, GA | 5.0 | 3.0 | 2000 | $3,100 | $1.55 | 24d | 1 | 0.80mi |
| 0 W Lake Ave NW Atlanta, GA | 3.0 | 2.5 | 1300 | $1,900 | $1.46 | 1d | 1 | 0.81mi |
| 272 Joseph E Lowery Blvd NW Atlanta, GA | 3.0 | 1.0 | 1230 | $1,800 | $1.46 | 24d | 1 | 0.82mi |
| 1770 Springview Rd NW Atlanta, GA | 3.0 | 2.0 | 1262 | $2,000 | $1.58 | 24d | 1 | 0.83mi |
| 954 Parsons St SW Atlanta, GA | 4.0 | 3.5 | 1376 | $2,800 | $2.03 | 21d | 1 | 0.86mi |
| 557 Chappell Rd NW Atlanta, GA | 3.0 | 2.0 | 1264 | $1,850 | $1.46 | 5d | 1 | 0.87mi |
| 390 W Lake Ave NW Unit A10 Atlanta, GA | 3.0 | 1.5 | 1256 | $1,275 | $1.02 | 24d | 1 | 0.87mi |
| 390 W Lake Ave NW Apt A1 Atlanta, GA | 3.0 | 1.5 | 1256 | $1,299 | $1.03 | 24d | 1 | 0.87mi |
| 2111 Martin Luther King Junior Dr NW Atlanta, GA | 3.0 | 1.0 | 1470 | $1,800 | $1.22 | 24d | 1 | 0.87mi |
| 884 T P Burruss SR Dr SW Atlanta, GA | 3.0 | 2.0 | 1366 | $2,299 | $1.68 | 24d | 1 | 0.88mi |
| 891 Rock St NW Atlanta, GA | 2.0–3.0 | 2.0 | 1104 | $1,491 | $1.35 | 24d | 4 | 0.89mi |
| 740 Liberty Commons Dr NW #1101 Atlanta, GA | 3.0 | 3.5 | 1890 | $2,600 | $1.38 | 24d | 1 | 0.90mi |
| 152 Joseph Echols Lowery Blvd SW Atlanta, GA | 4.0 | 3.0 | 1822 | $4,000 | $2.20 | 24d | 1 | 0.94mi |
| 60 Paschal Blvd NW Atlanta, GA | 1.0–3.0 | 1.0–2.5 | 945 | $1,625 | $1.72 | 24d | 25 | 0.95mi |
| 415 Hopkins St SW Atlanta, GA | 3.0 | 1.0 | 2550 | $2,000 | $0.78 | 5d | 1 | 0.98mi |
| 455 Joseph E Lowery Blvd NW Atlanta, GA | 3.0 | 2.5 | 1890 | $1,950 | $1.03 | 12d | 1 | 1.02mi |
| 557 W Lake Ave NW Atlanta, GA | 1.0–3.0 | 1.0–2.0 | 1190 | $1,556 | $1.31 | 4d | 9 | 1.06mi |
| 1462 Lucile Ave SW Atlanta, GA | 5.0 | 3.0 | 1700 | $2,300 | $1.35 | 24d | 1 | 1.11mi |
Listing history 6 events
-
2026-06-18days on market $199,000 Active 6 DOM
-
2026-06-17days on market $199,000 Active 5 DOM
-
2026-06-16days on market $199,000 Active 4 DOM
-
2026-06-15days on market $199,000 Active 3 DOM
-
2026-06-13remarks 681-char remark
-
2026-06-13$199,000 Active 1 DOM
ⓘ Source: listings_history table (triggers on properties + properties_extension) + one-shot
backfill from property_details.listing_events for pre-trigger history.
Tax reassessment forecast GA · Resets to sale price
- Current annual tax
- $3,877 · $323/mo
- Projected year-2 tax
- $3,877 · $323/mo
- Expected delta
- $0/yr ($0/mo · 0.0%)
ⓘ Screening estimate from a state-policy table — verify with the county assessor before closing.
Climate risk First Street
- Flood 1/10 Low FEMA zone X (unshaded) · 0% chance over 30 yrs
- Wildfire 1/10 Low
- Heat 5/10 Major 6 d/yr ≥103°F today · 16 d/yr by 30 yrs out
- Wind 6/10 Major 27% chance of damaging wind over 30 yrs
- Air quality 4/10 Moderate 5 unhealthy d/yr today · 7 by 30 yrs out
Nearby sold comps map
Loading sold comps map…
Walkable amenities ~0.75 mi
Loading nearby amenities…
Taxation est. · year 1
- Rental income
- $27,267
- − Mortgage interest
- −$11,147
- − Property taxes
- −$3,877
- − Insurance
- −$995
- − Repairs & maintenance
- −$2,181
- − Management
- −$2,181
- − Depreciation
- −$5,789
- Taxable income
- $1,097
- Est. tax owed @ 24.0%
- −$263
- After-tax cash flow
- $3,883/yr
For passive investors: Depreciation is non-cash, so a rental often shows a tax loss while cash-flowing — sheltering income. Rental losses are passive: they offset passive income freely, and up to $25,000/yr can offset ordinary (W-2) income if you actively participate and your MAGI is under $100k (phasing out to $0 by $150k); unused losses carry forward. On sale, claimed depreciation is recaptured at up to 25%, and gains may owe capital-gains tax (a 1031 exchange can defer both). Figures are a year-1 estimate at your 24.0% rate — not tax advice; consult a CPA.
Schools (NCES district)
- District
- Atlanta Public Schools
- NCES district ID
- 1300120
- Math proficiency
- 28% ▼ -6.00%
- Reading proficiency
- 35% ▼ -2.00%
- Median HH income
- $48,306
- Composite
- 27.27/100
- National rank
- #7006
- State rank
- #80 of 174 in GA
Livability — Atlanta
- Score
- 83/100
- State rank
- #6
- US rank
- #919
Category grades
Schools grade is shown separately in the Schools card above.
Census & demographics
- Census place
- Atlanta, GA
- County
- Fulton County · 1,094,430 people
- City population
- 629,525
- Metro
- Atlanta-Sandy Springs-Alpharetta, GA
- Population (ZIP)
- 23,333
- Household income
- $42,089
- Rent vs Own
- Severe rent burden
- 1293.0
Population outlook (Fulton County) Hauer SSP2
- Today (2025)
- 1,203,707 people
- By 2030
- 1,299,706 · +8.0%
- By 2040
- 1,488,256 · +23.6%
- By 2050
- 1,664,580 · +38.3%
- By 2075
- 2,036,072 · +69.2%
- By 2100
- 2,222,402 · +84.6%
Race, ethnicity, and origin ACS 2023
- Neighborhood character
- Predominantly Black (76%)
- Race & ethnicity
- Black 76% White 11% Hispanic / Latino 7% Asian 4% Two or more races 3%
- Hispanic origin (detail)
- Mexican 4% Dominican 1%
- Common ancestry
- Lithuanian 1%
- Foreign-born
- 6% · Canada, China, South Korea
- Languages at home
- 89% English-only · Spanish 5% Other Indo-European 1% Chinese 1%
Political lean MEDSL · Fulton
- 2024 margin
- Solid D (+44.9) · D 71.9% · R 27.0% · Other 1.1%
- 2008→2024 swing
- +9.8pp toward D · 2008: 35.0pp · 2024: 44.9pp
- All cycles
- 2024: D+44.9 2020: D+46.4 2016: D+42.1 2012: D+29.6 2008: D+35.0
Not yet ingested
- Civics
- —
Market trends
- HPI YoY
- ▼ -95.32%
- Current HPI
- 321.4626
- Rent YoY
- ▲ 2.53%
- Metro
- Atlanta-Sandy Springs-Alpharetta, GA
- State GDP YoY
- ▲ 2.66%
- F500 in state
- 28
Industry mix (Fortune 500 HQ in GA)
| Industry | F500 HQs | Revenue |
|---|---|---|
| Paper / Packaging | 2 | $29B |
|
||
| Retail | 1 | $160B |
|
||
| Transportation / Logistics | 1 | $91B |
|
||
| Airlines | 1 | $62B |
|
||
| Consumer Goods | 1 | $47B |
|
||
| Utilities | 1 | $25B |
|
||
Price history
+17.1% since first listed32 events — show timeline
- 2026-06-12 Listed $199,000 FMLS
- 2026-06-12 Listed $199,000 FMLS
- 2015-05-12 Price Changed $17,000 FMLS
- 2015-05-11 Listing Removed — FMLS
- 2015-05-10 Price Changed $17,000 GAMLS
- 2015-04-25 Contingent — FMLS
- 2015-04-25 Pending — GAMLS
- 2015-04-25 Price Changed $22,100 GAMLS
- 2015-03-14 Sold (MLS) $17,000 GAMLS
- 2015-03-13 Price Changed $22,100 FMLS
- 2015-03-13 Sold (MLS) $17,000 FMLS
- 2015-01-07 Relisted — GAMLS
- 2015-01-07 Listing Removed — GAMLS
- 2015-01-02 Listed $22,000 FMLS
- 2014-12-30 Listing Removed — FMLS
- 2014-11-27 Price Changed $22,000 FMLS
- 2014-11-27 Price Changed $22,100 FMLS
- 2014-11-02 Price Changed $22,000 FMLS
- 2014-11-02 Price Changed $22,100 FMLS
- 2014-10-06 Listed $22,100 GAMLS
- 2014-10-04 Price Changed $22,100 FMLS
- 2014-10-01 Listing Removed — GAMLS
- 2014-09-28 Price Changed $22,000 GAMLS
- 2014-09-28 Listed $22,000 FMLS
- 2014-05-09 Listing Removed — FMLS
- 2014-03-13 Price Changed $53,000 GAMLS
- 2014-03-12 Price Changed $53,000 FMLS
- 2014-01-19 Listed $59,000 GAMLS
- 2013-12-21 Listed $59,000 FMLS
- 2005-06-06 Sold (Public Records) $190,000 Public Records
- 2003-11-18 Sold (Public Records) $170,000 Public Records
- 2003-09-16 Sold (Public Records) $170,000 Public Records
Property tax history
+5.7%/yrLatest (2025): $3,877 · -0.2% YoY. Source: county tax records.
Cash-flow waterfall
monthlySold comps — $/sqft
last 12 mo · ≤1 miLoading sold comps…