107 S Buckingham St · Hardwick, MN
Flood risk 1/10 · Minimal
- FEMA flood zone
- —
- Chance of flooding over 30 yrs
- 0.0%
- Est. flood insurance / yr
- —
Fire risk 2/10 · Minimal
- Est. fire insurance / yr
- $888 – $1,650
Heat risk 2/10 · Minimal
- Hot days now (above 98°F)
- 7 days/yr
- Hot days in 30 yrs
- 15 days/yr
Wind risk 2/10 · Minimal
- Chance of severe wind over 30 yrs
- —
Air-quality risk 2/10 · Minimal
- Unhealthy air days now
- 1 days/yr
- Unhealthy air days in 30 yrs
- 1 days/yr
Risk factors via First Street. Map © Google.
Why this score? — see what drove the B grade
The composite is a weighted blend of 9 inputs, each scored 0–100. Each bar is that input's sub-score; the figure is the points it added to the 100-point composite (weight × sub-score).
- Cash flow +28.4/30.0
- DSCR +10.0/10.0
- ARV discount +7.5/15.0
- 1% rule +7.1/10.0
- Appreciation +5.0/10.0
- Schools +4.8/10.0
- Livability +2.9/5.0
- Rent growth +2.5/5.0
- Condition / age +2.5/5.0
$79,000
🖨 Deal sheet 📄 Offer letter ✓ Due diligence
Listing remarks MLS
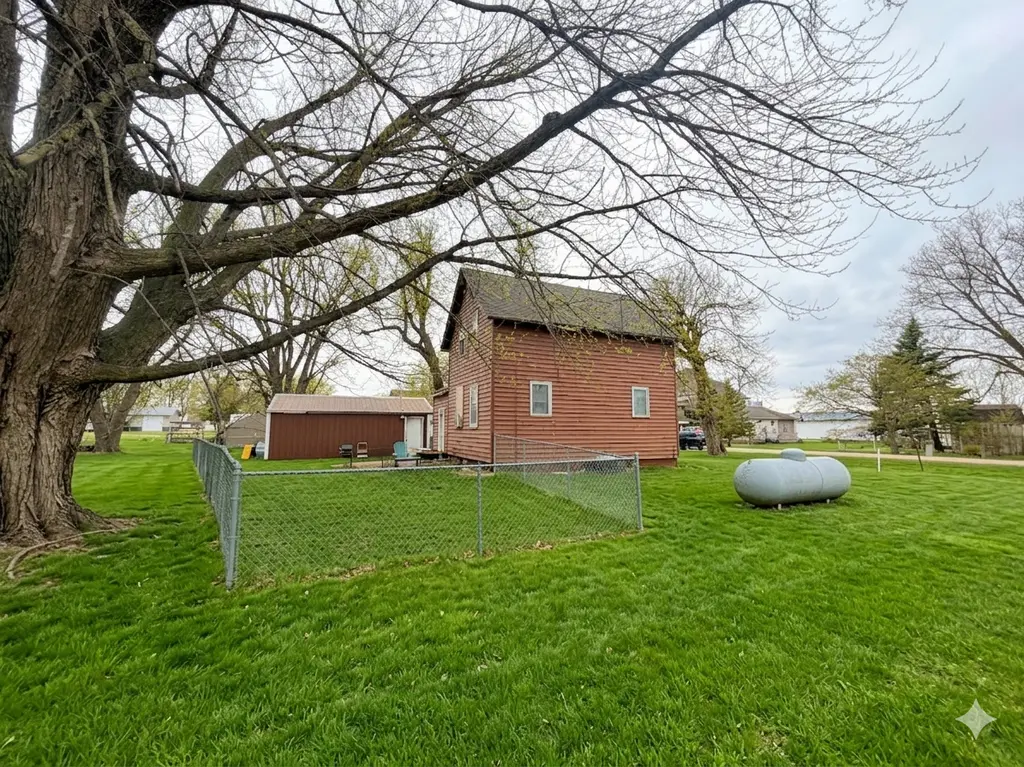
Located in the stable, high-demand Luverne School District,, this home offers 3 bed and 1 bath with an expansive yard! Hardwick offers the perfect "quiet escape" for renters and travelers while maintaining strong property values. With low annual taxes and high rental demand in Rock County, this is a high-yield asset for any portfolio. Investor Note: Skip the renovation and the vacancy period. This property is a "plug-and-play" asset with an established rental history and is currently operating as a successful long-term rental.
Key facts
- 5,837 sq ft lot
- Garage
- Built 1953
Neighborhood map
What this means for you Summary
Snapshot
- This is a 3-bed/1.0-bath single-family listed at $79k.
Deal economics
- At list price, monthly cash flow is $255 ($3k/yr) — positive.
- The deal already cash-flows at list — no discount required.
- Meets the 1% rule at list price ($960 rent vs $79k).
- Recommended offer: $72k (9.0% below list) — sets the bar for market timing.
Location & tenants
- Location reads 58/100 on livability (#819 in MN) — a working-class tenant base; expect higher turnover. Strengths: cost of living A+, housing A+; Watch: crime D, schools F, amenities F.
- Luverne Public School District (rural): math 55% / reading 58% proficiency, ranked #64 of 301 in MN (top 21%) — acceptable for families but not a draw, mixed tenant base, ~2y average lease.
- Market conditions: 3 active listings in the ZIP; 66 units permitted in Rock County in 2024 (50 in 5+ unit buildings).
Forward outlook
- In year one you build about $3k of equity ($546 loan paydown + $2k appreciation (3.0% local appreciation)).
- Rock County population projected to shrink 9% by 2050 — rents likely to lag national; underwrite the cash flow, not the appreciation.
- At projected returns (3.0% appreciation + 3.0% rent growth), your $22k cash investment doubles in ~4 years — after that, you're playing with house money.
Negotiation context
- It's been on market 99 days — a 9% lower offer ($72k) is reasonable based on typical stale-listing flexibility.
- 2 sale attempts since 10y ago with the ask held roughly flat each time — persistent listings suggest the price (not the market) is what's stuck; bring a comps-based counter.
- Current owner paid $20k; list at $79k implies a 295% gain — meaningful room to come down on a strong offer.
Risks & watch-outs
- Watch-outs: built in 1953 — expect roof / HVAC / electrical / plumbing capex.
Questions for the listing agent
- It's been on market 99 days. Have you received any prior offers? Is the seller open to a 9% concession, seller financing, or rate buy-down credit?
- Built in 1953 — when were the roof, HVAC, electrical panel, plumbing, and water heater last replaced?
- Why hasn't it sold? Are there any deal-killer items the seller is aware of (foundation, flood, title, zoning, code violations)?
- Is there a deadline driving the sale (1031 exchange, divorce, estate, relocation)? That informs how much negotiation room exists.
- Schools are F-rated, which usually means shorter tenancies and higher turnover. Who's the typical renter profile here, and what's been the actual vacancy rate?
- Crime grade is D in this area — have there been break-ins, vandalism, or insurance claims at this property in the last 3 years? What carrier currently insures it and at what premium?
- What's the average days-on-market for RENTAL listings here right now (not sales)? A rising rental-DOM trend means longer vacancies and softer asking-rent achievability than the comps imply.
- What's the recent tenant-quality profile in this submarket — average credit score on applications, eviction rate, late-payment / NSF rate, and stable-employment percentage? A property-management company in the area should have these aggregated.
- How much new for-sale + rental construction is in the pipeline within 1–3 miles? Heavy new supply typically softens prices + rents 12–24 months out; constrained supply supports both.
Investment metrics
- 1% rule
- 1.21% ✓
- Cap rate
- 10.17%
- Cash-on-cash
- 13.84%
- DSCR
- 1.62
- GRM
- 6.9
CMA / ARV
No comps found within radius.
Projected returns pro-forma
3.0% appreciation · 3.0% rent growth · sell at horizon
- IRR
- 20.5%
- Equity multiple
- 2.16×
- Total profit
- $25,757
- Equity at exit
- $35,522
- IRR
- 21.6%
- Equity multiple
- 4.12×
- Total profit
- $68,912
- Equity at exit
- $54,743
Cash invested: $22,120 (down + closing). Projections, not guarantees.
Landlord ↔ Tenant lean methodology
- Overall (STATE)
- 46 Balanced
- State Minnesota
- 46 Balanced · D+2
- County
- — inherits STATE
- City
- — inherits STATE
ZIP-level market 56134
- Active inventory
- 3
- Price-to-rent
- 6.9×
Monthly cashflow live
- Estimated rent
- $960 medium interval (Pro) →
- Mortgage (P&I)
- −$414
- Tax from tax record
- −$56 /mo · $670/yr
- Insurance
- −$33
- HOA
- −$0
- Vacancy / Maint / Mgmt
- −$202
- Net cashflow
- $255
Break-even live
UW: 25.0% down · 7.5% · 30yr · 1.5% tax · 5.0% vac · 8.0% maint · 8.0% mgmt
Financing live
Cash to close
- Down payment
- $19,750
- Closing costs
- $2,370
- Reserves months
- —
- Total cash needed
- —
Loan-product check · same deal, 3 products live
Conventional
25% down · 7.5% · 30yr
- Down + closing
- —
- Monthly P&I
- —
- Monthly cashflow
- —
- DSCR
- —
- Eligible?
- —
Personal DTI + credit; lowest rate.
DSCR
20% down · 8.5% · 30yr
- Down + closing
- —
- Monthly P&I
- —
- Monthly cashflow
- —
- DSCR
- —
- Eligible?
- —
No personal income docs; deal must DSCR.
Hard money
10% down · 12.0% · 12mo
- Down + closing
- —
- Monthly P&I
- —
- Monthly cashflow
- —
- DSCR
- —
- Eligible?
- —
Short-term bridge; refi at stabilization.
Listing history 21 events
-
2026-06-18days on market $79,000 Active 99 DOM
-
2026-06-17days on market $79,000 Active 98 DOM
-
2026-06-16days on market $79,000 Active 97 DOM
-
2026-06-15days on market $79,000 Active 96 DOM
-
2026-06-13days on market $79,000 Active 94 DOM
-
2026-06-12days on market $79,000 Active 93 DOM
-
2026-06-09days on market $79,000 Active 90 DOM
-
2026-06-08days on market $79,000 Active 89 DOM
-
2026-06-07days on market $79,000 Active 88 DOM
-
2026-06-07days on market $79,000 Active 87 DOM
-
2026-06-04days on market $79,000 Active 84 DOM
-
2026-06-02days on market $79,000 Active 83 DOM
-
2026-06-01days on market $79,000 Active 82 DOM
-
2026-05-31days on market $79,000 Active 81 DOM
-
2026-05-31days on market $79,000 Active 80 DOM
-
2026-03-11$79,000 Active 554-char remark
Show marketing remark (554 chars)
Located in the stable, high-demand Luverne School District,, this home offers 3 bed and 1 bath with an expansive yard! Hardwick offers the perfect "quiet escape" for renters and travelers while maintaining strong property values. With low annual taxes and high rental demand in Rock County, this is a high-yield asset for any portfolio. Investor Note: Skip the renovation and the vacancy period. This property is a "plug-and-play" asset with an established rental history and is currently operating as a successful long-term rental.
-
2016-06-29soldstatus $20,000 321-char remark
Show marketing remark (321 chars)
A Fully Furnished Starter Home! Here is a very reasonable fully furnished starter home or investment property. It features 3 bedrooms, a full bath, kitchen with all appliances included. This property includes a large fenced in back yard. There is also a double stall garage. Give a call today to take a look at this home.
-
2016-06-06$24,500 321-char remark
Show marketing remark (321 chars)
A Fully Furnished Starter Home! Here is a very reasonable fully furnished starter home or investment property. It features 3 bedrooms, a full bath, kitchen with all appliances included. This property includes a large fenced in back yard. There is also a double stall garage. Give a call today to take a look at this home.
-
2009-08-19soldstatus $36,000
-
2005-12-01soldstatus $33,450
-
2001-11-01soldstatus $6,250
ⓘ Source: listings_history table (triggers on properties + properties_extension) + one-shot
backfill from property_details.listing_events for pre-trigger history.
Tax reassessment forecast MN · Partial reset (capped growth)
- Current annual tax
- $670 · $56/mo
- Projected year-2 tax
- $777 · $65/mo
- Expected delta
- +$107/yr (+$9/mo · 16.0%)
ⓘ Screening estimate from a state-policy table — verify with the county assessor before closing.
Climate risk First Street
- Flood 1/10 Low 0% chance over 30 yrs
- Wildfire 2/10 Low
- Heat 2/10 Low 7 d/yr ≥98°F today · 15 d/yr by 30 yrs out
- Wind 2/10 Low
- Air quality 2/10 Low 1 unhealthy d/yr today · 1 by 30 yrs out
Nearby sold comps map
Loading sold comps map…
Walkable amenities ~0.75 mi
Loading nearby amenities…
Taxation est. · year 1
- Rental income
- $11,517
- − Mortgage interest
- −$4,425
- − Property taxes
- −$670
- − Insurance
- −$395
- − Repairs & maintenance
- −$921
- − Management
- −$921
- − Depreciation
- −$2,298
- Taxable income
- $1,886
- Est. tax owed @ 24.0%
- −$453
- After-tax cash flow
- $2,609/yr
For passive investors: Depreciation is non-cash, so a rental often shows a tax loss while cash-flowing — sheltering income. Rental losses are passive: they offset passive income freely, and up to $25,000/yr can offset ordinary (W-2) income if you actively participate and your MAGI is under $100k (phasing out to $0 by $150k); unused losses carry forward. On sale, claimed depreciation is recaptured at up to 25%, and gains may owe capital-gains tax (a 1031 exchange can defer both). Figures are a year-1 estimate at your 24.0% rate — not tax advice; consult a CPA.
Schools (NCES district)
- District
- Luverne Public School District
- NCES district ID
- 2718330
- Math proficiency
- 55% ▼ -14.00%
- Reading proficiency
- 58% ▼ -2.00%
- Median HH income
- $48,225
- Composite
- 48.0/100
- National rank
- #2198
- State rank
- #64 of 301 in MN
Livability — Hardwick
- Score
- 58/100
- State rank
- #819
- US rank
- #21268
Category grades
Schools grade is shown separately in the Schools card above.
Census & demographics
- Census place
- Hardwick, MN
- Population (ZIP)
- 405
Population outlook (Rock County) Hauer SSP2
- Today (2025)
- 9,476 people
- By 2030
- 9,326 · -1.6%
- By 2040
- 9,006 · -5.0%
- By 2050
- 8,662 · -8.6%
- By 2075
- 7,973 · -15.9%
- By 2100
- 7,033 · -25.8%
Race, ethnicity, and origin ACS 2023
- Neighborhood character
- Predominantly White (80%)
- Race & ethnicity
- White 80% Hispanic / Latino 17% Two or more races 9%
- Hispanic origin (detail)
- Mexican 12%
- Common ancestry
- Iranian 16% Portuguese 13% Hungarian 3%
- Foreign-born
- 4% · Canada
- Languages at home
- 89% English-only · Spanish 10% German/W. Germanic 1%
Political lean MEDSL · Rock
- 2024 margin
- Solid R (+39.3) · D 29.6% · R 68.8% · Other 1.6%
- 2008→2024 swing
- -25.3pp toward R · 2008: -14.0pp · 2024: -39.3pp
- All cycles
- 2024: R+39.3 2020: R+38.7 2016: R+35.7 2012: R+17.9 2008: R+14.0
Not yet ingested
- Civics
- —
Market trends
- HPI YoY
- —
- Current HPI
- —
- Rent YoY
- —
- Metro
- —
- State GDP YoY
- ▲ 2.41%
- F500 in state
- 34
Industry mix (Fortune 500 HQ in MN)
| Industry | F500 HQs | Revenue |
|---|---|---|
| Healthcare | 2 | $407B |
|
||
| Retail | 2 | $150B |
|
||
| Consumer Goods | 2 | $32B |
|
||
| Industrial Machinery | 2 | $6B |
|
||
| Agriculture | 1 | $40B |
|
||
| Healthcare / Medical Devices | 1 | $32B |
|
||
Price history
+1164.0% since first listed6 events — show timeline
- 2026-03-11 Listed $79,000 NORTHSTARMLS as Distributed by MLS Grid
- 2016-06-29 Sold (MLS) $20,000 RASM
- 2016-06-06 Listed $24,500 RASM
- 2009-08-19 Sold (Public Records) $36,000 Public Records
- 2005-12-01 Sold (Public Records) $33,450 Public Records
- 2001-11-01 Sold (Public Records) $6,250 Public Records
Property tax history
+13.5%/yrLatest (2025): $670 · +9.5% YoY. Source: county tax records.
Cash-flow waterfall
monthlySold comps — $/sqft
last 12 mo · ≤1 miLoading sold comps…