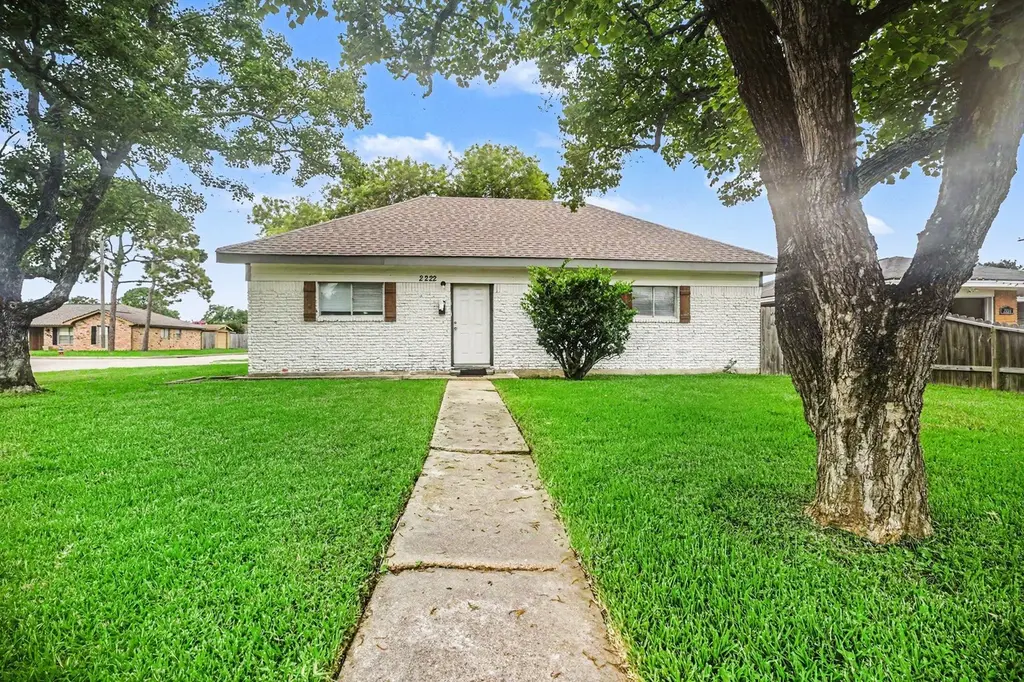
2222 20th Ave N · Texas City, TX
Flood risk 8/10 · Major
- FEMA flood zone
- X
- Chance of flooding over 30 yrs
- 0.77%
- Est. flood insurance / yr
- $507 – $1,088
Fire risk 1/10 · Minimal
- Est. fire insurance / yr
- $1,222 – $2,270
Heat risk 10/10 · Severe
- Hot days now (above 108°F)
- 7 days/yr
- Hot days in 30 yrs
- 26 days/yr
Wind risk 9/10 · Severe
- Chance of severe wind over 30 yrs
- 99.0%
Air-quality risk 2/10 · Minimal
- Unhealthy air days now
- 2 days/yr
- Unhealthy air days in 30 yrs
- 2 days/yr
Risk factors via First Street. Map © Google.
Why this score? — see what drove the C+ grade
The composite is a weighted blend of 9 inputs, each scored 0–100. Each bar is that input's sub-score; the figure is the points it added to the 100-point composite (weight × sub-score).
- Cash flow +23.9/30.0
- ARV discount +15.0/15.0
- DSCR +7.7/10.0
- 1% rule +6.4/10.0
- Rent growth +3.7/5.0
- Livability +3.1/5.0
- Condition / age +2.5/5.0
- Schools +2.4/10.0
- Appreciation +0.0/10.0
$159,900
🖨 Deal sheet 📄 Offer letter ✓ Due diligence
Listing remarks MLS
3 bedroom 1 bathroom home with a 1 car garage.
Key facts
- Quartz countertops
- Newer roof
- Updated kitchen
Tags
Property features AI
Finance
- Financial info: Lease not considered
Exterior
- Parking: Attached garage with additional parking (1-car garage)
- Security: Smoke detectors
- Utilities: Public water; Public sewer
- Home design: Residential property; One-story; Slab foundation; Facing composition roof
- Construction: Brick and wood siding construction; Built in 1954
- Exterior features: Fully fenced yard; Back yard fencing; Corner lot; Cleared lot; Backs to greenbelt/park; Asphalt road frontage
Interior
- Kitchen: Dishwasher; Gas cooktop; Gas oven; Garbage disposal; Refrigerator
- Bedrooms: Four bedrooms on the first floor (sizes: 10x10, 12x10, 14x10, 20x11)
- Flooring: Plank; Tile; Vinyl
- Bathrooms: One full bathroom (first floor, 10x6)
- Heating & cooling: Central heating (electric); Central air (electric)
- Interior features: Quartz countertops; Self-closing cabinet doors; Tub/shower; Ceiling fans; Kitchen/dining combo
- Laundry & utility: Washer hookup; Electric dryer hookup
Neighborhood map
What this means for you Summary
Snapshot
- This is a 4-bed/1.0-bath single-family listed at $160k.
Deal economics
- At list price, monthly cash flow is $244 ($3k/yr) — positive.
- The deal already cash-flows at list — no discount required.
- Meets the 1% rule at list price ($2k rent vs $160k).
- Cap rate 8.6% vs local median 4.3% in Texas City — top-decile yield for the area; either an underpriced asset or a hidden risk that comps aren't pricing in. Stress-test before assuming the spread holds.
Location & tenants
- Location reads 62/100 on livability (#907 in TX) — a middle-class / working-renter tenant base. Strengths: cost of living A+, housing A+; Watch: crime D+, amenities F, commute F.
- Texas City ISD (suburban): math 28% / reading 29% proficiency, ranked #655 of 826 in TX (top 79%) — low school quality limits family demand, transient renter base, plan for 1-2y turnover; 66% free/reduced lunch — lower-income household profile, screen leases tightly.
- Zoned schools: Blocker Middle (math 33% / reading 36%, grade F, #858 of 1,662 statewide, top 54%, 865 students, 80% FRL); Texas City H S (math 32% / reading 36%, grade F, #1,002 of 1,632 statewide, top 62%, 1,718 students, 72% FRL).
- Market conditions: Rents rising fast (+4.9%/yr); 292 active listings in the ZIP; 11 comparable units currently listed for rent nearby; rentals at typical pace (median 25d on market — plan ~3-4 weeks tenant-placement turnaround); 45% of comp listings sitting > 30 days — soft ceiling on asking rent; 3,258 units permitted in Galveston County in 2024 (0 in 5+ unit buildings).
- This rent runs 33% of the median local income ($66k/yr) — at the standard rent-burdened threshold; future hikes will face affordability resistance.
Forward outlook
- Local home prices are declining (-3.0%/yr); year-one equity from $1k of loan paydown is wiped out by about $5k of value loss. Plan a longer hold.
- Galveston County population projected at +43% by 2050 — long-run rental-demand tailwind backs the buy-and-hold thesis.
Negotiation context
- Only 8 days on market — expect competitive offers; lowballing is unlikely to land.
- 3 sale attempts since 17y ago with the ask held roughly flat each time — persistent listings suggest the price (not the market) is what's stuck; bring a comps-based counter.
- Current owner paid $30k; list at $160k implies a 433% gain — meaningful room to come down on a strong offer.
Risks & watch-outs
- Watch-outs: flood insurance adds $66/mo; built in 1954 — expect roof / HVAC / electrical / plumbing capex.
- Climate carrying-cost: severe flood risk; severe wind risk, 99% chance of damaging wind over 30y; extreme-heat days projected 7→26/yr by 2055 (HVAC capex compounding) — expect insurance premiums to compound above CPI over the hold.
Questions for the listing agent
- Built in 1954 — when were the roof, HVAC, electrical panel, plumbing, and water heater last replaced?
- What's the actual annual flood-insurance premium (NFIP or private), and is the property in a SFHA with mandatory coverage?
- Is there a deadline driving the sale (1031 exchange, divorce, estate, relocation)? That informs how much negotiation room exists.
- Schools are F-rated, which usually means shorter tenancies and higher turnover. Who's the typical renter profile here, and what's been the actual vacancy rate?
- Crime grade is D in this area — have there been break-ins, vandalism, or insurance claims at this property in the last 3 years? What carrier currently insures it and at what premium?
- What's the average days-on-market for RENTAL listings here right now (not sales)? A rising rental-DOM trend means longer vacancies and softer asking-rent achievability than the comps imply.
- What's the recent tenant-quality profile in this submarket — average credit score on applications, eviction rate, late-payment / NSF rate, and stable-employment percentage? A property-management company in the area should have these aggregated.
- How much new for-sale + rental construction is in the pipeline within 1–3 miles? Heavy new supply typically softens prices + rents 12–24 months out; constrained supply supports both.
Investment metrics
- 1% rule
- 1.14% ✓
- Cap rate
- 8.63%
- Cash-on-cash
- 8.33%
- DSCR
- 1.37
- GRM
- 7.3
CMA / ARV
- ARV (on-the-fly)
- $202,884
- Comps found
- 12
Show comp detail 12 sales within ~0.75 mi
| Address | Dist | Beds/Ba | Sqft | Sold | Price | $/sf | Match |
|---|---|---|---|---|---|---|---|
| 2410 21st Ave N | 0.15mi | 4/2.0 | 1,288 (+1%) | 2mo | $160,000 | $124 | 86 |
| 2206 18th Ave N | 0.11mi | 3/1.0 (-1) | 1,162 (-9%) | 0mo | $115,000 | $99 | 74 |
| 2013 17th Ave N | 0.28mi | 3/2.0 (-1) | 1,355 (+6%) | 1mo | $229,900 | $170 | 67 |
| 2604 27th Ave N | 0.51mi | 3/2.0 (-1) | 1,261 (-1%) | 2mo | $210,000 | $167 | 64 |
| 2113 22nd Ave N | 0.13mi | 3/2.0 (-1) | 1,418 (+11%) | 9mo | $224,990 | $159 | 59 |
| 1513 21st St N | 0.31mi | 3/1.5 (-1) | 1,152 (-10%) | 6mo | $175,000 | $152 | 57 |
| 1702 16th Ave N | 0.49mi | 3/2.0 (-1) | 1,355 (+6%) | 2mo | $242,000 | $179 | 56 |
| 2009 15th Ave N | 0.39mi | 3/1.0 (-1) | 1,412 (+11%) | 3mo | $189,900 | $134 | 56 |
| 2401 33rd Ave N | 0.69mi | 4/2.0 | 1,311 (+3%) | 8mo | $209,000 | $159 | 53 |
| 2419 29th Ave N | 0.50mi | 3/2.0 (-1) | 1,395 (+9%) | 3mo | $239,900 | $172 | 49 |
| 2814 12th Ave N | 0.73mi | 3/1.5 (-1) | 1,346 (+6%) | 1mo | $172,000 | $128 | 49 |
| 2602 31st Ave N | 0.69mi | 3/2.0 (-1) | 1,422 (+11%) | 8mo | $209,000 | $147 | 33 |
Match score weights: distance 35% · size 25% · config 20% · recency 20%. Top-matched comps best support the ARV.
Projected returns pro-forma
-3.0% appreciation · 4.91% rent growth · sell at horizon
- IRR
- -3.9%
- Equity multiple
- 0.85×
- Total profit
- $-6,714
- Equity at exit
- $23,842
- IRR
- 8.0%
- Equity multiple
- 1.66×
- Total profit
- $29,688
- Equity at exit
- $13,825
Cash invested: $44,772 (down + closing). Projections, not guarantees.
Landlord ↔ Tenant lean methodology
- Overall (STATE)
- 87 Strongly Landlord-Friendly
- State Texas
- 87 Strongly Landlord-Friendly · R+5
- County
- — inherits STATE
- City
- — inherits STATE
ZIP-level market 77590
- Home prices YoY
- -19.3%
- Rents YoY
- 4.9%
- Active inventory
- 292
- Price-to-rent
- 7.3×
Monthly cashflow live
- Estimated rent
- $1,816 high interval (Pro) →
- Mortgage (P&I)
- −$839
- Tax from tax record
- −$219 /mo · $2,623/yr
- Insurance
- −$67
- Flood insurance flood zone
- −$66 /mo · $798/yr
- HOA
- −$0
- Vacancy / Maint / Mgmt
- −$381
- Net cashflow
- $244
Break-even live
UW: 25.0% down · 7.5% · 30yr · 1.5% tax · 5.0% vac · 8.0% maint · 8.0% mgmt
Financing live
Cash to close
- Down payment
- $39,975
- Closing costs
- $4,797
- Reserves months
- —
- Total cash needed
- —
Loan-product check · same deal, 3 products live
Conventional
25% down · 7.5% · 30yr
- Down + closing
- —
- Monthly P&I
- —
- Monthly cashflow
- —
- DSCR
- —
- Eligible?
- —
Personal DTI + credit; lowest rate.
DSCR
20% down · 8.5% · 30yr
- Down + closing
- —
- Monthly P&I
- —
- Monthly cashflow
- —
- DSCR
- —
- Eligible?
- —
No personal income docs; deal must DSCR.
Hard money
10% down · 12.0% · 12mo
- Down + closing
- —
- Monthly P&I
- —
- Monthly cashflow
- —
- DSCR
- —
- Eligible?
- —
Short-term bridge; refi at stabilization.
Rent comps 11 comps
| Address | Beds | Baths | Sqft | Rent | $/sqft | DOM | Units | Dist |
|---|---|---|---|---|---|---|---|---|
| 2418 14th Ave N Texas City, TX | 3.0 | 2.0 | 1488 | $1,775 | $1.19 | 3d | 1 | 0.39mi |
| 2608 21st St N Texas City, TX | 3.0 | 2.0 | 974 | $1,400 | $1.44 | 44d | 1 | 0.46mi |
| 2602 21st St N Texas City, TX | 1.0–3.0 | 1.0–2.0 | 768 | $1,450 | $1.89 | 1d | 44 | 0.53mi |
| 1919 13th Ave N Texas City, TX | 1.0–3.0 | 1.0–2.0 | 950 | $1,499 | $1.58 | 2d | 6 | 0.59mi |
| 2622 34th Ave N Texas City, TX | 3.0 | 1.0 | 1476 | $1,725 | $1.17 | 44d | 1 | 0.81mi |
| 2714 5th Ave N Texas City, TX | 3.0 | 2.0 | 1382 | $1,800 | $1.30 | 44d | 1 | 1.07mi |
| 2526 3rd 1/2 Ave N Texas City, TX | 3.0 | 2.0 | 1240 | $1,550 | $1.25 | 24d | 1 | 1.10mi |
| 3106 Danforth Dr Texas City, TX | 3.0 | 1.0 | 1100 | $1,800 | $1.64 | 24d | 1 | 1.22mi |
| 3510 Oleander Ave Unit 1545914P Texas City, TX | 3.0 | 2.0 | 1808 | $3,902 | $2.16 | 17d | 1 | 1.33mi |
| 701 22nd Ave N Texas City, TX | 3.0 | 2.0 | 1011 | $1,386 | $1.37 | 44d | 1 | 1.41mi |
| 625 26th Ave N Texas City, TX | 4.0 | 2.0 | 1782 | $1,945 | $1.09 | 44d | 1 | 1.48mi |
Listing history 6 events
-
2026-06-18days on market $159,900 Active 8 DOM
-
2026-06-17days on market $159,900 Active 7 DOM
-
2026-06-16days on market $159,900 Active 6 DOM
-
2026-06-15days on market $159,900 Active 5 DOM
-
2026-06-13remarks 699-char remark
-
2026-06-13$159,900 Active 3 DOM
ⓘ Source: listings_history table (triggers on properties + properties_extension) + one-shot
backfill from property_details.listing_events for pre-trigger history.
Tax reassessment forecast TX · Resets to sale price
- Current annual tax
- $2,623 · $219/mo
- Projected year-2 tax
- $2,926 · $244/mo
- Expected delta
- +$304/yr (+$25/mo · 11.6%)
ⓘ Screening estimate from a state-policy table — verify with the county assessor before closing.
Climate risk First Street
- Flood 8/10 Severe FEMA zone X · 77% chance over 30 yrs
- Wildfire 1/10 Low
- Heat 10/10 Extreme 7 d/yr ≥108°F today · 26 d/yr by 30 yrs out
- Wind 9/10 Extreme 99% chance of damaging wind over 30 yrs
- Air quality 2/10 Low 2 unhealthy d/yr today · 2 by 30 yrs out
Nearby sold comps map
Loading sold comps map…
Walkable amenities ~0.75 mi
Loading nearby amenities…
Taxation est. · year 1
- Rental income
- $21,790
- − Mortgage interest
- −$8,957
- − Property taxes
- −$2,623
- − Insurance
- −$1,597
- − Repairs & maintenance
- −$1,743
- − Management
- −$1,743
- − Depreciation
- −$4,652
- Taxable income
- $475
- Est. tax owed @ 24.0%
- −$114
- After-tax cash flow
- $2,818/yr
For passive investors: Depreciation is non-cash, so a rental often shows a tax loss while cash-flowing — sheltering income. Rental losses are passive: they offset passive income freely, and up to $25,000/yr can offset ordinary (W-2) income if you actively participate and your MAGI is under $100k (phasing out to $0 by $150k); unused losses carry forward. On sale, claimed depreciation is recaptured at up to 25%, and gains may owe capital-gains tax (a 1031 exchange can defer both). Figures are a year-1 estimate at your 24.0% rate — not tax advice; consult a CPA.
Schools (NCES district)
- District
- Texas City ISD
- NCES district ID
- 4842510
- Math proficiency
- 28% ▼ -10.00%
- Reading proficiency
- 29% ▼ -4.00%
- Median HH income
- $44,875
- Composite
- 24.47/100
- National rank
- #7664
- State rank
- #655 of 826 in TX
Livability — Texas City
- Score
- 62/100
- State rank
- #907
- US rank
- #16268
Category grades
Schools grade is shown separately in the Schools card above.
Census & demographics
- Census place
- Texas City, TX
- County
- Galveston County · 357,330 people
- City population
- 49,936
- Metro
- Houston-The Woodlands-Sugar Land, TX
- Population (ZIP)
- 31,642
- Household income
- $65,801
- Rent vs Own
- Severe rent burden
- 1821.0
Population outlook (Galveston County) Hauer SSP2
- Today (2025)
- 390,640 people
- By 2030
- 425,226 · +8.9%
- By 2040
- 493,765 · +26.4%
- By 2050
- 559,698 · +43.3%
- By 2075
- 719,260 · +84.1%
- By 2100
- 819,628 · +109.8%
Race, ethnicity, and origin ACS 2023
- Neighborhood character
- Diverse neighborhood (Simpson 0.66)
- Race & ethnicity
- White 41% Hispanic / Latino 38% Two or more races 20% Black 17% Asian 2%
- Hispanic origin (detail)
- Mexican 33% Puerto Rican 1%
- Common ancestry
- Lithuanian 2% Slovak 1% Italian 1%
- Foreign-born
- 9% · Canada, Vietnam
- Languages at home
- 72% English-only · Spanish 26% Other Indo-European 1%
Political lean MEDSL · Galveston
- 2024 margin
- Strong R (+27.4) · D 35.7% · R 63.1% · Other 1.2%
- 2008→2024 swing
- -7.9pp toward R · 2008: -19.5pp · 2024: -27.4pp
- All cycles
- 2024: R+27.4 2020: R+22.6 2016: R+22.6 2012: R+26.9 2008: R+19.5
Not yet ingested
- Civics
- —
Market trends
- HPI YoY
- ▼ -58.35%
- Current HPI
- 244.5809
- Rent YoY
- ▲ 4.91%
- Metro
- Houston-The Woodlands-Sugar Land, TX
- State GDP YoY
- ▲ 3.95%
- F500 in state
- 110
Industry mix (Fortune 500 HQ in TX)
| Industry | F500 HQs | Revenue |
|---|---|---|
| Energy | 16 | $1,198B |
|
||
| Technology | 5 | $198B |
|
||
| Engineering / Construction | 4 | $72B |
|
||
| Energy Services | 3 | $60B |
|
||
| Utilities | 3 | $41B |
|
||
| Healthcare | 2 | $330B |
|
||
Price history
+433.0% since first listed10 events — show timeline
- 2026-06-10 Listed $159,900 HARMLS
- 2022-11-15 Sold (Public Records) — Public Records
- 2016-11-21 Sold (Public Records) — Public Records
- 2016-08-18 Sold (MLS) — HARMLS
- 2016-07-22 Pending — HARMLS
- 2016-03-24 Listed $69,999 HARMLS
- 2009-06-27 Listing Removed — HARMLS
- 2009-02-17 Listed $59,000 HARMLS
- 2005-02-16 Sold (Public Records) $30,000 Public Records
- 2005-02-16 Sold (Public Records) — Public Records
Property tax history
+5.7%/yrLatest (2025): $2,623 · +21.8% YoY. Source: county tax records.
Cash-flow waterfall
monthlySold comps — $/sqft
last 12 mo · ≤1 miLoading sold comps…