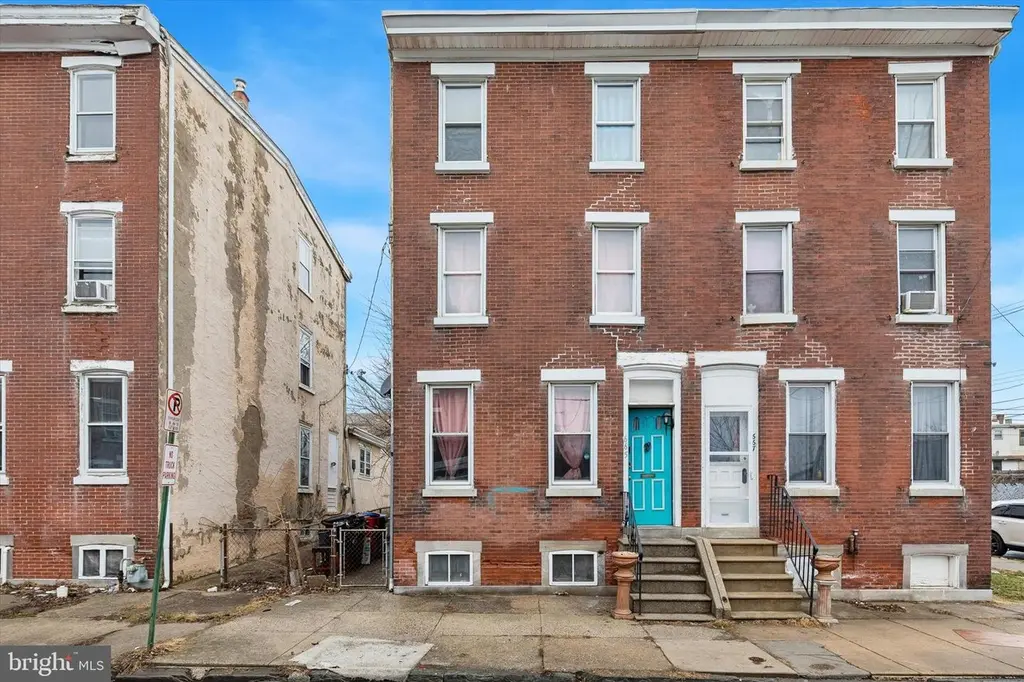
665 Corson St · Norristown, PA
Flood risk 1/10 · Minimal
- FEMA flood zone
- X (unshaded)
- Chance of flooding over 30 yrs
- 0.0%
- Est. flood insurance / yr
- $473 – $860
Fire risk 1/10 · Minimal
- Est. fire insurance / yr
- $511 – $949
Heat risk 7/10 · Major
- Hot days now (above 102°F)
- 7 days/yr
- Hot days in 30 yrs
- 15 days/yr
Wind risk 6/10 · Moderate
- Chance of severe wind over 30 yrs
- 27.0%
Air-quality risk 4/10 · Minor
- Unhealthy air days now
- 5 days/yr
- Unhealthy air days in 30 yrs
- 8 days/yr
Risk factors via First Street. Map © Google.
Why this score? — see what drove the C+ grade
The composite is a weighted blend of 9 inputs, each scored 0–100. Each bar is that input's sub-score; the figure is the points it added to the 100-point composite (weight × sub-score).
- Cash flow +25.7/30.0
- ARV discount +12.1/15.0
- DSCR +8.6/10.0
- 1% rule +6.9/10.0
- Livability +4.2/5.0
- Rent growth +2.8/5.0
- Condition / age +2.5/5.0
- Schools +2.2/10.0
- Appreciation +0.0/10.0
$195,000
🖨 Deal sheet 📄 Offer letter ✓ Due diligence
Listing remarks
Attention investors and first-time buyers! Don’t miss this excellent opportunity to own a spacious twin brick home in the rapidly growing Norristown market. This 4-bedroom property with convenient side access offers great potential for both owner-occupants and investors alike. Inside, you’ll find wood flooring, a large and bright combined living and dining area, and a functional eat-in kitchen with a rear mudroom—providing flexible space ready for your vision or continued rental use. Key features include updated electrical, replacement windows, a fenced rear yard, off-street parking, and a detached 2-car garage with electric—an exceptional bonus for added value and t
Key facts
- Garage
- Built 1890
- Listed 34 days
Neighborhood map
What this means for you Summary
Snapshot
- This is a 4-bed/1.5-bath single-family listed at $195k.
Deal economics
- At list price, monthly cash flow is $467 ($6k/yr) — positive.
- The deal already cash-flows at list — no discount required.
- Meets the 1% rule at list price ($2k rent vs $195k).
- Recommended offer: $189k (3.0% below list) — sets the bar for market timing.
- Cap rate 9.2% vs local median 4.5% in Norristown — top-decile yield for the area; either an underpriced asset or a hidden risk that comps aren't pricing in. Stress-test before assuming the spread holds.
Location & tenants
- Location reads 84/100 on livability (#100 in PA, #720 nationally) — a professional / high-income tenant draw. Strengths: amenities A+, commute A+, cost of living A+; Watch: crime D-.
- Norristown Area SD (suburban): math 18% / reading 31% proficiency, ranked #466 of 539 in PA (top 86%) — low school quality limits family demand, transient renter base, plan for 1-2y turnover; 70% free/reduced lunch — lower-income household profile, screen leases tightly.
- Zoned schools: Norristown Area Hs (math 42% / reading 8%, grade F, #375 of 437 statewide, top 86%, 2,309 students, 83% FRL).
- Market conditions: Rents rising (+1.3%/yr); 164 active listings in the ZIP; 20 comparable units currently listed for rent nearby; rentals at typical pace (median 24d on market — plan ~3-4 weeks tenant-placement turnaround); 40% of comp listings sitting > 30 days — soft ceiling on asking rent; 1,936 units permitted in Montgomery County in 2024 (530 in 5+ unit buildings).
- This rent runs 40% of the median local income ($70k/yr) — at the standard rent-burdened threshold; future hikes will face affordability resistance.
Forward outlook
- Local home prices are declining (-3.0%/yr); year-one equity from $1k of loan paydown is wiped out by about $6k of value loss. Plan a longer hold.
- Montgomery County population projected at +5% by 2050 — modest demand growth; plan on rents tracking national, not racing it.
Negotiation context
- It's been on market 34 days — a 3% lower offer ($189k) is reasonable based on typical stale-listing flexibility.
- 2 sale attempts since 10y ago with the ask held roughly flat each time — persistent listings suggest the price (not the market) is what's stuck; bring a comps-based counter.
- Current owner paid $75k; list at $195k implies a 160% gain — meaningful room to come down on a strong offer.
Risks & watch-outs
- Watch-outs: built in 1890 — expect roof / HVAC / electrical / plumbing capex.
- Climate carrying-cost: major wind risk, 27% chance of damaging wind over 30y; extreme-heat days projected 7→15/yr by 2055 (HVAC capex compounding) — expect insurance premiums to compound above CPI over the hold.
Questions for the listing agent
- It's been on market 34 days. Have you received any prior offers? Is the seller open to a 3% concession, seller financing, or rate buy-down credit?
- Built in 1890 — when were the roof, HVAC, electrical panel, plumbing, and water heater last replaced?
- Is there a deadline driving the sale (1031 exchange, divorce, estate, relocation)? That informs how much negotiation room exists.
- Crime grade is D in this area — have there been break-ins, vandalism, or insurance claims at this property in the last 3 years? What carrier currently insures it and at what premium?
- What's the average days-on-market for RENTAL listings here right now (not sales)? A rising rental-DOM trend means longer vacancies and softer asking-rent achievability than the comps imply.
- What's the recent tenant-quality profile in this submarket — average credit score on applications, eviction rate, late-payment / NSF rate, and stable-employment percentage? A property-management company in the area should have these aggregated.
- How much new for-sale + rental construction is in the pipeline within 1–3 miles? Heavy new supply typically softens prices + rents 12–24 months out; constrained supply supports both.
Investment metrics
- 1% rule
- 1.19% ✓
- Cap rate
- 9.16%
- Cash-on-cash
- 10.26%
- DSCR
- 1.46
- GRM
- 7.0
CMA / ARV
- ARV (on-the-fly)
- $217,120
- Comps found
- 9
Show comp detail 9 sales within ~0.75 mi
| Address | Dist | Beds/Ba | Sqft | Sold | Price | $/sf | Match |
|---|---|---|---|---|---|---|---|
| 620 George St | 0.15mi | 4/1.5 | 2,032 (+8%) | 3mo | $275,000 | $135 | 78 |
| 634 Kohn St | 0.20mi | 5/1.5 (+1) | 1,920 (+2%) | 17mo | $165,000 | $86 | 69 |
| 1000 Cherry St | 0.25mi | 5/2.0 (+1) | 1,943 (+3%) | 12mo | $89,000 | $46 | 66 |
| 732 Stanbridge St | 0.35mi | 4/1.0 | 2,011 (+6%) | 11mo | $190,000 | $94 | 62 |
| 118 W Fornance St | 0.60mi | 3/1.5 (-1) | 1,874 (-1%) | 19mo | $350,000 | $187 | 50 |
| 318 E Marshall St | 0.62mi | 4/2.0 | 2,040 (+8%) | 8mo | $235,000 | $115 | 49 |
| 315 E Poplar St | 0.72mi | 4/1.0 | 1,856 (-2%) | 20mo | $100,000 | $54 | 45 |
| 404 W Fornance St Unit 2 | 0.60mi | 4/2.0 | 1,610 (-15%) | 23mo | $375,000 | $233 | 26 |
| 1415 Markley St | 0.65mi | 3/1.5 (-1) | 1,610 (-15%) | 18mo | $319,900 | $199 | 25 |
Match score weights: distance 35% · size 25% · config 20% · recency 20%. Top-matched comps best support the ARV.
Projected returns pro-forma
-3.0% appreciation · 1.29% rent growth · sell at horizon
- IRR
- -2.9%
- Equity multiple
- 0.89×
- Total profit
- $-5,759
- Equity at exit
- $29,075
- IRR
- 4.8%
- Equity multiple
- 1.33×
- Total profit
- $17,870
- Equity at exit
- $16,860
Cash invested: $54,600 (down + closing). Projections, not guarantees.
Landlord ↔ Tenant lean methodology
- Overall (STATE)
- 62 Landlord-Friendly
- State Pennsylvania
- 62 Landlord-Friendly · EVEN
- County
- — inherits STATE
- City
- — inherits STATE
ZIP-level market 19401
- Rents YoY
- 1.3%
- Active inventory
- 164
- Price-to-rent
- 7.0×
Monthly cashflow live
- Estimated rent
- $2,323 high interval (Pro) →
- Mortgage (P&I)
- −$1,023
- Tax from tax record
- −$264 /mo · $3,173/yr
- Insurance
- −$81
- HOA
- −$0
- Vacancy / Maint / Mgmt
- −$488
- Net cashflow
- $467
Break-even live
UW: 25.0% down · 7.5% · 30yr · 1.5% tax · 5.0% vac · 8.0% maint · 8.0% mgmt
Financing live
Cash to close
- Down payment
- $48,750
- Closing costs
- $5,850
- Reserves months
- —
- Total cash needed
- —
Loan-product check · same deal, 3 products live
Conventional
25% down · 7.5% · 30yr
- Down + closing
- —
- Monthly P&I
- —
- Monthly cashflow
- —
- DSCR
- —
- Eligible?
- —
Personal DTI + credit; lowest rate.
DSCR
20% down · 8.5% · 30yr
- Down + closing
- —
- Monthly P&I
- —
- Monthly cashflow
- —
- DSCR
- —
- Eligible?
- —
No personal income docs; deal must DSCR.
Hard money
10% down · 12.0% · 12mo
- Down + closing
- —
- Monthly P&I
- —
- Monthly cashflow
- —
- DSCR
- —
- Eligible?
- —
Short-term bridge; refi at stabilization.
Rent comps 20 comps
| Address | Beds | Baths | Sqft | Rent | $/sqft | DOM | Units | Dist |
|---|---|---|---|---|---|---|---|---|
| 712 George St Unit 2 Norristown, PA | 4.0 | 1.0 | 1485 | $2,500 | $1.68 | 43d | 1 | 0.13mi |
| 126 W Elm St Norristown, PA | 4.0 | 1.5 | 1500 | $2,000 | $1.33 | 15d | 1 | 0.18mi |
| 540 George St Norristown, PA | 5.0 | 2.0 | 2054 | $2,595 | $1.26 | 24d | 1 | 0.25mi |
| 542 Stanbridge St #1 Norristown, PA | 3.0 | 1.0 | 1400 | $2,200 | $1.57 | 24d | 1 | 0.41mi |
| 206 Chain St Norristown, PA | 3.0 | 1.0 | 1440 | $2,200 | $1.53 | 43d | 1 | 0.41mi |
| 119 Pearl St Norristown, PA | 3.0 | 2.0 | 1428 | $1,750 | $1.23 | 18d | 1 | 0.44mi |
| 119 Pearl St Unit 1 Norristown, PA | 3.0 | 1.5 | 1428 | $1,750 | $1.23 | 18d | 1 | 0.44mi |
| 534 Green St Norristown, PA | 4.0 | 1.0 | 1612 | $1,800 | $1.12 | 21d | 1 | 0.50mi |
| 217 E Marshall St Norristown, PA | 5.0 | 1.5 | 2142 | $2,450 | $1.14 | 4d | 1 | 0.50mi |
| 533 Buttonwood St Norristown, PA | 5.0 | 2.0 | 1888 | $2,300 | $1.22 | 15d | 1 | 0.58mi |
| 502 Buttonwood St Norristown, PA | 3.0 | 1.0 | 1330 | $2,100 | $1.58 | 24d | 1 | 0.58mi |
| 221 E Wood St Norristown, PA | 4.0 | 1.0 | 1527 | $2,277 | $1.49 | 43d | 1 | 0.64mi |
| 211 E Poplar St Norristown, PA | 3.0 | 1.5 | 1414 | $2,350 | $1.66 | 43d | 1 | 0.67mi |
| 613 Walnut St Norristown, PA | 3.0 | 1.0 | 1526 | $1,925 | $1.26 | 5d | 1 | 0.72mi |
| 716 E Marshall St Apt 2 Norristown, PA | 3.0 | 1.0 | 1920 | $1,875 | $0.98 | 43d | 1 | 1.04mi |
| 1809 Chain St Norristown, PA | 4.0 | 2.0 | 1344 | $2,800 | $2.08 | 43d | 1 | 1.11mi |
| 106 W 5th St Bridgeport, PA | 4.0 | 1.5 | 1662 | $2,850 | $1.71 | 24d | 1 | 1.15mi |
| 344 Grove St Bridgeport, PA | 4.0 | 2.0 | 1484 | $2,895 | $1.95 | 43d | 1 | 1.27mi |
| 310 Prospect Ave Bridgeport, PA | 4.0 | 2.5 | 1920 | $3,100 | $1.61 | 43d | 1 | 1.33mi |
| 436 Coates St Bridgeport, PA | 3.0 | 2.5 | 1768 | $2,500 | $1.41 | 18d | 1 | 1.47mi |
Listing history 7 events
-
2026-04-29status Pending
-
2026-04-27historical
-
2026-03-25$195,000 Active
-
2026-03-24historical $195,000
-
2017-01-10historical
-
2016-09-13$89,000
-
2009-07-14soldstatus $75,000
ⓘ Source: listings_history table (triggers on properties + properties_extension) + one-shot
backfill from property_details.listing_events for pre-trigger history.
Tax reassessment forecast PA · Partial reset (capped growth)
- Current annual tax
- $3,173 · $264/mo
- Projected year-2 tax
- $3,173 · $264/mo
- Expected delta
- $0/yr ($0/mo · 0.0%)
ⓘ Screening estimate from a state-policy table — verify with the county assessor before closing.
Climate risk First Street
- Flood 1/10 Low FEMA zone X (unshaded) · 0% chance over 30 yrs
- Wildfire 1/10 Low
- Heat 7/10 Severe 7 d/yr ≥102°F today · 15 d/yr by 30 yrs out
- Wind 6/10 Major 27% chance of damaging wind over 30 yrs
- Air quality 4/10 Moderate 5 unhealthy d/yr today · 8 by 30 yrs out
Nearby sold comps map
Loading sold comps map…
Walkable amenities ~0.75 mi
Loading nearby amenities…
Taxation est. · year 1
- Rental income
- $27,872
- − Mortgage interest
- −$10,923
- − Property taxes
- −$3,173
- − Insurance
- −$975
- − Repairs & maintenance
- −$2,230
- − Management
- −$2,230
- − Depreciation
- −$5,673
- Taxable income
- $2,669
- Est. tax owed @ 24.0%
- −$641
- After-tax cash flow
- $4,959/yr
For passive investors: Depreciation is non-cash, so a rental often shows a tax loss while cash-flowing — sheltering income. Rental losses are passive: they offset passive income freely, and up to $25,000/yr can offset ordinary (W-2) income if you actively participate and your MAGI is under $100k (phasing out to $0 by $150k); unused losses carry forward. On sale, claimed depreciation is recaptured at up to 25%, and gains may owe capital-gains tax (a 1031 exchange can defer both). Figures are a year-1 estimate at your 24.0% rate — not tax advice; consult a CPA.
Schools (NCES district)
- District
- Norristown Area SD
- NCES district ID
- 4216980
- Math proficiency
- 18% ▼ -11.00%
- Reading proficiency
- 31% ▼ -14.00%
- Median HH income
- $56,024
- Composite
- 22.17/100
- National rank
- #8166
- State rank
- #466 of 539 in PA
Livability — Norristown
- Score
- 84/100
- State rank
- #100
- US rank
- #720
Category grades
Schools grade is shown separately in the Schools card above.
Census & demographics
- Census place
- Norristown, PA
- County
- Montgomery County · 712,331 people
- City population
- 87,376
- Metro
- Philadelphia-Camden-Wilmington, PA-NJ-DE-MD
- Population (ZIP)
- 43,359
- Household income
- $69,908
- Rent vs Own
- Severe rent burden
- 2725.0
Population outlook (Montgomery County) Hauer SSP2
- Today (2025)
- 856,074 people
- By 2030
- 870,887 · +1.7%
- By 2040
- 891,195 · +4.1%
- By 2050
- 896,417 · +4.7%
- By 2075
- 903,212 · +5.5%
- By 2100
- 843,240 · -1.5%
Race, ethnicity, and origin ACS 2023
- Neighborhood character
- Highly diverse neighborhood (Simpson 0.72)
- Race & ethnicity
- White 33% Black 29% Hispanic / Latino 29% Two or more races 16% Asian 3% Native American 2%
- Hispanic origin (detail)
- Mexican 16% Puerto Rican 5% Dominican 2%
- Common ancestry
- Romanian 3% Slovak 1%
- Foreign-born
- 17% · Canada, Jamaica, South Korea
- Languages at home
- 71% English-only · Spanish 22% Other Indo-European 2% Russian/Polish/Slavic 1%
Political lean MEDSL · Montgomery
- 2024 margin
- Strong D (+22.8) · D 60.9% · R 38.1% · Other 1.1%
- 2008→2024 swing
- +2.0pp toward D · 2008: 20.8pp · 2024: 22.8pp
- All cycles
- 2024: D+22.8 2020: D+26.3 2016: D+21.1 2012: D+14.3 2008: D+20.8
Not yet ingested
- Civics
- —
Market trends
- HPI YoY
- ▼ -203.75%
- Current HPI
- 301.7748
- Rent YoY
- ▲ 1.29%
- Metro
- Philadelphia-Camden-Wilmington, PA-NJ-DE-MD
- State GDP YoY
- ▲ 1.68%
- F500 in state
- 34
Industry mix (Fortune 500 HQ in PA)
| Industry | F500 HQs | Revenue |
|---|---|---|
| Healthcare | 2 | $309B |
|
||
| Insurance | 2 | $27B |
|
||
| Telecommunications / Media | 1 | $124B |
|
||
| Industrial Distribution | 1 | $22B |
|
||
| Financial Services | 1 | $20B |
|
||
| Chemicals / Materials | 1 | $18B |
|
||
Price history
+160.0% since first listed7 events — show timeline
- 2026-04-29 Pending — BRIGHT MLS
- 2026-04-27 Listing Removed — BRIGHT MLS
- 2026-03-25 Listed $195,000 BRIGHT MLS
- 2026-03-24 Coming Soon $195,000 BRIGHT MLS
- 2017-01-10 Listing Removed — BRIGHT MLS
- 2016-09-13 Listed $89,000 BRIGHT MLS
- 2009-07-14 Sold (Public Records) $75,000 Public Records
Property tax history
+2.6%/yrLatest (2026): $3,173 · +2.3% YoY. Source: county tax records.
Cash-flow waterfall
monthlySold comps — $/sqft
last 12 mo · ≤1 miLoading sold comps…