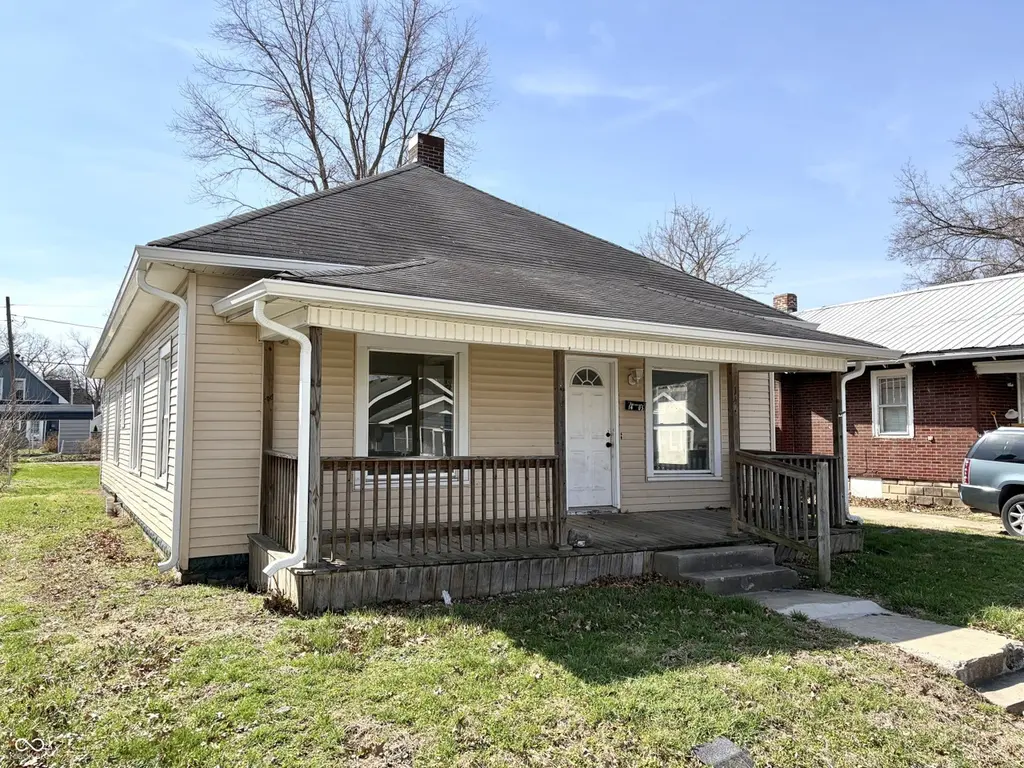
1405 W 4th St · Anderson, IN
Flood risk 4/10 · Minor
- FEMA flood zone
- X (unshaded)
- Chance of flooding over 30 yrs
- 0.24%
- Est. flood insurance / yr
- $473 – $860
Fire risk 1/10 · Minimal
- Est. fire insurance / yr
- $717 – $1,331
Heat risk 3/10 · Minor
- Hot days now (above 100°F)
- 7 days/yr
- Hot days in 30 yrs
- 18 days/yr
Wind risk 2/10 · Minimal
- Chance of severe wind over 30 yrs
- —
Air-quality risk 3/10 · Minor
- Unhealthy air days now
- 2 days/yr
- Unhealthy air days in 30 yrs
- 3 days/yr
Risk factors via First Street. Map © Google.
Why this score? — see what drove the B- grade
The composite is a weighted blend of 9 inputs, each scored 0–100. Each bar is that input's sub-score; the figure is the points it added to the 100-point composite (weight × sub-score).
- Cash flow +30.0/30.0
- DSCR +10.0/10.0
- 1% rule +8.7/10.0
- ARV discount +7.7/15.0
- Rent growth +4.5/5.0
- Livability +3.0/5.0
- Condition / age +2.5/5.0
- Schools +1.6/10.0
- Appreciation +0.0/10.0
$100,000
🖨 Deal sheet (PDF) 📄 Offer letter ✓ Due diligence
Listing remarks MLS
Investor Special! With a clean slate featuring 3 bedrooms, 1 bathroom, a large kitchen and lots of natural light, this is an opportunity waiting for your TLC. Additional storage in the back with a clean over-sized two car garage. Bring your handyman, or tool belt to make this place your home or addition to your investment portfolio.
Key facts
- 6,336 sq ft lot
- 2 garage spots
- Built 1910
Neighborhood map
What this means for you Summary
Snapshot
- This is a 5-bed/1.0-bath single-family listed at $100k.
Deal economics
- At list price, monthly cash flow is $420 ($5k/yr) — positive.
- The deal already cash-flows at list — no discount required.
- Meets the 1% rule at list price ($1k rent vs $100k).
- Recommended offer: $94k (6.0% below list) — sets the bar for market timing.
- Cap rate 11.3% vs local median 6.1% in Anderson — top-decile yield for the area; either an underpriced asset or a hidden risk that comps aren't pricing in. Stress-test before assuming the spread holds.
Location & tenants
- Location reads 60/100 on livability (#521 in IN) — a middle-class / working-renter tenant base. Strengths: cost of living A+, housing A+; Watch: crime D-, amenities F, commute F.
- Anderson Community School Corporation (urban): math 15% / reading 23% proficiency, ranked #280 of 301 in IN (top 93%) — low school quality limits family demand, transient renter base, plan for 1-2y turnover; 70% free/reduced lunch — lower-income household profile, screen leases tightly.
- Zoned schools: Eastside Elementary School (math 34% / reading 36%, grade F, #590 of 994 statewide, top 60%, 511 students, 77% FRL); Highland Middle School (math 9% / reading 22%, grade F, #293 of 330 statewide, top 90%, 914 students, 81% FRL); Anderson High School (math 21% / reading 51%, grade F, #261 of 369 statewide, top 71%, 1,790 students, 76% FRL).
- Market conditions: Rents rising fast (+7.9%/yr); 188 active listings in the ZIP; 3 comparable units currently listed for rent nearby; rentals at typical pace (median 18d on market — plan ~3-4 weeks tenant-placement turnaround); lower-income renter base — watch delinquency; 184 units permitted in Madison County in 2024 (0 in 5+ unit buildings).
- At $1,367/mo this rent would consume 46% of the median local household income ($36k/yr) (locally 1193% of renters already pay >50% of income on rent) — very limited rent-growth headroom before tenants either downsize or default.
Forward outlook
- Local home prices are declining (-3.0%/yr); year-one equity from $691 of loan paydown is wiped out by about $3k of value loss. Plan a longer hold.
- Madison County population projected at -14% by 2050 — secular population decline; favor cash flow + early exit over multi-decade hold.
- At projected returns (-3.0% appreciation + 7.9% rent growth), your $28k cash investment doubles in ~6 years — after that, you're playing with house money.
Negotiation context
- It's been on market 85 days — a 6% lower offer ($94k) is reasonable based on typical stale-listing flexibility.
- 5 sale attempts since 24y ago; this cycle's ask has dropped $21k (17%) from the opening price — seller is motivated, your offer sets the floor, not the list.
- Current owner paid $53k; list at $100k implies a 89% gain — meaningful room to come down on a strong offer.
Risks & watch-outs
- Watch-outs: built in 1910 — expect roof / HVAC / electrical / plumbing capex.
Questions for the listing agent
- It's been on market 85 days. Have you received any prior offers? Is the seller open to a 6% concession, seller financing, or rate buy-down credit?
- Built in 1910 — when were the roof, HVAC, electrical panel, plumbing, and water heater last replaced?
- Why hasn't it sold? Are there any deal-killer items the seller is aware of (foundation, flood, title, zoning, code violations)?
- Is there a deadline driving the sale (1031 exchange, divorce, estate, relocation)? That informs how much negotiation room exists.
- Schools are F-rated, which usually means shorter tenancies and higher turnover. Who's the typical renter profile here, and what's been the actual vacancy rate?
- Crime grade is D in this area — have there been break-ins, vandalism, or insurance claims at this property in the last 3 years? What carrier currently insures it and at what premium?
- What's the average days-on-market for RENTAL listings here right now (not sales)? A rising rental-DOM trend means longer vacancies and softer asking-rent achievability than the comps imply.
- What's the recent tenant-quality profile in this submarket — average credit score on applications, eviction rate, late-payment / NSF rate, and stable-employment percentage? A property-management company in the area should have these aggregated.
- How much new for-sale + rental construction is in the pipeline within 1–3 miles? Heavy new supply typically softens prices + rents 12–24 months out; constrained supply supports both.
Investment metrics
- 1% rule
- 1.37% ✓
- Cap rate
- 11.33%
- Cash-on-cash
- 18.00%
- DSCR
- 1.80
- GRM
- 6.1
CMA / ARV
- ARV (median comp)
- $100,439
- List price
- $100,000
- Delta
- -0.44%
- Verdict
- FAIR
- Comps
- 20 within 1.0 mi
Show comp detail 1 sale within ~0.75 mi
| Address | Dist | Beds/Ba | Sqft | Sold | Price | $/sf | Match |
|---|---|---|---|---|---|---|---|
| 424 W 3rd St | 0.60mi | 4/1.0 (-1) | 1,574 (+4%) | 6mo | $50,000 | $32 | 56 |
Match score weights: distance 35% · size 25% · config 20% · recency 20%. Top-matched comps best support the ARV.
Projected returns pro-forma
-3.0% appreciation · 7.88% rent growth · sell at horizon
- IRR
- 14.8%
- Equity multiple
- 1.63×
- Total profit
- $17,592
- Equity at exit
- $14,910
- IRR
- 26.9%
- Equity multiple
- 3.92×
- Total profit
- $81,746
- Equity at exit
- $8,646
Cash invested: $28,000 (down + closing). Projections, not guarantees.
Landlord ↔ Tenant lean methodology
- Overall (STATE)
- 90 Strongly Landlord-Friendly
- State Indiana
- 90 Strongly Landlord-Friendly · R+11
- County
- — inherits STATE
- City
- — inherits STATE
ZIP-level market 46016
- Home prices YoY
- -3.5%
- Rents YoY
- 7.9%
- Active inventory
- 188
- Price-to-rent
- 6.1×
Monthly cashflow live
- Estimated rent
- $1,367 medium interval (Pro) →
- Mortgage (P&I)
- −$524
- Tax from tax record
- −$94 /mo · $1,127/yr
- Insurance
- −$42
- HOA
- −$0
- Vacancy / Maint / Mgmt
- −$287
- Net cashflow
- $420
Break-even live
Sensitivity live
| Price | -10% $477 | -5% $448 | +0% $420 | +5% $392 | +10% $363 |
|---|---|---|---|---|---|
| Rent | -10% $312 | -5% $366 | +0% $420 | +5% $474 | +10% $528 |
| Rate | -1.0pp $470 | -0.5pp $445 | base $420 | +0.5pp $394 | +1.0pp $368 |
UW: 25.0% down · 7.5% · 30yr · 1.5% tax · 5.0% vac · 8.0% maint · 8.0% mgmt
Financing live
Cash to close
- Down payment
- $25,000
- Closing costs
- $3,000
- Reserves months
- —
- Total cash needed
- —
Loan-product check · same deal, 3 products live
Conventional
25% down · 7.5% · 30yr
- Down + closing
- —
- Monthly P&I
- —
- Monthly cashflow
- —
- DSCR
- —
- Eligible?
- —
Personal DTI + credit; lowest rate.
DSCR
20% down · 8.5% · 30yr
- Down + closing
- —
- Monthly P&I
- —
- Monthly cashflow
- —
- DSCR
- —
- Eligible?
- —
No personal income docs; deal must DSCR.
Hard money
10% down · 12.0% · 12mo
- Down + closing
- —
- Monthly P&I
- —
- Monthly cashflow
- —
- DSCR
- —
- Eligible?
- —
Short-term bridge; refi at stabilization.
Rent comps 3 comps
| Address | Beds | Baths | Sqft | Rent | $/sqft | DOM | Units | Dist |
|---|---|---|---|---|---|---|---|---|
| 621 S Madison Ave Anderson, IN | 6.0 | 2.0 | 1961 | $1,375 | $0.70 | 18d | 1 | 0.32mi |
| 1222 Nichol Ave Unit 1 Anderson, IN | 5.0 | 1.0 | 1350 | $1,195 | $0.89 | 18d | 1 | 0.55mi |
| 1222 Nichol Ave Unit 1 Anderson, IN | 5.0 | 1.0 | 1350 | $1,195 | $0.89 | 0d | 1 | 0.55mi |
Listing history 26 events
-
2026-06-21days on market $100,000 Active 85 DOM
-
2026-06-18days on market $100,000 Active 82 DOM
-
2026-06-17days on market $100,000 Active 81 DOM
-
2026-06-16days on market $100,000 Active 80 DOM
-
2026-06-15days on market $100,000 Active 79 DOM
-
2026-06-13pricedays on market $100,000 Active 77 DOM
-
2026-06-09days on market $112,500 Active 73 DOM
-
2026-06-08days on market $112,500 Active 72 DOM
-
2026-06-07days on market $112,500 Active 71 DOM
-
2026-06-05days on market $112,500 Active 68 DOM
-
2026-06-03days on market $112,500 Active 67 DOM
-
2026-06-02days on market $112,500 Active 66 DOM
-
2026-06-01days on market $112,500 Active 65 DOM
-
2026-05-31days on market $112,500 Active 64 DOM
-
2026-04-29price $115,000 334-char remark
Show marketing remark (334 chars)
Investor Special! With a clean slate featuring 3 bedrooms, 1 bathroom, a large kitchen and lots of natural light, this is an opportunity waiting for your TLC. Additional storage in the back with a clean over-sized two car garage. Bring your handyman, or tool belt to make this place your home or addition to your investment portfolio.
-
2026-03-27$121,000 Active 334-char remark
Show marketing remark (334 chars)
Investor Special! With a clean slate featuring 3 bedrooms, 1 bathroom, a large kitchen and lots of natural light, this is an opportunity waiting for your TLC. Additional storage in the back with a clean over-sized two car garage. Bring your handyman, or tool belt to make this place your home or addition to your investment portfolio.
-
2024-04-24soldstatus $53,000 Closed 1483-char remark
Show marketing remark (1483 chars)
Action Required: No Wholesaler offers will be considered. Proof of funds and all contracts must be in the name of the end user. All showings require proof of funds, no exceptions. Financing Type: Cash, Conventional Financing Keep it as a rental and raise rents to fair market value (Shortage of Section 8 Housing in Anderson. See upside remarks below) Upside Potential: According to the 2024 HUD Fair Market Rents (FMRs) for the 46016 Zip Code, there is substantial room for rent increase, with the potential to raise total rent to $1,468. Property can be sold as a package deal. (See remarks below) Listing Broker has a spreadsheet with underwriting analysis on investment property, PDF copy of the underwriting on file. If represented by an outside agency, connect your representative. In order to receive financial information and data analysis buyers must register through the listing broker even if represented by an outside agency. Please note: Interior of property has not been examined due to tenant occupancy. All financial projections and data are based on available information and should be independently verified by the buyer. Once under contract, buyers may conduct physical inspection to verify the condition of property. Package: 2203-2205 George St (Duplex), 1405 W 4th St, 1202 Home Ave, 1124 Home Ave, 1304 E 27th St, 125 E 35th St, 2939 Columbus Ave. All investment properties can be bought as a package or individually. See MLS listings.
-
2024-03-02status Pending 1483-char remark
Show marketing remark (1483 chars)
Action Required: No Wholesaler offers will be considered. Proof of funds and all contracts must be in the name of the end user. All showings require proof of funds, no exceptions. Financing Type: Cash, Conventional Financing Keep it as a rental and raise rents to fair market value (Shortage of Section 8 Housing in Anderson. See upside remarks below) Upside Potential: According to the 2024 HUD Fair Market Rents (FMRs) for the 46016 Zip Code, there is substantial room for rent increase, with the potential to raise total rent to $1,468. Property can be sold as a package deal. (See remarks below) Listing Broker has a spreadsheet with underwriting analysis on investment property, PDF copy of the underwriting on file. If represented by an outside agency, connect your representative. In order to receive financial information and data analysis buyers must register through the listing broker even if represented by an outside agency. Please note: Interior of property has not been examined due to tenant occupancy. All financial projections and data are based on available information and should be independently verified by the buyer. Once under contract, buyers may conduct physical inspection to verify the condition of property. Package: 2203-2205 George St (Duplex), 1405 W 4th St, 1202 Home Ave, 1124 Home Ave, 1304 E 27th St, 125 E 35th St, 2939 Columbus Ave. All investment properties can be bought as a package or individually. See MLS listings.
-
2024-02-29price $55,000 1483-char remark
Show marketing remark (1483 chars)
Action Required: No Wholesaler offers will be considered. Proof of funds and all contracts must be in the name of the end user. All showings require proof of funds, no exceptions. Financing Type: Cash, Conventional Financing Keep it as a rental and raise rents to fair market value (Shortage of Section 8 Housing in Anderson. See upside remarks below) Upside Potential: According to the 2024 HUD Fair Market Rents (FMRs) for the 46016 Zip Code, there is substantial room for rent increase, with the potential to raise total rent to $1,468. Property can be sold as a package deal. (See remarks below) Listing Broker has a spreadsheet with underwriting analysis on investment property, PDF copy of the underwriting on file. If represented by an outside agency, connect your representative. In order to receive financial information and data analysis buyers must register through the listing broker even if represented by an outside agency. Please note: Interior of property has not been examined due to tenant occupancy. All financial projections and data are based on available information and should be independently verified by the buyer. Once under contract, buyers may conduct physical inspection to verify the condition of property. Package: 2203-2205 George St (Duplex), 1405 W 4th St, 1202 Home Ave, 1124 Home Ave, 1304 E 27th St, 125 E 35th St, 2939 Columbus Ave. All investment properties can be bought as a package or individually. See MLS listings.
-
2024-02-21$45,000 Active 1483-char remark
Show marketing remark (1483 chars)
Action Required: No Wholesaler offers will be considered. Proof of funds and all contracts must be in the name of the end user. All showings require proof of funds, no exceptions. Financing Type: Cash, Conventional Financing Keep it as a rental and raise rents to fair market value (Shortage of Section 8 Housing in Anderson. See upside remarks below) Upside Potential: According to the 2024 HUD Fair Market Rents (FMRs) for the 46016 Zip Code, there is substantial room for rent increase, with the potential to raise total rent to $1,468. Property can be sold as a package deal. (See remarks below) Listing Broker has a spreadsheet with underwriting analysis on investment property, PDF copy of the underwriting on file. If represented by an outside agency, connect your representative. In order to receive financial information and data analysis buyers must register through the listing broker even if represented by an outside agency. Please note: Interior of property has not been examined due to tenant occupancy. All financial projections and data are based on available information and should be independently verified by the buyer. Once under contract, buyers may conduct physical inspection to verify the condition of property. Package: 2203-2205 George St (Duplex), 1405 W 4th St, 1202 Home Ave, 1124 Home Ave, 1304 E 27th St, 125 E 35th St, 2939 Columbus Ave. All investment properties can be bought as a package or individually. See MLS listings.
-
2007-06-15historical
-
2007-03-19$54,900
-
2003-10-19historical
-
2003-05-22$29,900
-
2002-09-19soldstatus $24,000
-
2002-07-03$27,900
ⓘ Source: listings_history table (triggers on properties + properties_extension) + one-shot
backfill from property_details.listing_events for pre-trigger history.
Tax reassessment forecast IN · Partial reset (capped growth)
- Current annual tax
- $1,127 · $94/mo
- Projected year-2 tax
- $1,127 · $94/mo
- Expected delta
- $0/yr ($0/mo · 0.0%)
ⓘ Screening estimate from a state-policy table — verify with the county assessor before closing.
Climate risk First Street
- Flood 4/10 Moderate FEMA zone X (unshaded) · 24% chance over 30 yrs
- Wildfire 1/10 Low
- Heat 3/10 Moderate 7 d/yr ≥100°F today · 18 d/yr by 30 yrs out
- Wind 2/10 Low
- Air quality 3/10 Moderate 2 unhealthy d/yr today · 3 by 30 yrs out
Nearby sold comps map
Loading sold comps map…
Walkable amenities ~0.75 mi
Loading nearby amenities…
Taxation est. · year 1
- Rental income
- $16,405
- − Mortgage interest
- −$5,602
- − Property taxes
- −$1,127
- − Insurance
- −$500
- − Repairs & maintenance
- −$1,312
- − Management
- −$1,312
- − Depreciation
- −$2,909
- Taxable income
- $3,643
- Est. tax owed @ 24.0%
- −$874
- After-tax cash flow
- $4,166/yr
For passive investors: Depreciation is non-cash, so a rental often shows a tax loss while cash-flowing — sheltering income. Rental losses are passive: they offset passive income freely, and up to $25,000/yr can offset ordinary (W-2) income if you actively participate and your MAGI is under $100k (phasing out to $0 by $150k); unused losses carry forward. On sale, claimed depreciation is recaptured at up to 25%, and gains may owe capital-gains tax (a 1031 exchange can defer both). Figures are a year-1 estimate at your 24.0% rate — not tax advice; consult a CPA.
Schools (NCES district)
- District
- Anderson Community School Corporation
- NCES district ID
- 1800150
- Math proficiency
- 15% ▼ -14.00%
- Reading proficiency
- 23% ▼ -7.00%
- Median HH income
- $38,208
- Composite
- 15.93/100
- National rank
- #9250
- State rank
- #280 of 301 in IN
Livability — Anderson
- Score
- 60/100
- State rank
- #521
- US rank
- #18709
Category grades
Schools grade is shown separately in the Schools card above.
Census & demographics
- Census place
- Anderson, IN
- County
- Madison County · 69,445 people
- City population
- 57,762
- Metro
- Indianapolis-Carmel-Anderson, IN
- Population (ZIP)
- 17,834
- Household income
- $36,029
- Rent vs Own
- Severe rent burden
- 1193.0
Population outlook (Madison County) Hauer SSP2
- Today (2025)
- 125,800 people
- By 2030
- 122,640 · -2.5%
- By 2040
- 115,420 · -8.3%
- By 2050
- 108,148 · -14.0%
- By 2075
- 91,838 · -27.0%
- By 2100
- 75,670 · -39.8%
Race, ethnicity, and origin ACS 2023
- Neighborhood character
- Diverse neighborhood (Simpson 0.58)
- Race & ethnicity
- White 61% Black 18% Hispanic / Latino 13% Two or more races 11% Native American 1%
- Hispanic origin (detail)
- Mexican 10% Puerto Rican 1%
- Common ancestry
- Italian 2% Slovak 1% Iranian 1%
- Foreign-born
- 4% · Canada
- Languages at home
- 86% English-only · Spanish 12%
Political lean MEDSL · Madison
- 2024 margin
- Strong R (+26.9) · D 35.6% · R 62.5% · Other 1.9%
- 2008→2024 swing
- -33.5pp toward R · 2008: 6.5pp · 2024: -26.9pp
- All cycles
- 2024: R+26.9 2020: R+22.6 2016: R+25.7 2012: R+4.5 2008: D+6.5
Not yet ingested
- Civics
- —
Market trends
- HPI YoY
- ▼ -11.12%
- Current HPI
- 302.7437
- Rent YoY
- ▲ 7.88%
- Metro
- Indianapolis-Carmel-Anderson, IN
- State GDP YoY
- ▲ 2.90%
- F500 in state
- 18
Industry mix (Fortune 500 HQ in IN)
| Industry | F500 HQs | Revenue |
|---|---|---|
| Industrial Machinery | 2 | $37B |
|
||
| Healthcare | 1 | $177B |
|
||
| Pharmaceuticals | 1 | $45B |
|
||
| Metals / Steel | 1 | $18B |
|
||
| Agriculture | 1 | $17B |
|
||
| Packaging | 1 | $12B |
|
||
Price history
+312.2% since first listed12 events — show timeline
- 2026-04-29 Price Changed $115,000 MIBOR as Distributed by MLS Grid
- 2026-03-27 Listed $121,000 MIBOR as Distributed by MLS Grid
- 2024-04-24 Sold (MLS) $53,000 MIBOR as Distributed by MLS Grid
- 2024-03-02 Pending — MIBOR as Distributed by MLS Grid
- 2024-02-29 Price Changed $55,000 MIBOR as Distributed by MLS Grid
- 2024-02-21 Listed $45,000 MIBOR as Distributed by MLS Grid
- 2007-06-15 Listing Removed — MIBOR as Distributed by MLS Grid
- 2007-03-19 Listed $54,900 MIBOR as Distributed by MLS Grid
- 2003-10-19 Listing Removed — MIBOR as Distributed by MLS Grid
- 2003-05-22 Listed $29,900 MIBOR as Distributed by MLS Grid
- 2002-09-19 Sold (MLS) $24,000 MIBOR as Distributed by MLS Grid
- 2002-07-03 Listed $27,900 MIBOR as Distributed by MLS Grid
Property tax history
+7.6%/yrLatest (2024): $1,127 · +9.0% YoY. Source: county tax records.
Cash-flow waterfall
monthlySold comps — $/sqft
last 12 mo · ≤1 miLoading sold comps…