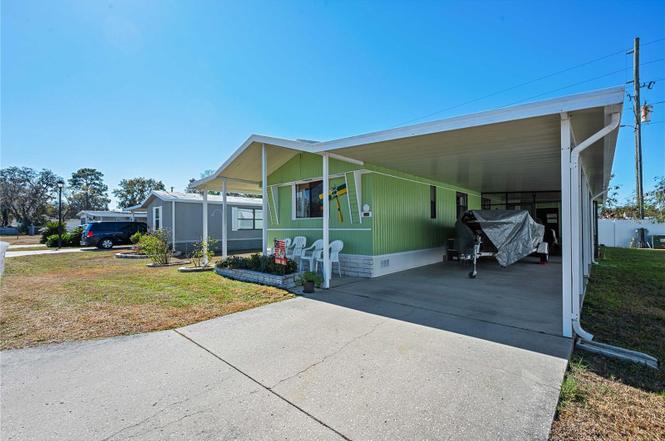
5305 Antigua Dr · Zephyrhills West, FL
Flood risk 1/10 · Minimal
- FEMA flood zone
- X (unshaded)
- Chance of flooding over 30 yrs
- 0.0%
- Est. flood insurance / yr
- $507 – $1,088
Fire risk 4/10 · Minor
- Est. fire insurance / yr
- $947 – $1,759
Heat risk 9/10 · Severe
- Hot days now (above 108°F)
- 7 days/yr
- Hot days in 30 yrs
- 24 days/yr
Wind risk 9/10 · Severe
- Chance of severe wind over 30 yrs
- 99.0%
Air-quality risk 2/10 · Minimal
- Unhealthy air days now
- 1 days/yr
- Unhealthy air days in 30 yrs
- 2 days/yr
Risk factors via First Street. Map © Google.
Why this score? — see what drove the B- grade
The composite is a weighted blend of 9 inputs, each scored 0–100. Each bar is that input's sub-score; the figure is the points it added to the 100-point composite (weight × sub-score).
- Cash flow +30.0/30.0
- 1% rule +10.0/10.0
- DSCR +10.0/10.0
- ARV discount +7.1/15.0
- Schools +4.3/10.0
- Livability +3.1/5.0
- Condition / age +2.5/5.0
- Rent growth +1.9/5.0
- Appreciation +0.0/10.0
$124,900
🖨 Deal sheet (PDF) 📄 Offer letter ✓ Due diligence
Listing remarks
New Price! Welcome to easy Florida living in the desirable Oaks Royal I & II, a friendly and active 55+ community designed for comfort, connection, and carefree days. This well-maintained 2-bedroom, 2-bath home offers a popular split-bedroom floor plan and an inviting open-concept layout that seamlessly connects the kitchen and living room—perfect for entertaining or relaxing at home. The bright eat-in kitchen features nicely updated cabinetry and counter-tops, providing plenty of space for casual meals and everyday living. Laminate flooring flows throughout the main living areas, while Berber carpet in both bedrooms adds warmth and comfort. Each bedroom includes ceiling fans an
Key facts
- Laminate flooring
- Berber carpet
- Updated cabinetry
Tags
Property features AI
Finance
- Other: Annual taxes reported; Association contact listed
- Financial info: Lease restrictions apply
- HOA & community: Has HOA with annual fee ($455) and monthly equivalent $37.92; membership and buyer approval required; Association amenities include clubhouse, pool, recreation facilities, shuffleboard court; Senior community; Deed restrictions; Street lights; Golf carts allowed; Pets allowed (dogs and cats; max pet weight ~40 lbs)
Exterior
- Parking: Covered driveway; 1-car carport
- Utilities: Public water; Public sewer; Electricity connected; Cable available; Broadband/High-speed internet available; Water and sewer connected
- Home design: Manufactured single-wide home; One story; Faces east; Residential property
- Construction: Metal siding; Metal roof; Crawlspace foundation; Built in approximately 1990s–2000s (manufactured home — year not specified)
- Exterior features: Enclosed screened side porch; Hurricane shutters; Level lot; Asphalt / paved public maintained road
Interior
- Kitchen: Microwave; Range; Range hood
- Bedrooms: 2 bedrooms
- Flooring: Carpet; Laminate
- Bathrooms: 2 full bathrooms
- Heating & cooling: Central heating (electric); Central air conditioning
- Interior features: Built-in features; Ceiling fans; Eat-in kitchen; Kitchen/family room combo
- Laundry & utility: Washer and dryer; Electric water heater; Laundry inside
Neighborhood map
What this means for you Summary
Snapshot
- This is a 3-bed/2.0-bath manufactured listed at $125k.
Deal economics
- At list price, monthly cash flow is $669 ($8k/yr) — positive.
- The deal already cash-flows at list — no discount required.
- Meets the 1% rule at list price ($2k rent vs $125k).
- Recommended offer: $110k (12.0% below list) — sets the bar for market timing.
- Cap rate 12.7% vs local median 7.8% in Zephyrhills West — top-decile yield for the area; either an underpriced asset or a hidden risk that comps aren't pricing in. Stress-test before assuming the spread holds.
Location & tenants
- Location reads 61/100 on livability (#772 in FL) — a middle-class / working-renter tenant base. Strengths: cost of living A+, housing A+; Watch: schools D-, amenities F, commute F.
- Pasco (suburban): math 50% / reading 52% proficiency, ranked #32 of 73 in FL (top 44%) — acceptable for families but not a draw, mixed tenant base, ~2y average lease.
- Market conditions: Rents soft (-2.5%/yr); 856 active listings in the ZIP; 9 comparable units currently listed for rent nearby; rentals at typical pace (median 25d on market — plan ~3-4 weeks tenant-placement turnaround); 6,765 units permitted in Pasco County in 2024 (1,250 in 5+ unit buildings).
- This rent runs 42% of the median local income ($57k/yr) — at the standard rent-burdened threshold; future hikes will face affordability resistance.
Forward outlook
- Local home prices are declining (-3.0%/yr); year-one equity from $864 of loan paydown is wiped out by about $4k of value loss. Plan a longer hold.
- Pasco County population projected at +29% by 2050 — long-run rental-demand tailwind backs the buy-and-hold thesis.
- At projected returns (-3.0% appreciation + 0.0% rent growth), your $35k cash investment doubles in ~7 years — after that, you're playing with house money.
Negotiation context
- It's been on market 135 days — a 12% lower offer ($110k) is reasonable based on typical stale-listing flexibility.
- 3 sale attempts with the ask held roughly flat each time — persistent listings suggest the price (not the market) is what's stuck; bring a comps-based counter.
- Current owner paid $25k; list at $125k implies a 400% gain — meaningful room to come down on a strong offer.
Risks & watch-outs
- Climate carrying-cost: severe wind risk, 99% chance of damaging wind over 30y; extreme-heat days projected 7→24/yr by 2055 (HVAC capex compounding) — expect insurance premiums to compound above CPI over the hold.
Questions for the listing agent
- It's been on market 135 days. Have you received any prior offers? Is the seller open to a 12% concession, seller financing, or rate buy-down credit?
- What does the HOA fee cover, when was the last increase, and are there any pending special assessments or reserve-fund shortfalls?
- Why hasn't it sold? Are there any deal-killer items the seller is aware of (foundation, flood, title, zoning, code violations)?
- Is there a deadline driving the sale (1031 exchange, divorce, estate, relocation)? That informs how much negotiation room exists.
- Schools are D-rated, which usually means shorter tenancies and higher turnover. Who's the typical renter profile here, and what's been the actual vacancy rate?
- What's the average days-on-market for RENTAL listings here right now (not sales)? A rising rental-DOM trend means longer vacancies and softer asking-rent achievability than the comps imply.
- What's the recent tenant-quality profile in this submarket — average credit score on applications, eviction rate, late-payment / NSF rate, and stable-employment percentage? A property-management company in the area should have these aggregated.
- How much new for-sale + rental construction is in the pipeline within 1–3 miles? Heavy new supply typically softens prices + rents 12–24 months out; constrained supply supports both.
Investment metrics
- 1% rule
- 1.58% ✓
- Cap rate
- 12.72%
- Cash-on-cash
- 22.95%
- DSCR
- 2.02
- GRM
- 5.3
CMA / ARV
- ARV (on-the-fly)
- $123,872
- Comps found
- 12
Show comp detail 12 sales within ~0.75 mi
| Address | Dist | Beds/Ba | Sqft | Sold | Price | $/sf | Match |
|---|---|---|---|---|---|---|---|
| 36122 Aster Ave | 0.15mi | 2/2.0 (-1) | 816 (+4%) | 8mo | $115,000 | $141 | 74 |
| 36413 Teakwood Ave | 0.27mi | 2/1.0 (-1) | 812 (+4%) | 4mo | $159,000 | $196 | 69 |
| 36029 Aster Ave | 0.24mi | 2/2.0 (-1) | 768 (-2%) | 13mo | $100,000 | $130 | 69 |
| 36312 Toranado Way | 0.23mi | 2/1.5 (-1) | 768 (-2%) | 12mo | $120,000 | $156 | 69 |
| 5302 Montego Dr | 0.06mi | 2/2.0 (-1) | 864 (+10%) | 14mo | $123,000 | $142 | 64 |
| 36416 Cordova Cir | 0.15mi | 2/1.0 (-1) | 672 (-14%) | 1mo | $60,000 | $89 | 59 |
| 36037 Coleus Ave | 0.21mi | 2/2.0 (-1) | 864 (+10%) | 11mo | $136,500 | $158 | 59 |
| 5313 Aurora Dr | 0.18mi | 2/1.5 (-1) | 672 (-14%) | 4mo | $66,000 | $98 | 58 |
| 35934 Bueno Dr | 0.63mi | 2/2.0 (-1) | 832 (+6%) | 6mo | $145,000 | $174 | 51 |
| 35921 Hermoso Ln | 0.55mi | 2/2.0 (-1) | 864 (+10%) | 5mo | $145,000 | $168 | 48 |
| 4912 Dorado St | 0.54mi | 2/2.0 (-1) | 888 (+13%) | 2mo | $144,000 | $162 | 46 |
| 36905 Kay Ave | 0.65mi | 2/2.0 (-1) | 864 (+10%) | 4mo | $148,500 | $172 | 44 |
Match score weights: distance 35% · size 25% · config 20% · recency 20%. Top-matched comps best support the ARV.
Projected returns pro-forma
-3.0% appreciation · 0.0% rent growth · sell at horizon
- IRR
- 12.4%
- Equity multiple
- 1.48×
- Total profit
- $16,627
- Equity at exit
- $18,623
- IRR
- 18.8%
- Equity multiple
- 2.35×
- Total profit
- $47,203
- Equity at exit
- $10,799
Cash invested: $34,972 (down + closing). Projections, not guarantees.
Landlord ↔ Tenant lean methodology
- Overall (STATE)
- 87 Strongly Landlord-Friendly
- State Florida
- 87 Strongly Landlord-Friendly · R+3
- County
- — inherits STATE
- City
- — inherits STATE
ZIP-level market 33541
- Home prices YoY
- -15.2%
- Rents YoY
- -2.5%
- Active inventory
- 856
- Price-to-rent
- 5.3×
Monthly cashflow live
- Estimated rent
- $1,969 high interval (Pro) →
- Mortgage (P&I)
- −$655
- Tax from tax record
- −$143 /mo · $1,711/yr
- Insurance
- −$52
- HOA
- −$37
- Vacancy / Maint / Mgmt
- −$413
- Net cashflow
- $669
Break-even live
Sensitivity live
| Price | -10% $739 | -5% $704 | +0% $669 | +5% $633 | +10% $598 |
|---|---|---|---|---|---|
| Rent | -10% $513 | -5% $591 | +0% $669 | +5% $746 | +10% $824 |
| Rate | -1.0pp $732 | -0.5pp $700 | base $669 | +0.5pp $636 | +1.0pp $603 |
UW: 25.0% down · 7.5% · 30yr · 1.5% tax · 5.0% vac · 8.0% maint · 8.0% mgmt
Financing live
Cash to close
- Down payment
- $31,225
- Closing costs
- $3,747
- Reserves months
- —
- Total cash needed
- —
Loan-product check · same deal, 3 products live
Conventional
25% down · 7.5% · 30yr
- Down + closing
- —
- Monthly P&I
- —
- Monthly cashflow
- —
- DSCR
- —
- Eligible?
- —
Personal DTI + credit; lowest rate.
DSCR
20% down · 8.5% · 30yr
- Down + closing
- —
- Monthly P&I
- —
- Monthly cashflow
- —
- DSCR
- —
- Eligible?
- —
No personal income docs; deal must DSCR.
Hard money
10% down · 12.0% · 12mo
- Down + closing
- —
- Monthly P&I
- —
- Monthly cashflow
- —
- DSCR
- —
- Eligible?
- —
Short-term bridge; refi at stabilization.
Rent comps 9 comps
| Address | Beds | Baths | Sqft | Rent | $/sqft | DOM | Units | Dist |
|---|---|---|---|---|---|---|---|---|
| 35940 Inspiration Dr Zephyrhills, FL | 1.0–3.0 | 1.0–2.0 | 1034 | $2,201 | $2.13 | 0d | 22 | 0.34mi |
| 36801 Camelia Ct Zephyrhills, FL | 2.0 | 2.0 | 864 | $1,350 | $1.56 | 25d | 1 | 0.61mi |
| 5914 Willow Ridge Dr #101 Zephyrhills, FL | 2.0 | 2.0 | 987 | $1,500 | $1.52 | 25d | 1 | 0.65mi |
| 36321 Stonewood Ln #103 Zephyrhills, FL | 2.0 | 2.0 | 987 | $1,525 | $1.55 | 25d | 1 | 0.68mi |
| 5168 Crooked Ln Zephyrhills, FL | 2.0 | 1.0 | 600 | $1,645 | $2.74 | 22d | 1 | 0.71mi |
| 36009 Deer Creek Dr #104 Zephyrhills, FL | 2.0 | 2.0 | 1029 | $1,450 | $1.41 | 25d | 1 | 0.72mi |
| 36015 Deer Creek Dr #202 Zephyrhills, FL | 2.0 | 2.0 | 1062 | $1,450 | $1.37 | 25d | 1 | 0.74mi |
| 5521 Barbara St Zephyrhills, FL | 2.0 | 2.0 | 1056 | $1,800 | $1.70 | 25d | 1 | 1.08mi |
| 6302 Abbott Station Dr Zephyrhills, FL | 3.0 | 1.0–2.5 | 855 | $1,999 | $2.34 | 2d | 142 | 1.47mi |
HOA detail
- Monthly dues
- $37 · $444/yr
Listing history 21 events
-
2026-06-18days on market $124,900 Active 135 DOM
-
2026-06-17days on market $124,900 Active 134 DOM
-
2026-06-16days on market $124,900 Active 133 DOM
-
2026-06-15days on market $124,900 Active 132 DOM
-
2026-06-13days on market $124,900 Active 130 DOM
-
2026-06-09days on market $124,900 Active 126 DOM
-
2026-06-08days on market $124,900 Active 125 DOM
-
2026-06-07days on market $124,900 Active 124 DOM
-
2026-06-04days on market $124,900 Active 121 DOM
-
2026-06-03days on market $124,900 Active 120 DOM
-
2026-06-02days on market $124,900 Active 119 DOM
-
2026-06-01days on market $124,900 Active 118 DOM
-
2026-05-31days on market $124,900 Active 117 DOM
-
2026-05-08status Active
-
2026-05-04status Pending
-
2026-03-23status Active
-
2026-03-22status Pending
-
2026-03-17price $124,900
-
2026-01-29$127,000 Active
-
1995-12-15soldstatus $25,000
-
1995-06-13soldstatus $27,900
ⓘ Source: listings_history table (triggers on properties + properties_extension) + one-shot
backfill from property_details.listing_events for pre-trigger history.
Tax reassessment forecast FL · Resets to sale price
- Current annual tax
- $1,711 · $143/mo
- Projected year-2 tax
- $1,711 · $143/mo
- Expected delta
- $0/yr ($0/mo · 0.0%)
ⓘ Screening estimate from a state-policy table — verify with the county assessor before closing.
Climate risk First Street
- Flood 1/10 Low FEMA zone X (unshaded) · 0% chance over 30 yrs
- Wildfire 4/10 Moderate
- Heat 9/10 Extreme 7 d/yr ≥108°F today · 24 d/yr by 30 yrs out
- Wind 9/10 Extreme 99% chance of damaging wind over 30 yrs
- Air quality 2/10 Low 1 unhealthy d/yr today · 2 by 30 yrs out
Nearby sold comps map
Loading sold comps map…
Walkable amenities ~0.75 mi
Loading nearby amenities…
Taxation est. · year 1
- Rental income
- $23,625
- − Mortgage interest
- −$6,996
- − Property taxes
- −$1,711
- − Insurance
- −$624
- − Repairs & maintenance
- −$1,890
- − Management
- −$1,890
- − HOA
- −$444
- − Depreciation
- −$3,633
- Taxable income
- $6,436
- Est. tax owed @ 24.0%
- −$1,545
- After-tax cash flow
- $6,480/yr
For passive investors: Depreciation is non-cash, so a rental often shows a tax loss while cash-flowing — sheltering income. Rental losses are passive: they offset passive income freely, and up to $25,000/yr can offset ordinary (W-2) income if you actively participate and your MAGI is under $100k (phasing out to $0 by $150k); unused losses carry forward. On sale, claimed depreciation is recaptured at up to 25%, and gains may owe capital-gains tax (a 1031 exchange can defer both). Figures are a year-1 estimate at your 24.0% rate — not tax advice; consult a CPA.
Schools (NCES district)
- District
- Pasco
- NCES district ID
- 1201530
- Math proficiency
- 50% ▼ -10.00%
- Reading proficiency
- 52% ▼ -5.00%
- Median HH income
- $45,039
- Composite
- 43.14/100
- National rank
- #3074
- State rank
- #32 of 73 in FL
Livability — Zephyrhills West
- Score
- 61/100
- State rank
- #772
- US rank
- #17403
Category grades
Schools grade is shown separately in the Schools card above.
Census & demographics
- County
- Pasco County · 524,098 people
- Metro
- Tampa-St. Petersburg-Clearwater, FL
- Population (ZIP)
- 24,654
- Household income
- $56,579
- Rent vs Own
- Severe rent burden
- 393.0
Population outlook (Pasco County) Hauer SSP2
- Today (2025)
- 570,045 people
- By 2030
- 605,844 · +6.3%
- By 2040
- 674,806 · +18.4%
- By 2050
- 736,022 · +29.1%
- By 2075
- 862,900 · +51.4%
- By 2100
- 906,364 · +59.0%
Race, ethnicity, and origin ACS 2023
- Neighborhood character
- Predominantly White (72%)
- Race & ethnicity
- White 72% Hispanic / Latino 15% Two or more races 8% Black 5% Asian 5%
- Hispanic origin (detail)
- Mexican 4% Puerto Rican 9%
- Common ancestry
- Lithuanian 4% Romanian 3% Serbian 3%
- Foreign-born
- 9% · Canada, Vietnam
- Languages at home
- 85% English-only · Spanish 9% Tagalog/Filipino 1% Other Asian/Pacific 1%
Political lean MEDSL · Pasco
- 2024 margin
- Strong R (+25.2) · D 36.9% · R 62.1% · Other 1.0%
- 2008→2024 swing
- -21.6pp toward R · 2008: -3.6pp · 2024: -25.2pp
- All cycles
- 2024: R+25.2 2020: R+20.1 2016: R+21.6 2012: R+6.7 2008: R+3.6
Not yet ingested
- Civics
- —
Market trends
- HPI YoY
- ▼ -55.21%
- Current HPI
- 308.0619
- Rent YoY
- ▼ -2.51%
- Metro
- Tampa-St. Petersburg-Clearwater, FL
- State GDP YoY
- ▲ 3.28%
- F500 in state
- 36
Industry mix (Fortune 500 HQ in FL)
| Industry | F500 HQs | Revenue |
|---|---|---|
| Industrial Technology | 2 | $29B |
|
||
| Insurance | 2 | $17B |
|
||
| Retail | 1 | $60B |
|
||
| Technology Distribution | 1 | $58B |
|
||
| Homebuilding | 1 | $35B |
|
||
| Technology Manufacturing | 1 | $35B |
|
||
Price history
+347.7% since first listed8 events — show timeline
- 2026-05-08 Relisted — Stellar MLS as Distributed by MLS Grid
- 2026-05-04 Pending — Stellar MLS as Distributed by MLS Grid
- 2026-03-23 Relisted — Stellar MLS as Distributed by MLS Grid
- 2026-03-22 Pending — Stellar MLS as Distributed by MLS Grid
- 2026-03-17 Price Changed $124,900 Stellar MLS as Distributed by MLS Grid
- 2026-01-29 Listed $127,000 Stellar MLS as Distributed by MLS Grid
- 1995-12-15 Sold (Public Records) $25,000 Public Records
- 1995-06-13 Sold (Public Records) $27,900 Public Records
Property tax history
+15.0%/yrLatest (2025): $1,711 · +9.1% YoY. Source: county tax records.
Cash-flow waterfall
monthlySold comps — $/sqft
last 12 mo · ≤1 miLoading sold comps…