2647 Marco Polo Dr · Clearwater, FL
Flood risk 6/10 · Moderate
- FEMA flood zone
- X (unshaded)
- Chance of flooding over 30 yrs
- 0.53%
- Est. flood insurance / yr
- $507 – $1,088
Fire risk 1/10 · Minimal
- Est. fire insurance / yr
- $947 – $1,759
Heat risk 10/10 · Severe
- Hot days now (above 107°F)
- 7 days/yr
- Hot days in 30 yrs
- 25 days/yr
Wind risk 10/10 · Severe
- Chance of severe wind over 30 yrs
- 99.0%
Air-quality risk 3/10 · Minor
- Unhealthy air days now
- 3 days/yr
- Unhealthy air days in 30 yrs
- 3 days/yr
Risk factors via First Street. Map © Google.
Why this score? — see what drove the C+ grade
The composite is a weighted blend of 9 inputs, each scored 0–100. Each bar is that input's sub-score; the figure is the points it added to the 100-point composite (weight × sub-score).
- Cash flow +30.0/30.0
- DSCR +10.0/10.0
- 1% rule +8.5/10.0
- Schools +4.3/10.0
- Livability +4.1/5.0
- Condition / age +2.5/5.0
- Rent growth +1.2/5.0
- ARV discount +0.0/15.0
- Appreciation +0.0/10.0
$149,900
🖨 Deal sheet (PDF) 📄 Offer letter ✓ Due diligence
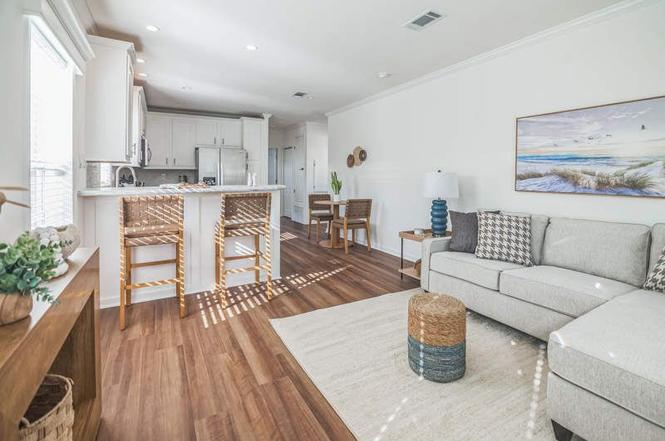
Key facts
- Open floor plan
- Hot tub
- Spacious kitchen
Tags
Property features AI
Finance
- Financial info: List price $149,900
Exterior
- Home design: Spec new-construction plan named 2647 Marco Polo Drive; Located at 2647 Marco Polo Dr, Clearwater, FL 33764
Interior
- Bedrooms: 2 bedrooms
- Bathrooms: 2 full bathrooms
- Interior features: Living area of 919
Neighborhood map
What this means for you Summary
Snapshot
- This is a 2-bed/2.0-bath manufactured listed at $150k.
Deal economics
- At list price, monthly cash flow is $562 ($7k/yr) — positive.
- The deal already cash-flows at list — no discount required.
- Meets the 1% rule at list price ($2k rent vs $150k).
- Recommended offer: $132k (12.0% below list) — sets the bar for market timing.
- Cap rate 10.8% vs local median 3.0% in Clearwater — top-decile yield for the area; either an underpriced asset or a hidden risk that comps aren't pricing in. Stress-test before assuming the spread holds.
Location & tenants
- Location reads 82/100 on livability (#60 in FL, #988 nationally) — a professional / high-income tenant draw. Strengths: commute A+, housing A+, health & safety A+; Watch: schools C-, employment C-.
- Pinellas (suburban): math 51% / reading 51% proficiency, ranked #31 of 73 in FL (top 42%) — acceptable for families but not a draw, mixed tenant base, ~2y average lease.
- Market conditions: Rents falling (-5.2%/yr); 262 active listings in the ZIP; 40 comparable units currently listed for rent nearby; rentals at typical pace (median 16d on market — plan ~3-4 weeks tenant-placement turnaround); 2,676 units permitted in Pinellas County in 2024 (1,422 in 5+ unit buildings).
- This rent runs 36% of the median local income ($67k/yr) — at the standard rent-burdened threshold; future hikes will face affordability resistance.
Forward outlook
- Local home prices are declining (-3.0%/yr); year-one equity from $1k of loan paydown is wiped out by about $4k of value loss. Plan a longer hold.
- Pinellas County population projected at +14% by 2050 — modest demand growth; plan on rents tracking national, not racing it.
Negotiation context
- It's been on market 373 days — a 12% lower offer ($132k) is reasonable based on typical stale-listing flexibility.
Risks & watch-outs
- Climate carrying-cost: major flood risk; severe wind risk, 99% chance of damaging wind over 30y; extreme-heat days projected 7→25/yr by 2055 (HVAC capex compounding) — expect insurance premiums to compound above CPI over the hold.
Questions for the listing agent
- It's been on market 373 days. Have you received any prior offers? Is the seller open to a 12% concession, seller financing, or rate buy-down credit?
- Why hasn't it sold? Are there any deal-killer items the seller is aware of (foundation, flood, title, zoning, code violations)?
- Is there a deadline driving the sale (1031 exchange, divorce, estate, relocation)? That informs how much negotiation room exists.
- What's the average days-on-market for RENTAL listings here right now (not sales)? A rising rental-DOM trend means longer vacancies and softer asking-rent achievability than the comps imply.
- What's the recent tenant-quality profile in this submarket — average credit score on applications, eviction rate, late-payment / NSF rate, and stable-employment percentage? A property-management company in the area should have these aggregated.
- How much new for-sale + rental construction is in the pipeline within 1–3 miles? Heavy new supply typically softens prices + rents 12–24 months out; constrained supply supports both.
Investment metrics
- 1% rule
- 1.35% ✓
- Cap rate
- 10.79%
- Cash-on-cash
- 16.06%
- DSCR
- 1.71
- GRM
- 6.2
CMA / ARV
- ARV (on-the-fly)
- $124,984
- Comps found
- 5
Show comp detail 5 sales within ~0.75 mi
| Address | Dist | Beds/Ba | Sqft | Sold | Price | $/sf | Match |
|---|---|---|---|---|---|---|---|
| 18675 US Highway 19 N #478 | 0.65mi | 2/1.5 | 936 (+2%) | 3mo | $69,900 | $75 | 62 |
| 585 Sky Harbor Dr #416 | 0.44mi | 2/1.0 | 946 (+3%) | 10mo | $130,000 | $137 | 62 |
| 20000 US Highway 19 N #629 | 0.40mi | 2/2.0 | 810 (-12%) | 4mo | $110,000 | $136 | 59 |
| 20000 US Highway 19 N #420 | 0.40mi | 2/1.5 | 966 (+5%) | 21mo | $80,000 | $83 | 54 |
| 18675 US Highway 19 N #362 | 0.65mi | 2/1.5 | 792 (-14%) | 5mo | $110,000 | $139 | 40 |
Match score weights: distance 35% · size 25% · config 20% · recency 20%. Top-matched comps best support the ARV.
Projected returns pro-forma
-3.0% appreciation · 0.0% rent growth · sell at horizon
- IRR
- 3.6%
- Equity multiple
- 1.13×
- Total profit
- $5,581
- Equity at exit
- $22,351
- IRR
- 10.0%
- Equity multiple
- 1.67×
- Total profit
- $28,136
- Equity at exit
- $12,961
Cash invested: $41,972 (down + closing). Projections, not guarantees.
Landlord ↔ Tenant lean methodology
- Overall (STATE)
- 87 Strongly Landlord-Friendly
- State Florida
- 87 Strongly Landlord-Friendly · R+3
- County
- — inherits STATE
- City
- — inherits STATE
ZIP-level market 33764
- Rents YoY
- -5.2%
- Active inventory
- 262
- Price-to-rent
- 6.2×
Monthly cashflow live
- Estimated rent
- $2,022 high interval (Pro) →
- Mortgage (P&I)
- −$786
- Tax est. 1.5%
- −$187 /mo · $2,248/yr
- Insurance
- −$62
- HOA
- −$0
- Vacancy / Maint / Mgmt
- −$425
- Net cashflow
- $562
Break-even live
Sensitivity live
| Price | -10% $665 | -5% $613 | +0% $562 | +5% $510 | +10% $458 |
|---|---|---|---|---|---|
| Rent | -10% $402 | -5% $482 | +0% $562 | +5% $641 | +10% $721 |
| Rate | -1.0pp $637 | -0.5pp $600 | base $562 | +0.5pp $523 | +1.0pp $483 |
UW: 25.0% down · 7.5% · 30yr · 1.5% tax · 5.0% vac · 8.0% maint · 8.0% mgmt
Financing live
Cash to close
- Down payment
- $37,475
- Closing costs
- $4,497
- Reserves months
- —
- Total cash needed
- —
Loan-product check · same deal, 3 products live
Conventional
25% down · 7.5% · 30yr
- Down + closing
- —
- Monthly P&I
- —
- Monthly cashflow
- —
- DSCR
- —
- Eligible?
- —
Personal DTI + credit; lowest rate.
DSCR
20% down · 8.5% · 30yr
- Down + closing
- —
- Monthly P&I
- —
- Monthly cashflow
- —
- DSCR
- —
- Eligible?
- —
No personal income docs; deal must DSCR.
Hard money
10% down · 12.0% · 12mo
- Down + closing
- —
- Monthly P&I
- —
- Monthly cashflow
- —
- DSCR
- —
- Eligible?
- —
Short-term bridge; refi at stabilization.
Rent comps 40 comps
| Address | Beds | Baths | Sqft | Rent | $/sqft | DOM | Units | Dist |
|---|---|---|---|---|---|---|---|---|
| 1001 Pearce Dr #302 Clearwater, FL | 1.0 | 1.5 | 1048 | $1,750 | $1.67 | 5d | 1 | 0.21mi |
| 19355 US Highway 19 N Clearwater, FL | 1.0–3.0 | 1.0–2.0 | 1093 | $2,489 | $2.28 | 4d | 13 | 0.27mi |
| 2729 Seville Blvd Clearwater, FL | 1.0–3.0 | 1.0–2.0 | 1057 | $2,432 | $2.30 | 3d | 33 | 0.28mi |
| 19135 US Highway 19 N Clearwater, FL | 1.0–4.0 | 1.0–2.5 | 1139 | $1,849 | $1.62 | 3d | 30 | 0.39mi |
| 20000 US Highway 19 N #612 Clearwater, FL | 2.0 | 2.0 | 800 | $1,300 | $1.62 | 25d | 1 | 0.42mi |
| 20000 US Highway 19 N Unit 610 Clearwater, FL | 1.0 | 1.0 | 800 | $1,150 | $1.44 | 25d | 1 | 0.45mi |
| 19029 US Highway 19 N Unit 6-10 Clearwater, FL | 1.0 | 1.0 | 875 | $1,300 | $1.49 | 5d | 1 | 0.51mi |
| 19029 U.S. 19 Unit 7-8 Clearwater, FL | 2.0 | 2.0 | 1060 | $2,200 | $2.08 | 19d | 1 | 0.51mi |
| 19029 U.S. 19 Unit 1-19 Clearwater, FL | 1.0 | 1.5 | 950 | $2,000 | $2.11 | 23d | 1 | 0.51mi |
| 1330 Moreland Dr Clearwater, FL | 2.0 | 2.0 | 1192 | $2,125 | $1.78 | 25d | 3 | 0.71mi |
| 2430 Harn Blvd Unit 7 Clearwater, FL | 1.0 | 1.0 | 725 | $1,500 | $2.07 | 5d | 1 | 0.74mi |
| 2430 Harn Blvd Unit 14 Clearwater, FL | 1.0 | 1.0 | 725 | $1,400 | $1.93 | 25d | 1 | 0.74mi |
| 2909 Gulf To Bay Blvd Clearwater, FL | 1.0–2.0 | 1.0–2.0 | 931 | $1,849 | $1.98 | 4d | 9 | 0.78mi |
| 1515 Flournoy Loop Unit 1511622P Clearwater, FL | 1.0 | 1.0 | 796 | $3,057 | $3.84 | 16d | 1 | 0.78mi |
| 1515 Flournoy Loop Unit 1511623P Clearwater, FL | 1.0 | 1.0 | 796 | $4,866 | $6.11 | 3d | 1 | 0.78mi |
| 1551 Flournoy Cir W Clearwater, FL | 1.0–3.0 | 1.0–2.0 | 916 | $2,086 | $2.28 | 3d | 32 | 0.85mi |
| 2755 Via Capri #1237 Clearwater, FL | 1.0 | 1.0 | 980 | $2,000 | $2.04 | 23d | 1 | 0.86mi |
| 2755 Via Capri #1226 Clearwater, FL | 2.0 | 1.0 | 980 | $2,798 | $2.86 | 5d | 1 | 0.86mi |
| 1564 Flournoy Cir W Unit 1515105P Clearwater, FL | 2.0 | 2.0 | 990 | $5,329 | $5.38 | 16d | 1 | 0.89mi |
| 2981 Gulf To Bay Blvd Clearwater, FL | 1.0–3.0 | 1.0–2.0 | 1198 | $4,145 | $3.46 | 4d | 27 | 0.92mi |
| 2975 Gulf To Bay Blvd Clearwater, FL | 2.0 | 1.0–2.0 | 874 | $5,180 | $5.92 | 5d | 49 | 0.93mi |
| 2973 Gulf to Bay Blvd Unit 2 Clearwater, FL | 2.0 | 2.0 | 1064 | $3,219 | $3.03 | 25d | 1 | 0.95mi |
| 2346 Druid Rd #1106 Clearwater, FL | 2.0 | 2.0 | 1008 | $1,495 | $1.48 | 18d | 1 | 0.95mi |
| 2600 W Grand Reserve Cir Clearwater, FL | 1.0–3.0 | 1.0–2.0 | 1097 | $2,145 | $1.96 | 3d | 36 | 0.96mi |
| 101 S Old Coachman Rd Clearwater, FL | 3.0 | 1.0–2.0 | 983 | $2,296 | $2.34 | 4d | 16 | 0.96mi |
| 2705 Via Murano #136 Clearwater, FL | 2.0 | 1.0 | 980 | $2,100 | $2.14 | 19d | 1 | 0.98mi |
| 2705 Via Murano #125 Clearwater, FL | 1.0 | 1.0 | 890 | $1,795 | $2.02 | 25d | 1 | 0.98mi |
| 2724 Via Murano #634 Clearwater, FL | 1.0 | 1.0 | 890 | $1,695 | $1.90 | 25d | 1 | 0.98mi |
| 2732 Via Murano #527 Clearwater, FL | 2.0 | 2.0 | 1110 | $2,800 | $2.52 | 25d | 1 | 0.98mi |
| 2723 Via Capri #834 Clearwater, FL | 1.0 | 1.0 | 770 | $1,875 | $2.44 | 5d | 1 | 1.02mi |
| 2721 Via Murano #324 Clearwater, FL | 1.0 | 1.0 | 770 | $1,750 | $2.27 | 5d | 1 | 1.02mi |
| 2366 Shelley St Clearwater, FL | 1.0 | 1.0 | 585 | $1,425 | $2.44 | 15d | 2 | 1.06mi |
| 2366 Shelley St #12 Clearwater, FL | 1.0 | 1.0 | 585 | $1,550 | $2.65 | 25d | 1 | 1.06mi |
| 2381 Chaucer St Clearwater, FL | 2.0 | 1.0 | 1000 | $1,950 | $1.95 | 3d | 1 | 1.07mi |
| 2353 Shelley St #11 Clearwater, FL | 1.0 | 1.0 | 585 | $1,150 | $1.97 | 25d | 1 | 1.08mi |
| 2348 Shelley St #9 Clearwater, FL | 2.0 | 1.0 | 950 | $2,200 | $2.32 | 25d | 1 | 1.10mi |
| 2370 Chaucer St Clearwater, FL | 3.0 | 1.0 | 1100 | $2,500 | $2.27 | 5d | 1 | 1.11mi |
| 2236 Morningside Dr Clearwater, FL | 2.0 | 1.5 | 902 | $2,200 | $2.44 | 5d | 1 | 1.13mi |
| 2618 Cove Cay Dr Clearwater, FL | 1.0–2.0 | 1.0–2.0 | 807 | $1,850 | $2.29 | 25d | 2 | 1.20mi |
| 2618 Cove Cay Dr #909 Clearwater, FL | 2.0 | 2.0 | 1050 | $1,850 | $1.76 | 21d | 1 | 1.20mi |
Listing history 12 events
-
2026-06-18days on market $149,900 Active 373 DOM
-
2026-06-17days on market $149,900 Active 372 DOM
-
2026-06-16days on market $149,900 Active 371 DOM
-
2026-06-15days on market $149,900 Active 370 DOM
-
2026-06-13days on market $149,900 Active 368 DOM
-
2026-06-09days on market $149,900 Active 364 DOM
-
2026-06-08days on market $149,900 Active 363 DOM
-
2026-06-07days on market $149,900 Active 362 DOM
-
2026-06-04days on market $149,900 Active 359 DOM
-
2026-06-03days on market $149,900 Active 358 DOM
-
2026-06-01days on market $149,900 Active 356 DOM
-
2026-05-31days on market $149,900 Active 355 DOM
ⓘ Source: listings_history table (triggers on properties + properties_extension) + one-shot
backfill from property_details.listing_events for pre-trigger history.
Climate risk First Street
- Flood 6/10 Major FEMA zone X (unshaded) · 53% chance over 30 yrs
- Wildfire 1/10 Low
- Heat 10/10 Extreme 7 d/yr ≥107°F today · 25 d/yr by 30 yrs out
- Wind 10/10 Extreme 99% chance of damaging wind over 30 yrs
- Air quality 3/10 Moderate 3 unhealthy d/yr today · 3 by 30 yrs out
Nearby sold comps map
Loading sold comps map…
Walkable amenities ~0.75 mi
Loading nearby amenities…
Taxation est. · year 1
- Rental income
- $24,266
- − Mortgage interest
- −$8,397
- − Property taxes
- −$2,248
- − Insurance
- −$750
- − Repairs & maintenance
- −$1,941
- − Management
- −$1,941
- − Depreciation
- −$4,361
- Taxable income
- $4,628
- Est. tax owed @ 24.0%
- −$1,111
- After-tax cash flow
- $5,628/yr
For passive investors: Depreciation is non-cash, so a rental often shows a tax loss while cash-flowing — sheltering income. Rental losses are passive: they offset passive income freely, and up to $25,000/yr can offset ordinary (W-2) income if you actively participate and your MAGI is under $100k (phasing out to $0 by $150k); unused losses carry forward. On sale, claimed depreciation is recaptured at up to 25%, and gains may owe capital-gains tax (a 1031 exchange can defer both). Figures are a year-1 estimate at your 24.0% rate — not tax advice; consult a CPA.
Schools (NCES district)
- District
- Pinellas
- NCES district ID
- 1201560
- Math proficiency
- 51% ▼ -5.00%
- Reading proficiency
- 51% ▼ -3.00%
- Median HH income
- $46,270
- Composite
- 43.27/100
- National rank
- #3046
- State rank
- #31 of 73 in FL
Livability — Clearwater
- Score
- 82/100
- State rank
- #60
- US rank
- #988
Category grades
Schools grade is shown separately in the Schools card above.
Census & demographics
- Census place
- Clearwater, FL
- County
- Pinellas County · 939,478 people
- City population
- 170,933
- Metro
- Tampa-St. Petersburg-Clearwater, FL
- Population (ZIP)
- 27,311
- Household income
- $67,256
- Rent vs Own
- Severe rent burden
- 1118.0
Population outlook (Pinellas County) Hauer SSP2
- Today (2025)
- 1,027,532 people
- By 2030
- 1,063,586 · +3.5%
- By 2040
- 1,125,020 · +9.5%
- By 2050
- 1,168,637 · +13.7%
- By 2075
- 1,265,188 · +23.1%
- By 2100
- 1,260,357 · +22.7%
Race, ethnicity, and origin ACS 2023
- Neighborhood character
- Predominantly White (76%)
- Race & ethnicity
- White 76% Hispanic / Latino 13% Two or more races 8% Asian 4% Black 2%
- Hispanic origin (detail)
- Mexican 2% Puerto Rican 3% Cuban 2%
- Common ancestry
- Romanian 4% Lithuanian 3% German 2%
- Foreign-born
- 14% · Canada, Jamaica, Vietnam
- Languages at home
- 80% English-only · Spanish 10% Russian/Polish/Slavic 4% Other Indo-European 2%
Political lean MEDSL · Pinellas
- 2024 margin
- Lean R (+5.2) · D 46.9% · R 52.1%
- 2008→2024 swing
- -13.5pp toward R · 2008: 8.3pp · 2024: -5.2pp
- All cycles
- 2024: R+5.2 2020: D+0.2 2016: R+1.1 2012: D+5.6 2008: D+8.3
Not yet ingested
- Civics
- —
Market trends
- HPI YoY
- ▼ -350.08%
- Current HPI
- 315.4133
- Rent YoY
- ▼ -5.24%
- Metro
- Tampa-St. Petersburg-Clearwater, FL
- State GDP YoY
- ▲ 3.28%
- F500 in state
- 36
Industry mix (Fortune 500 HQ in FL)
| Industry | F500 HQs | Revenue |
|---|---|---|
| Industrial Technology | 2 | $29B |
|
||
| Insurance | 2 | $17B |
|
||
| Retail | 1 | $60B |
|
||
| Technology Distribution | 1 | $58B |
|
||
| Homebuilding | 1 | $35B |
|
||
| Technology Manufacturing | 1 | $35B |
|
||
Cash-flow waterfall
monthlySold comps — $/sqft
last 12 mo · ≤1 miLoading sold comps…