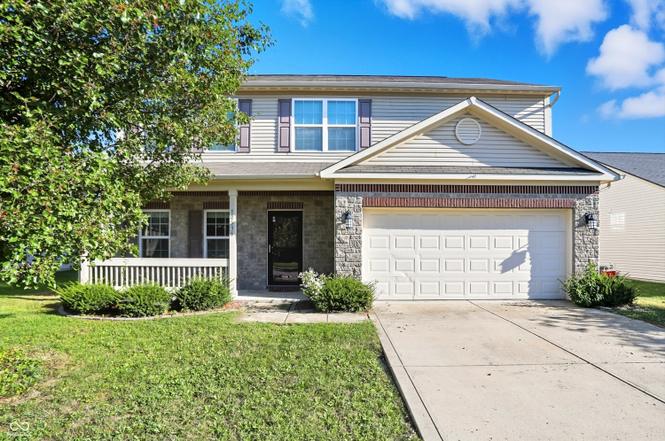
10536 Deercrest Ln · Indianapolis city (balance), IN
Flood risk 1/10 · Minimal
- FEMA flood zone
- X (unshaded)
- Chance of flooding over 30 yrs
- 0.0%
- Est. flood insurance / yr
- $507 – $1,088
Fire risk 1/10 · Minimal
- Est. fire insurance / yr
- $717 – $1,331
Heat risk 4/10 · Minor
- Hot days now (above 101°F)
- 7 days/yr
- Hot days in 30 yrs
- 20 days/yr
Wind risk 2/10 · Minimal
- Chance of severe wind over 30 yrs
- 1.0%
Air-quality risk 2/10 · Minimal
- Unhealthy air days now
- 1 days/yr
- Unhealthy air days in 30 yrs
- 2 days/yr
Risk factors via First Street. Map © Google.
Why this score? — see what drove the D grade
The composite is a weighted blend of 9 inputs, each scored 0–100. Each bar is that input's sub-score; the figure is the points it added to the 100-point composite (weight × sub-score).
- Cash flow +11.4/30.0
- ARV discount +11.4/15.0
- Rent growth +4.0/5.0
- Schools +4.0/10.0
- DSCR +3.3/10.0
- 1% rule +2.9/10.0
- Livability +2.5/5.0
- Condition / age +2.5/5.0
- Appreciation +0.0/10.0
$290,000
🖨 Deal sheet 📄 Offer letter ✓ Due diligence
Listing remarks MLS
Pride of ownership is shown here! This immaculately maintained home features an open floor plan with room for everyone. Nice sized Family room that is open to kitchen that features upgraded cabs, pantry, stnls appl and new lighting. Four good sized bedrooms upstairs including a fabulous master suite with double WIC, double sinks, shower and garden tub. Living room can be used as flex space such as office, playroom, dining room, etc. You will love this neighborhood w/ pool, walking trails, and water views. Nothing to do here, but move in and enjoy!!
Key facts
- Flexible front room
- Generous pantry
- Center island
Tags
Property features AI
Finance
- HOA & community: Homeowners association with annual fee (includes insurance and snow removal); Community pool; HOA governed by covenants and restrictions
Exterior
- Parking: Attached 2-car garage (approx. 460 sq ft)
- Utilities: Public water; Municipal sewer; Cable available; Solid waste service
- Home design: Single-family residence; Two levels
- Construction: Stone and vinyl siding exterior; Slab foundation; Built by Westport Homes
- Exterior features: Covered patio/porch; Partial fencing; Sidewalks; Lot under 1/4 acre
Interior
- Kitchen: Dishwasher; Electric oven; Microwave with hood; Garbage disposal; Refrigerator
- Bedrooms: 4 bedrooms on the upper level; Primary bedroom with walk-in closet
- Bathrooms: 2 full bathrooms; 1 half bathroom; Primary bathroom with garden tub, double sinks, and a full shower stall
- Heating & cooling: Heat pump (electric); Central air conditioning
- Interior features: Kitchen island; Pantry; Walk-in closets; Living room (formal); Smoke alarm
- Laundry & utility: Laundry on the upper level; Electric water heater
Neighborhood map
What this means for you Summary
Snapshot
- This is a 4-bed/2.5-bath single-family listed at $290k.
Deal economics
- At list price, monthly cash flow is $-102 ($-1k/yr) — negative.
- To cash-flow at today's rent, offer at most $272k (6.2% below list).
- To meet the 1% rule (rent ≥ 1% of price), the offer needs to be $229k (21.0% below list).
- Recommended offer: $229k (21.0% below list) — sets the bar for 1% rule.
- Cap rate 5.9% vs local median 4.4% in Indianapolis city (balance) — top-decile yield for the area; either an underpriced asset or a hidden risk that comps aren't pricing in. Stress-test before assuming the spread holds.
Location & tenants
- Location reads: area grade D — affects rentability + tenant quality, not the cash-flow math above.
- Franklin Township Community School Corporation (urban): math 42% / reading 47% proficiency, ranked #87 of 301 in IN (top 29%) — families likely to look elsewhere, expect single-tenant / working-renter base with shorter leases.
- Market conditions: Rents rising fast (+6.1%/yr); 333 active listings in the ZIP; 3 comparable units currently listed for rent nearby; rentals leasing fast (median 8d on market — plan ~1-2 weeks tenant-placement turnaround); solid renter incomes; 1,906 units permitted in Marion County in 2024 (621 in 5+ unit buildings).
Forward outlook
- Local home prices are declining (-3.0%/yr); year-one equity from $2k of loan paydown is wiped out by about $9k of value loss. Plan a longer hold.
- Marion County population projected at +18% by 2050 — long-run rental-demand tailwind backs the buy-and-hold thesis.
Negotiation context
- It's been on market 159 days — a 12% lower offer ($255k) is reasonable based on typical stale-listing flexibility.
- 5 sale attempts since 13y ago; this cycle's ask has dropped $28k (9%) from the opening price — seller is motivated, your offer sets the floor, not the list.
- Current owner paid $239k; 21% above their basis — modest negotiation headroom, anchor on the comps not their cost.
Questions for the listing agent
- What do current leases actually rent for vs. the listed asking? Can we see a recent rent roll and the last 12 months of T-12 income?
- It's been on market 159 days. Have you received any prior offers? Is the seller open to a 21% concession, seller financing, or rate buy-down credit?
- What does the HOA fee cover, when was the last increase, and are there any pending special assessments or reserve-fund shortfalls?
- Why hasn't it sold? Are there any deal-killer items the seller is aware of (foundation, flood, title, zoning, code violations)?
- Is there a deadline driving the sale (1031 exchange, divorce, estate, relocation)? That informs how much negotiation room exists.
- The area grade is low — what's the realistic commute time and amenity access for the typical tenant pool here? Any planned neighborhood developments (good or bad) we should know about?
- What's the average days-on-market for RENTAL listings here right now (not sales)? A rising rental-DOM trend means longer vacancies and softer asking-rent achievability than the comps imply.
- What's the recent tenant-quality profile in this submarket — average credit score on applications, eviction rate, late-payment / NSF rate, and stable-employment percentage? A property-management company in the area should have these aggregated.
- How much new for-sale + rental construction is in the pipeline within 1–3 miles? Heavy new supply typically softens prices + rents 12–24 months out; constrained supply supports both.
Investment metrics
- 1% rule
- 0.79% ✗
- Cap rate
- 5.87%
- Cash-on-cash
- -1.51%
- DSCR
- 0.93
- GRM
- 10.6
CMA / ARV
- ARV (on-the-fly)
- $317,460
- Comps found
- 12
Show comp detail 12 sales within ~0.75 mi
| Address | Dist | Beds/Ba | Sqft | Sold | Price | $/sf | Match |
|---|---|---|---|---|---|---|---|
| 10451 Pintail Ln | 0.10mi | 4/3.0 | 2,302 (+4%) | 2mo | $315,000 | $137 | 86 |
| 10644 Pintail Ln | 0.15mi | 5/3.0 (+1) | 2,308 (+4%) | 3mo | $342,500 | $148 | 77 |
| 4025 Senour Rd | 0.36mi | 3/2.5 (-1) | 2,192 (-1%) | 1mo | $292,000 | $133 | 75 |
| 10529 Pintail Ln | 0.03mi | 3/2.5 (-1) | 2,004 (-10%) | 2mo | $319,500 | $159 | 75 |
| 4414 Wild Pheasant Ln | 0.14mi | 3/2.5 (-1) | 2,007 (-10%) | 2mo | $305,000 | $152 | 71 |
| 4218 Mendocino Blvd | 0.25mi | 5/3.0 (+1) | 2,422 (+9%) | 8mo | $335,000 | $138 | 60 |
| 4303 Orr Springs Dr | 0.37mi | 5/3.0 (+1) | 2,422 (+9%) | 4mo | $340,000 | $140 | 58 |
| 4142 Mendocino Blvd | 0.29mi | 5/3.0 (+1) | 2,427 (+9%) | 8mo | $346,000 | $143 | 57 |
| 10819 Gates Creek Dr | 0.33mi | 5/3.0 (+1) | 2,422 (+9%) | 8mo | $336,000 | $139 | 56 |
| 10534 Pokagon Way | 0.60mi | 4/2.5 | 2,428 (+9%) | 2mo | $325,000 | $134 | 55 |
| 4209 Orr Springs Dr | 0.38mi | 5/3.0 (+1) | 2,422 (+9%) | 7mo | $355,000 | $147 | 54 |
| 4754 Corydon Ln | 0.52mi | 3/2.5 (-1) | 1,911 (-14%) | 7mo | $334,500 | $175 | 42 |
Match score weights: distance 35% · size 25% · config 20% · recency 20%. Top-matched comps best support the ARV.
Projected returns pro-forma
-3.0% appreciation · 6.11% rent growth · sell at horizon
- IRR
- -15.5%
- Equity multiple
- 0.43×
- Total profit
- $-46,131
- Equity at exit
- $43,240
- IRR
- -2.6%
- Equity multiple
- 0.80×
- Total profit
- $-16,312
- Equity at exit
- $25,074
Cash invested: $81,200 (down + closing). Projections, not guarantees.
Landlord ↔ Tenant lean methodology
- Overall (STATE)
- 90 Strongly Landlord-Friendly
- State Indiana
- 90 Strongly Landlord-Friendly · R+11
- County
- — inherits STATE
- City
- — inherits STATE
ZIP-level market 46239
- Home prices YoY
- -29.2%
- Rents YoY
- 6.1%
- Active inventory
- 333
- Price-to-rent
- 10.6×
Monthly cashflow live
- Estimated rent
- $2,290 medium interval (Pro) →
- Mortgage (P&I)
- −$1,521
- Tax from tax record
- −$240 /mo · $2,878/yr
- Insurance
- −$121
- HOA
- −$30
- Vacancy / Maint / Mgmt
- −$481
- Net cashflow
- $-102
Break-even live
UW: 25.0% down · 7.5% · 30yr · 1.5% tax · 5.0% vac · 8.0% maint · 8.0% mgmt
Financing live
Cash to close
- Down payment
- $72,500
- Closing costs
- $8,700
- Reserves months
- —
- Total cash needed
- —
Loan-product check · same deal, 3 products live
Conventional
25% down · 7.5% · 30yr
- Down + closing
- —
- Monthly P&I
- —
- Monthly cashflow
- —
- DSCR
- —
- Eligible?
- —
Personal DTI + credit; lowest rate.
DSCR
20% down · 8.5% · 30yr
- Down + closing
- —
- Monthly P&I
- —
- Monthly cashflow
- —
- DSCR
- —
- Eligible?
- —
No personal income docs; deal must DSCR.
Hard money
10% down · 12.0% · 12mo
- Down + closing
- —
- Monthly P&I
- —
- Monthly cashflow
- —
- DSCR
- —
- Eligible?
- —
Short-term bridge; refi at stabilization.
Rent comps 3 comps
| Address | Beds | Baths | Sqft | Rent | $/sqft | DOM | Units | Dist |
|---|---|---|---|---|---|---|---|---|
| 4526 Wild Turkey Dr Indianapolis, IN | 4.0 | 2.5 | 1880 | $1,950 | $1.04 | 7d | 1 | 0.21mi |
| 4146 Palermo Garden Indianapolis, IN | 3.0 | 2.0 | 1790 | $2,100 | $1.17 | 1d | 1 | 0.62mi |
| 9237 Kavanaugh Dr Indianapolis, IN | 3.0 | 2.0 | 1503 | $2,200 | $1.46 | 17d | 1 | 1.44mi |
HOA detail
- Monthly dues
- $30 · $360/yr
- Likely covers
- waterpool
Listing history 4 events
-
2026-06-18days on market $290,000 Active 159 DOM
-
2026-06-17days on market $290,000 Active 158 DOM
-
2026-06-16remarks 699-char remark
-
2026-06-16$290,000 Active 157 DOM
ⓘ Source: listings_history table (triggers on properties + properties_extension) + one-shot
backfill from property_details.listing_events for pre-trigger history.
Tax reassessment forecast IN · Partial reset (capped growth)
- Current annual tax
- $2,878 · $240/mo
- Projected year-2 tax
- $2,878 · $240/mo
- Expected delta
- $0/yr ($0/mo · 0.0%)
ⓘ Screening estimate from a state-policy table — verify with the county assessor before closing.
Climate risk First Street
- Flood 1/10 Low FEMA zone X (unshaded) · 0% chance over 30 yrs
- Wildfire 1/10 Low
- Heat 4/10 Moderate 7 d/yr ≥101°F today · 20 d/yr by 30 yrs out
- Wind 2/10 Low 100% chance of damaging wind over 30 yrs
- Air quality 2/10 Low 1 unhealthy d/yr today · 2 by 30 yrs out
Nearby sold comps map
Loading sold comps map…
Walkable amenities ~0.75 mi
Loading nearby amenities…
Taxation est. · year 1
- Rental income
- $27,484
- − Mortgage interest
- −$16,245
- − Property taxes
- −$2,878
- − Insurance
- −$1,450
- − Repairs & maintenance
- −$2,199
- − Management
- −$2,199
- − HOA
- −$360
- − Depreciation
- −$8,436
- Taxable loss
- −$6,283
- Est. tax savings @ 24.0%
- +$1,508
- After-tax cash flow
- $282/yr
For passive investors: Depreciation is non-cash, so a rental often shows a tax loss while cash-flowing — sheltering income. Rental losses are passive: they offset passive income freely, and up to $25,000/yr can offset ordinary (W-2) income if you actively participate and your MAGI is under $100k (phasing out to $0 by $150k); unused losses carry forward. On sale, claimed depreciation is recaptured at up to 25%, and gains may owe capital-gains tax (a 1031 exchange can defer both). Figures are a year-1 estimate at your 24.0% rate — not tax advice; consult a CPA.
Schools (NCES district)
- District
- Franklin Township Community School Corporation
- NCES district ID
- 1803750
- Math proficiency
- 42% ▼ -12.00%
- Reading proficiency
- 47% ▼ -6.00%
- Median HH income
- $67,825
- Composite
- 39.91/100
- National rank
- #3852
- State rank
- #87 of 301 in IN
Livability — Indianapolis city (balance)
No livability data for this city. (Only ~50 U.S. cities are tracked.)
Census & demographics
- Census place
- Indianapolis city (balance), IN
- County
- Marion County · 998,460 people
- City population
- 881,119
- Metro
- Indianapolis-Carmel-Anderson, IN
- Population (ZIP)
- 33,931
- Household income
- $100,331
- Rent vs Own
- Severe rent burden
- 567.0
Population outlook (Marion County) Hauer SSP2
- Today (2025)
- 1,025,572 people
- By 2030
- 1,065,727 · +3.9%
- By 2040
- 1,141,577 · +11.3%
- By 2050
- 1,208,920 · +17.9%
- By 2075
- 1,367,288 · +33.3%
- By 2100
- 1,438,201 · +40.2%
Race, ethnicity, and origin ACS 2023
- Neighborhood character
- Diverse neighborhood (Simpson 0.61)
- Race & ethnicity
- White 57% Black 24% Hispanic / Latino 9% Two or more races 9% Asian 4%
- Hispanic origin (detail)
- Mexican 6%
- Common ancestry
- Lithuanian 2% Slovak 2% Romanian 1%
- Foreign-born
- 7% · Canada, Philippines, China
- Languages at home
- 89% English-only · Spanish 6% Other Indo-European 2% Chinese 1%
Political lean MEDSL · Marion
- 2024 margin
- Strong D (+27.7) · D 63.0% · R 35.3% · Other 1.7%
- 2008→2024 swing
- -0.7pp no change · 2008: 28.4pp · 2024: 27.7pp
- All cycles
- 2024: D+27.7 2020: D+29.1 2016: D+22.8 2012: D+22.2 2008: D+28.4
Not yet ingested
- Civics
- —
Market trends
- HPI YoY
- ▼ -93.15%
- Current HPI
- 226.1965
- Rent YoY
- ▲ 6.11%
- Metro
- Indianapolis-Carmel-Anderson, IN
- State GDP YoY
- ▲ 2.90%
- F500 in state
- 18
Industry mix (Fortune 500 HQ in IN)
| Industry | F500 HQs | Revenue |
|---|---|---|
| Industrial Machinery | 2 | $37B |
|
||
| Healthcare | 1 | $177B |
|
||
| Pharmaceuticals | 1 | $45B |
|
||
| Metals / Steel | 1 | $18B |
|
||
| Agriculture | 1 | $17B |
|
||
| Packaging | 1 | $12B |
|
||
Price history
+69.0% since first listed18 events — show timeline
- 2026-06-15 Price Changed $290,000 MIBOR as Distributed by MLS Grid
- 2026-06-15 Relisted — MIBOR as Distributed by MLS Grid
- 2026-03-11 Relisted — MIBOR as Distributed by MLS Grid
- 2026-03-11 Listing Removed — MIBOR as Distributed by MLS Grid
- 2026-01-25 Pending — MIBOR as Distributed by MLS Grid
- 2026-01-23 Listing Removed — MIBOR as Distributed by MLS Grid
- 2026-01-22 Price Changed $276,000 MIBOR as Distributed by MLS Grid
- 2025-10-31 Price Changed $298,000 MIBOR as Distributed by MLS Grid
- 2025-10-09 Price Changed $315,000 MIBOR as Distributed by MLS Grid
- 2025-08-21 Listed $318,000 MIBOR as Distributed by MLS Grid
- 2020-07-17 Sold (MLS) $239,000 MIBOR as Distributed by MLS Grid
- 2020-06-10 Pending — MIBOR as Distributed by MLS Grid
- 2020-05-29 Price Changed $239,900 MIBOR as Distributed by MLS Grid
- 2020-05-08 Price Changed $245,000 MIBOR as Distributed by MLS Grid
- 2020-05-02 Listed $250,000 MIBOR as Distributed by MLS Grid
- 2013-10-28 Listing Removed — MIBOR as Distributed by MLS Grid
- 2013-10-18 Sold (MLS) $163,000 MIBOR as Distributed by MLS Grid
- 2013-07-25 Listed $171,575 MIBOR as Distributed by MLS Grid
Property tax history
+73.0%/yrLatest (2025): $2,878 · -5.3% YoY. Source: county tax records.
Cash-flow waterfall
monthlySold comps — $/sqft
last 12 mo · ≤1 miLoading sold comps…