 🏗️ New Construction
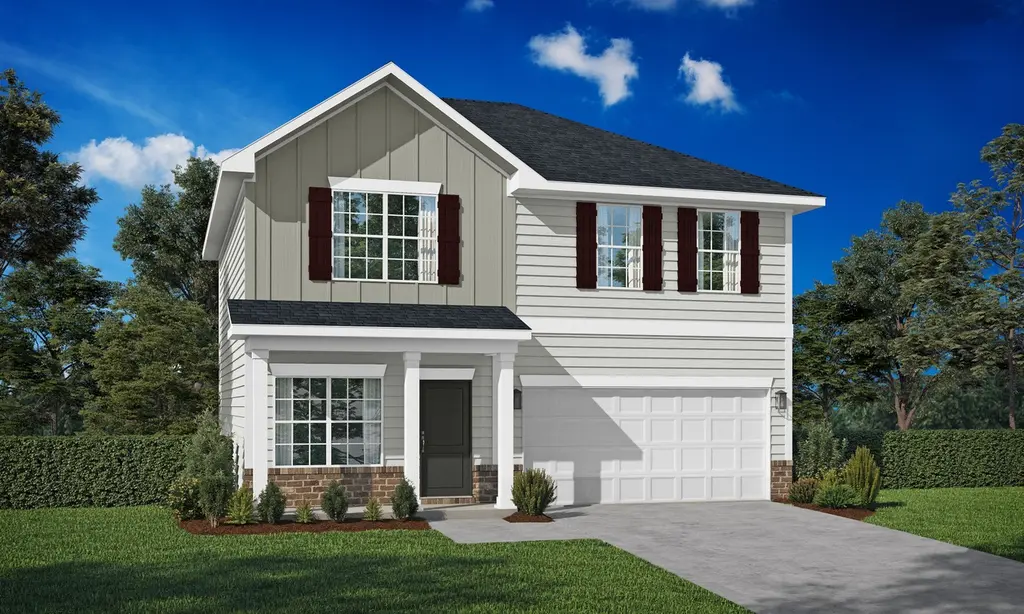
Anderson Plan · Ludowici, GA
Flood risk 9/10 · Severe
- FEMA flood zone
- A
- Chance of flooding over 30 yrs
- 0.99%
- Est. flood insurance / yr
- $1,009 – $1,996
Fire risk 6/10 · Moderate
- Est. fire insurance / yr
- $963 – $1,789
Heat risk 8/10 · Major
- Hot days now (above 109°F)
- 7 days/yr
- Hot days in 30 yrs
- 18 days/yr
Wind risk 8/10 · Major
- Chance of severe wind over 30 yrs
- 98.0%
Air-quality risk 2/10 · Minimal
- Unhealthy air days now
- 2 days/yr
- Unhealthy air days in 30 yrs
- 2 days/yr
Risk factors via First Street. Map © Google.
Why this score? — see what drove the D- grade
The composite is a weighted blend of 9 inputs, each scored 0–100. Each bar is that input's sub-score; the figure is the points it added to the 100-point composite (weight × sub-score).
- Cash flow +7.7/30.0
- ARV discount +7.5/15.0
- Appreciation +5.6/10.0
- Condition / age +5.0/5.0
- Livability +3.6/5.0
- 1% rule +2.5/10.0
- Rent growth +2.5/5.0
- Schools +2.3/10.0
- DSCR +1.8/10.0
$269,900
🖨 Deal sheet (PDF) 📄 Offer letter ✓ Due diligence
Listing remarks MLS
Experience the Anderson Plan in our brand-new Doctor's Creek community. Step into the foyer and discover the versatile flex room - ideal for an office or game room. Moving through a short corridor, you'll find a welcoming kitchen with a corner pantry and a bar area for extra seating. The family room is seamlessly connected to the kitchen, catering to modern family living. Upstairs, the primary suite boasts a spacious bedroom, while the en-suite steals the spotlight with dual vanities, a garden tub, separate shower, private toilet room, and a generous walk-in closet. Three additional bedrooms share a hall bath, and for added convenience, the laundry room is located on the upper level. Artistic renderings are for illustrative purposes only, and actual floor plans, features, and inclusions may vary.
Key facts
- Corner pantry
- Private toilet room
- 2 parking spots
Tags
Neighborhood map
What this means for you Summary
Snapshot
- This is a 4-bed/2.5-bath single-family listed at $270k. Condition is rated excellent.
Deal economics
- At list price, monthly cash flow is $-471 ($-6k/yr) — negative.
- To cash-flow at today's rent, offer at most $232k (14.2% below list).
- To meet the 1% rule (rent ≥ 1% of price), the offer needs to be $223k (17.3% below list).
- Recommended offer: $223k (17.3% below list) — sets the bar for 1% rule.
Location & tenants
- Location reads 72/100 on livability (#74 in GA) — a middle-class / working-renter tenant base. Strengths: cost of living A+, health & safety A+, crime A; Watch: employment D, amenities F, commute F.
- Long County (rural): math 26% / reading 26% proficiency, ranked #115 of 174 in GA (top 66%) — low school quality limits family demand, transient renter base, plan for 1-2y turnover; 61% free/reduced lunch — lower-income household profile, screen leases tightly.
- Zoned schools: Smiley Elementary School (1,258 students, 67% FRL); Long County Middle School (math 21% / reading 27%, grade F, #311 of 470 statewide, top 68%, 945 students, 69% FRL); Long County High School (math 37% / reading 22%, grade F, #140 of 424 statewide, top 35%, 1,209 students, 70% FRL).
- Market conditions: 412 active listings in the ZIP; 1 comparable units currently listed for rent nearby; 298 units permitted in Long County in 2024 (0 in 5+ unit buildings).
- This rent runs 36% of the median local income ($75k/yr) — at the standard rent-burdened threshold; future hikes will face affordability resistance.
Forward outlook
- In year one you build about $6k of equity ($2k loan paydown + $3k appreciation (1.2% local appreciation)).
- Long County population projected at +72% by 2050 — long-run rental-demand tailwind backs the buy-and-hold thesis.
- By year 6, paydown + projected appreciation supports a ~$31k cash-out refi (75% LTV) — recoverable capital for the next deal without selling this one.
Negotiation context
- It's been on market 664 days — a 12% lower offer ($238k) is reasonable based on typical stale-listing flexibility.
Risks & watch-outs
- Watch-outs: flood insurance adds $125/mo.
- Climate carrying-cost: in FEMA flood zone A (mandatory federal flood insurance); severe wind risk, 98% chance of damaging wind over 30y; major wildfire risk; extreme-heat days projected 7→18/yr by 2055 (HVAC capex compounding) — expect insurance premiums to compound above CPI over the hold.
Questions for the listing agent
- What do current leases actually rent for vs. the listed asking? Can we see a recent rent roll and the last 12 months of T-12 income?
- It's been on market 664 days. Have you received any prior offers? Is the seller open to a 17% concession, seller financing, or rate buy-down credit?
- What's the actual annual flood-insurance premium (NFIP or private), and is the property in a SFHA with mandatory coverage?
- What does the HOA fee cover, when was the last increase, and are there any pending special assessments or reserve-fund shortfalls?
- Why hasn't it sold? Are there any deal-killer items the seller is aware of (foundation, flood, title, zoning, code violations)?
- Is there a deadline driving the sale (1031 exchange, divorce, estate, relocation)? That informs how much negotiation room exists.
- Schools are D-rated, which usually means shorter tenancies and higher turnover. Who's the typical renter profile here, and what's been the actual vacancy rate?
- The area grade is low — what's the realistic commute time and amenity access for the typical tenant pool here? Any planned neighborhood developments (good or bad) we should know about?
- What's the average days-on-market for RENTAL listings here right now (not sales)? A rising rental-DOM trend means longer vacancies and softer asking-rent achievability than the comps imply.
- What's the recent tenant-quality profile in this submarket — average credit score on applications, eviction rate, late-payment / NSF rate, and stable-employment percentage? A property-management company in the area should have these aggregated.
- How much new for-sale + rental construction is in the pipeline within 1–3 miles? Heavy new supply typically softens prices + rents 12–24 months out; constrained supply supports both.
Investment metrics
- 1% rule
- 0.75% ✗
- Cap rate
- 4.91%
- Cash-on-cash
- -4.95%
- DSCR
- 0.78
- GRM
- 11.2
CMA / ARV
- ARV (median comp)
- $299,697
- List price
- $269,900
- Delta
- -9.94%
- Verdict
- FAIR
- Comps
- 20 within 1.0 mi
Show comp detail 12 sales within ~0.75 mi
| Address | Dist | Beds/Ba | Sqft | Sold | Price | $/sf | Match |
|---|---|---|---|---|---|---|---|
| 77 Doctor's Creek Rd NE | 0.66mi | 4/2.5 | 1,810 (0%) | 10mo | $285,425 | $158 | 61 |
| 453 Lanier Rd NE | 0.69mi | 4/2.0 | 1,926 (+6%) | 9mo | $304,425 | $158 | 48 |
| 55 Pintail Ct NE | 0.63mi | 4/2.0 | 1,620 (-10%) | 8mo | $276,625 | $171 | 44 |
| 68 Pintail Ct NE | 0.60mi | 4/2.5 | 2,065 (+14%) | 7mo | $308,925 | $150 | 43 |
| 136 Doctor's Creek Rd NE | 0.65mi | 4/2.5 | 2,002 (+11%) | 11mo | $298,275 | $149 | 43 |
| 76 Doctor's Creek Rd NE | 0.64mi | 4/2.0 | 1,620 (-10%) | 11mo | $298,170 | $184 | 42 |
| 439 Lanier Rd NE | 0.69mi | 4/2.0 | 1,620 (-10%) | 11mo | $279,525 | $173 | 39 |
| 95 Doctor's Creek Rd NE | 0.67mi | 4/2.5 | 2,065 (+14%) | 9mo | $294,375 | $143 | 38 |
| 14 Pintail Ct NE | 0.66mi | 4/2.5 | 2,065 (+14%) | 9mo | $293,425 | $142 | 38 |
| 58 Doctor's Creek Rd NE | 0.64mi | 4/2.0 | 1,565 (-14%) | 10mo | $292,025 | $187 | 38 |
| 117 Doctor's Creek Rd NE | 0.67mi | 4/2.0 | 1,565 (-14%) | 8mo | $274,995 | $176 | 37 |
| 34 Pintail Ct NE | 0.64mi | 4/2.0 | 1,565 (-14%) | 11mo | $300,095 | $192 | 36 |
Match score weights: distance 35% · size 25% · config 20% · recency 20%. Top-matched comps best support the ARV.
Projected returns pro-forma
1.16% appreciation · 3.0% rent growth · sell at horizon
- IRR
- -5.1%
- Equity multiple
- 0.74×
- Total profit
- $-21,938
- Equity at exit
- $104,791
- IRR
- 0.2%
- Equity multiple
- 1.02×
- Total profit
- $1,972
- Equity at exit
- $141,196
Cash invested: $83,915 (down + closing). Projections, not guarantees.
Landlord ↔ Tenant lean methodology
- Overall (STATE)
- 90 Strongly Landlord-Friendly
- State Georgia
- 90 Strongly Landlord-Friendly · R+3
- County
- — inherits STATE
- City
- — inherits STATE
ZIP-level market 31316
- Home prices YoY
- 0.6%
- Active inventory
- 412
- Price-to-rent
- 10.1×
Monthly cashflow live
- Estimated rent
- $2,233 medium interval (Pro) →
- Mortgage (P&I)
- −$1,572
- Tax est. 1.5%
- −$375 /mo · $4,495/yr
- Insurance
- −$125
- Flood insurance flood zone
- −$125 /mo · $1,502/yr
- HOA
- −$39
- Vacancy / Maint / Mgmt
- −$469
- Net cashflow
- $-471
Break-even live
Sensitivity live
| Price | -10% $-264 | -5% $-368 | +0% $-471 | +5% $-575 | +10% $-678 |
|---|---|---|---|---|---|
| Rent | -10% $-648 | -5% $-559 | +0% $-471 | +5% $-383 | +10% $-295 |
| Rate | -1.0pp $-320 | -0.5pp $-395 | base $-471 | +0.5pp $-549 | +1.0pp $-628 |
UW: 25.0% down · 7.5% · 30yr · 1.5% tax · 5.0% vac · 8.0% maint · 8.0% mgmt
Financing live
Cash to close
- Down payment
- $74,924
- Closing costs
- $8,991
- Reserves months
- —
- Total cash needed
- —
Loan-product check · same deal, 3 products live
Conventional
25% down · 7.5% · 30yr
- Down + closing
- —
- Monthly P&I
- —
- Monthly cashflow
- —
- DSCR
- —
- Eligible?
- —
Personal DTI + credit; lowest rate.
DSCR
20% down · 8.5% · 30yr
- Down + closing
- —
- Monthly P&I
- —
- Monthly cashflow
- —
- DSCR
- —
- Eligible?
- —
No personal income docs; deal must DSCR.
Hard money
10% down · 12.0% · 12mo
- Down + closing
- —
- Monthly P&I
- —
- Monthly cashflow
- —
- DSCR
- —
- Eligible?
- —
Short-term bridge; refi at stabilization.
Rent comps 1 comps
| Address | Beds | Baths | Sqft | Rent | $/sqft | DOM | Units | Dist |
|---|---|---|---|---|---|---|---|---|
| 59 Forest St NE Ludowici, GA | 4.0 | 2.0 | 1800 | $1,900 | $1.06 | 45d | 1 | 1.28mi |
HOA detail
- Monthly dues
- $39 · $468/yr
Listing history 19 events
-
2026-06-21days on market $269,900 Active 664 DOM
-
2026-06-19days on market $269,900 Active 662 DOM
-
2026-06-18days on market $269,900 Active 661 DOM
-
2026-06-17days on market $269,900 Active 660 DOM
-
2026-06-16days on market $269,900 Active 659 DOM
-
2026-06-15days on market $269,900 Active 658 DOM
-
2026-06-14days on market $269,900 Active 656 DOM
-
2026-06-13days on market $269,900 Active 655 DOM
-
2026-06-10days on market $269,900 Active 653 DOM
-
2026-06-09days on market $269,900 Active 652 DOM
-
2026-06-08days on market $269,900 Active 651 DOM
-
2026-06-07days on market $269,900 Active 650 DOM
-
2026-06-05days on market $269,900 Active 647 DOM
-
2026-06-03days on market $269,900 Active 646 DOM
-
2026-06-02days on market $269,900 Active 645 DOM
-
2026-06-01days on market $269,900 Active 644 DOM
-
2026-05-31days on market $269,900 Active 643 DOM
-
2026-05-30days on market $269,900 Active 642 DOM
-
2024-08-26$269,900 Active 807-char remark
Show marketing remark (807 chars)
Experience the Anderson Plan in our brand-new Doctor's Creek community. Step into the foyer and discover the versatile flex room - ideal for an office or game room. Moving through a short corridor, you'll find a welcoming kitchen with a corner pantry and a bar area for extra seating. The family room is seamlessly connected to the kitchen, catering to modern family living. Upstairs, the primary suite boasts a spacious bedroom, while the en-suite steals the spotlight with dual vanities, a garden tub, separate shower, private toilet room, and a generous walk-in closet. Three additional bedrooms share a hall bath, and for added convenience, the laundry room is located on the upper level. Artistic renderings are for illustrative purposes only, and actual floor plans, features, and inclusions may vary.
ⓘ Source: listings_history table (triggers on properties + properties_extension) + one-shot
backfill from property_details.listing_events for pre-trigger history.
Climate risk First Street
- Flood 9/10 Extreme FEMA zone A · 99% chance over 30 yrs
- Wildfire 6/10 Major
- Heat 8/10 Severe 7 d/yr ≥109°F today · 18 d/yr by 30 yrs out
- Wind 8/10 Severe 98% chance of damaging wind over 30 yrs
- Air quality 2/10 Low 2 unhealthy d/yr today · 2 by 30 yrs out
Nearby sold comps map
Loading sold comps map…
Walkable amenities ~0.75 mi
Loading nearby amenities…
Taxation est. · year 1
- Rental income
- $26,798
- − Mortgage interest
- −$16,788
- − Property taxes
- −$4,495
- − Insurance
- −$3,001
- − Repairs & maintenance
- −$2,144
- − Management
- −$2,144
- − HOA
- −$468
- − Depreciation
- −$8,718
- Taxable loss
- −$10,960
- Est. tax savings @ 24.0%
- +$2,630
- After-tax cash flow
- $-3,023/yr
For passive investors: Depreciation is non-cash, so a rental often shows a tax loss while cash-flowing — sheltering income. Rental losses are passive: they offset passive income freely, and up to $25,000/yr can offset ordinary (W-2) income if you actively participate and your MAGI is under $100k (phasing out to $0 by $150k); unused losses carry forward. On sale, claimed depreciation is recaptured at up to 25%, and gains may owe capital-gains tax (a 1031 exchange can defer both). Figures are a year-1 estimate at your 24.0% rate — not tax advice; consult a CPA.
Condition & rehab AI · 1 photo
This single-family home in Ludowici, GA, is in excellent condition with no visible repairs needed. It offers a modern kitchen, spacious bedrooms, and a well-maintained exterior. Upgrades in painting, landscaping, and smart home features can further enhance its value for both resale and rental.
Value-add opportunities
- Both Painting the exterior and interior walls — Fresh paint enhances curb appeal and interior aesthetics.
- Both Landscaping improvements — Enhanced landscaping can increase both resale and rental value.
- Resale Upgrading the kitchen appliances — Modern appliances can attract more buyers and renters.
- Both Adding smart home features — Smart home features can increase both resale and rental value by making the home more attractive and convenient.
Renovation cost estimate screening
Value-add ROI direction
- Both Painting the exterior and interior walls — Fresh paint enhances curb appeal and interior aesthetics. ↑
- Both Landscaping improvements — Enhanced landscaping can increase both resale and rental value. ↑
- Resale Upgrading the kitchen appliances — Modern appliances can attract more buyers and renters. ↑
- Both Adding smart home features — Smart home features can increase both resale and rental value by making the home more attractive and convenient. ↑
ⓘ Cost ranges are severity-bucket heuristics (US national rule-of-thumb). Get contractor quotes + a written scope before underwriting a rehab budget.
Schools (NCES district)
- District
- Long County
- NCES district ID
- 1303360
- Math proficiency
- 26% ▼ -14.00%
- Reading proficiency
- 26% ▼ -13.00%
- Median HH income
- $45,958
- Composite
- 22.51/100
- National rank
- #8090
- State rank
- #115 of 174 in GA
Livability — Ludowici
- Score
- 72/100
- State rank
- #74
- US rank
- #6449
Category grades
Schools grade is shown separately in the Schools card above.
Census & demographics
- County
- Long County · 13,812 people
- City population
- 13,812
- Metro
- Hinesville, GA
- Population (ZIP)
- 13,812
- Household income
- $74,766
- Rent vs Own
- Severe rent burden
- 109.0
Population outlook (Long County) Hauer SSP2
- Today (2025)
- 24,669 people
- By 2030
- 28,223 · +14.4%
- By 2040
- 35,430 · +43.6%
- By 2050
- 42,403 · +71.9%
- By 2075
- 56,996 · +131.0%
- By 2100
- 64,185 · +160.2%
Race, ethnicity, and origin ACS 2023
- Neighborhood character
- Diverse neighborhood (Simpson 0.56)
- Race & ethnicity
- White 61% Black 23% Hispanic / Latino 8% Two or more races 8%
- Hispanic origin (detail)
- Mexican 2% Puerto Rican 5%
- Common ancestry
- Serbian 1% Italian 1% Romanian 1%
- Foreign-born
- 3% · Canada
- Languages at home
- 92% English-only · Spanish 6% Other Asian/Pacific 1% German/W. Germanic 1%
Political lean MEDSL · Long
- 2024 margin
- Strong R (+29.5) · D 35.1% · R 64.6%
- 2008→2024 swing
- -5.4pp toward R · 2008: -24.1pp · 2024: -29.5pp
- All cycles
- 2024: R+29.5 2020: R+26.4 2016: R+30.8 2012: R+22.9 2008: R+24.1
Not yet ingested
- Civics
- —
Market trends
- HPI YoY
- ▲ 1.16%
- Current HPI
- 195.2978
- Rent YoY
- —
- Metro
- Hinesville, GA
- State GDP YoY
- ▲ 2.66%
- F500 in state
- 28
Industry mix (Fortune 500 HQ in GA)
| Industry | F500 HQs | Revenue |
|---|---|---|
| Paper / Packaging | 2 | $29B |
|
||
| Retail | 1 | $160B |
|
||
| Transportation / Logistics | 1 | $91B |
|
||
| Airlines | 1 | $62B |
|
||
| Consumer Goods | 1 | $47B |
|
||
| Utilities | 1 | $25B |
|
||
Price history
1 event — show timeline
- 2024-08-26 Listed $269,900 Zillow
Cash-flow waterfall
monthlySold comps — $/sqft
last 12 mo · ≤1 miLoading sold comps…