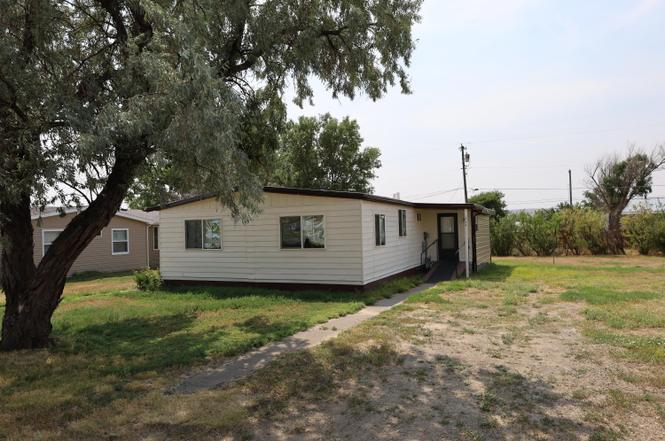
1734 Rich St W · Havre, MT
Flood risk 1/10 · Minimal
- FEMA flood zone
- —
- Chance of flooding over 30 yrs
- 0.0%
- Est. flood insurance / yr
- —
Fire risk 4/10 · Minor
- Est. fire insurance / yr
- $918 – $1,706
Heat risk 2/10 · Minimal
- Hot days now (above 94°F)
- 7 days/yr
- Hot days in 30 yrs
- 13 days/yr
Wind risk 1/10 · Minimal
- Chance of severe wind over 30 yrs
- —
Air-quality risk 5/10 · Moderate
- Unhealthy air days now
- 6 days/yr
- Unhealthy air days in 30 yrs
- 8 days/yr
Risk factors via First Street. Map © Google.
Why this score? — see what drove the D+ grade
The composite is a weighted blend of 9 inputs, each scored 0–100. Each bar is that input's sub-score; the figure is the points it added to the 100-point composite (weight × sub-score).
- Cash flow +18.0/30.0
- ARV discount +7.5/15.0
- DSCR +5.6/10.0
- 1% rule +4.0/10.0
- Schools +3.8/10.0
- Livability +3.6/5.0
- Rent growth +2.5/5.0
- Condition / age +2.5/5.0
- Appreciation +0.0/10.0
$150,000
🖨 Deal sheet (PDF) 📄 Offer letter ✓ Due diligence
Key facts
- Fresh paint
- Updated flooring
- City sewer and water
Tags
Property features AI
Exterior
- Utilities: Public water; Public sewer
- Home design: Manufactured home (Residential); Single level
- Construction: Metal siding
- Exterior features: Metal roof; Accessible entrance
Interior
- Flooring: Hardwood
- Bathrooms: 2 full bathrooms
- Heating & cooling: Central air conditioning; Forced air heating
- Interior features: Hardwood floors; 10 total rooms
Neighborhood map
What this means for you Summary
Snapshot
- This is a 3-bed/1.0-bath manufactured listed at $150k.
Deal economics
- At list price, monthly cash flow is $128 ($2k/yr) — positive.
- The deal already cash-flows at list — no discount required.
- To meet the 1% rule (rent ≥ 1% of price), the offer needs to be $134k (10.4% below list).
- Recommended offer: $132k (12.0% below list) — sets the bar for market timing.
Location & tenants
- Location reads 71/100 on livability (#62 in MT) — a middle-class / working-renter tenant base. Strengths: cost of living A+, housing A+, health & safety A+; Watch: amenities D, employment D, crime F.
- Havre H S (town): math 35% / reading 50% proficiency, ranked #125 of 339 in MT (top 37%) — families likely to look elsewhere, expect single-tenant / working-renter base with shorter leases.
- Zoned schools: Havre Middle School (math 34% / reading 46%, grade F, #59 of 146 statewide, top 41%, 388 students, 0% FRL); Havre High School (math 27% / reading 37%, grade F, #57 of 132 statewide, top 45%, 531 students, 0% FRL).
- Market conditions: 117 active listings in the ZIP; 1 units permitted in Hill County in 2024 (0 in 5+ unit buildings).
- This rent runs 31% of the median local income ($52k/yr) — at the standard rent-burdened threshold; future hikes will face affordability resistance.
Forward outlook
- Local home prices are declining (-3.0%/yr); year-one equity from $1k of loan paydown is wiped out by about $4k of value loss. Plan a longer hold.
Negotiation context
- It's been on market 529 days — a 12% lower offer ($132k) is reasonable based on typical stale-listing flexibility.
- 5 sale attempts since 2y ago with the ask held roughly flat each time — persistent listings suggest the price (not the market) is what's stuck; bring a comps-based counter.
Questions for the listing agent
- It's been on market 529 days. Have you received any prior offers? Is the seller open to a 12% concession, seller financing, or rate buy-down credit?
- Built in 1964 — when were the roof, HVAC, electrical panel, plumbing, and water heater last replaced?
- Why hasn't it sold? Are there any deal-killer items the seller is aware of (foundation, flood, title, zoning, code violations)?
- Is there a deadline driving the sale (1031 exchange, divorce, estate, relocation)? That informs how much negotiation room exists.
- Crime grade is F in this area — have there been break-ins, vandalism, or insurance claims at this property in the last 3 years? What carrier currently insures it and at what premium?
- The area grade is low — what's the realistic commute time and amenity access for the typical tenant pool here? Any planned neighborhood developments (good or bad) we should know about?
- What's the average days-on-market for RENTAL listings here right now (not sales)? A rising rental-DOM trend means longer vacancies and softer asking-rent achievability than the comps imply.
- What's the recent tenant-quality profile in this submarket — average credit score on applications, eviction rate, late-payment / NSF rate, and stable-employment percentage? A property-management company in the area should have these aggregated.
- How much new for-sale + rental construction is in the pipeline within 1–3 miles? Heavy new supply typically softens prices + rents 12–24 months out; constrained supply supports both.
Investment metrics
- 1% rule
- 0.90% ✗
- Cap rate
- 7.32%
- Cash-on-cash
- 3.66%
- DSCR
- 1.16
- GRM
- 9.3
CMA / ARV
No comps found within radius.
Projected returns pro-forma
-3.0% appreciation · 3.0% rent growth · sell at horizon
- IRR
- -10.6%
- Equity multiple
- 0.61×
- Total profit
- $-16,196
- Equity at exit
- $22,365
- IRR
- -1.3%
- Equity multiple
- 0.91×
- Total profit
- $-3,778
- Equity at exit
- $12,969
Cash invested: $42,000 (down + closing). Projections, not guarantees.
Landlord ↔ Tenant lean methodology
- Overall (STATE)
- 82 Strongly Landlord-Friendly
- State Montana
- 82 Strongly Landlord-Friendly · R+11
- County
- — inherits STATE
- City
- — inherits STATE
ZIP-level market 59501
- Active inventory
- 117
- Price-to-rent
- 9.3×
Monthly cashflow live
- Estimated rent
- $1,344 medium interval (Pro) →
- Mortgage (P&I)
- −$787
- Tax from tax record
- −$85 /mo · $1,019/yr
- Insurance
- −$62
- HOA
- −$0
- Vacancy / Maint / Mgmt
- −$282
- Net cashflow
- $128
Break-even live
Sensitivity live
| Price | -10% $213 | -5% $170 | +0% $128 | +5% $86 | +10% $43 |
|---|---|---|---|---|---|
| Rent | -10% $22 | -5% $75 | +0% $128 | +5% $181 | +10% $234 |
| Rate | -1.0pp $204 | -0.5pp $166 | base $128 | +0.5pp $89 | +1.0pp $50 |
UW: 25.0% down · 7.5% · 30yr · 1.5% tax · 5.0% vac · 8.0% maint · 8.0% mgmt
Financing live
Cash to close
- Down payment
- $37,500
- Closing costs
- $4,500
- Reserves months
- —
- Total cash needed
- —
Loan-product check · same deal, 3 products live
Conventional
25% down · 7.5% · 30yr
- Down + closing
- —
- Monthly P&I
- —
- Monthly cashflow
- —
- DSCR
- —
- Eligible?
- —
Personal DTI + credit; lowest rate.
DSCR
20% down · 8.5% · 30yr
- Down + closing
- —
- Monthly P&I
- —
- Monthly cashflow
- —
- DSCR
- —
- Eligible?
- —
No personal income docs; deal must DSCR.
Hard money
10% down · 12.0% · 12mo
- Down + closing
- —
- Monthly P&I
- —
- Monthly cashflow
- —
- DSCR
- —
- Eligible?
- —
Short-term bridge; refi at stabilization.
Listing history 24 events
-
2026-06-21days on market $150,000 Active 529 DOM
-
2026-06-18days on market $150,000 Active 526 DOM
-
2026-06-17days on market $150,000 Active 525 DOM
-
2026-06-16days on market $150,000 Active 524 DOM
-
2026-06-15days on market $150,000 Active 523 DOM
-
2026-06-14days on market $150,000 Active 521 DOM
-
2026-06-13days on market $150,000 Active 520 DOM
-
2026-06-10days on market $150,000 Active 518 DOM
-
2026-06-09days on market $150,000 Active 517 DOM
-
2026-06-08days on market $150,000 Active 516 DOM
-
2026-06-07days on market $150,000 Active 515 DOM
-
2026-06-05days on market $150,000 Active 512 DOM
-
2026-06-03days on market $150,000 Active 511 DOM
-
2026-06-02days on market $150,000 Active 510 DOM
-
2026-06-01days on market $150,000 Active 509 DOM
-
2026-05-31days on market $150,000 Active 508 DOM
-
2026-05-31days on market $150,000 Active 507 DOM
-
2025-10-30status Active
-
2025-09-17status Active
-
2025-06-03status Active
-
2024-10-30$150,000 Active
-
2024-08-03$150,000 Active
-
1998-04-15soldstatus
-
1991-03-14soldstatus
ⓘ Source: listings_history table (triggers on properties + properties_extension) + one-shot
backfill from property_details.listing_events for pre-trigger history.
Tax reassessment forecast MT · Resets to sale price
- Current annual tax
- $1,019 · $85/mo
- Projected year-2 tax
- $1,260 · $105/mo
- Expected delta
- +$241/yr (+$20/mo · 23.7%)
ⓘ Screening estimate from a state-policy table — verify with the county assessor before closing.
Climate risk First Street
- Flood 1/10 Low 0% chance over 30 yrs
- Wildfire 4/10 Moderate
- Heat 2/10 Low 7 d/yr ≥94°F today · 13 d/yr by 30 yrs out
- Wind 1/10 Low
- Air quality 5/10 Major 6 unhealthy d/yr today · 8 by 30 yrs out
Nearby sold comps map
Loading sold comps map…
Walkable amenities ~0.75 mi
Loading nearby amenities…
Taxation est. · year 1
- Rental income
- $16,132
- − Mortgage interest
- −$8,402
- − Property taxes
- −$1,019
- − Insurance
- −$750
- − Repairs & maintenance
- −$1,291
- − Management
- −$1,291
- − Depreciation
- −$4,364
- Taxable loss
- −$984
- Est. tax savings @ 24.0%
- +$236
- After-tax cash flow
- $1,772/yr
For passive investors: Depreciation is non-cash, so a rental often shows a tax loss while cash-flowing — sheltering income. Rental losses are passive: they offset passive income freely, and up to $25,000/yr can offset ordinary (W-2) income if you actively participate and your MAGI is under $100k (phasing out to $0 by $150k); unused losses carry forward. On sale, claimed depreciation is recaptured at up to 25%, and gains may owe capital-gains tax (a 1031 exchange can defer both). Figures are a year-1 estimate at your 24.0% rate — not tax advice; consult a CPA.
Schools (NCES district)
- District
- Havre H S
- NCES district ID
- 3013590
- Math proficiency
- 35% ▲ 10.00%
- Reading proficiency
- 50% ▲ 15.00%
- Median HH income
- $44,545
- Composite
- 38.34/100
- National rank
- #8537
- State rank
- #125 of 339 in MT
Livability — Havre
- Score
- 71/100
- State rank
- #62
- US rank
- #6620
Category grades
Schools grade is shown separately in the Schools card above.
Census & demographics
- County
- Hill County · 12,243 people
- City population
- 12,243
- Metro
- nan
- Population (ZIP)
- 12,243
- Household income
- $51,872
- Rent vs Own
- Severe rent burden
- 309.0
Population outlook (Hill County) Hauer SSP2
- Today (2025)
- 16,841 people
- By 2030
- 16,954 · +0.7%
- By 2040
- 17,063 · +1.3%
- By 2050
- 17,130 · +1.7%
- By 2075
- 17,273 · +2.6%
- By 2100
- 16,542 · -1.8%
Race, ethnicity, and origin ACS 2023
- Neighborhood character
- Predominantly White (79%)
- Race & ethnicity
- White 79% Native American 10% Two or more races 7% Hispanic / Latino 3%
- Common ancestry
- Portuguese 11% Italian 6% Scottish 3%
- Foreign-born
- 1% · Canada
- Languages at home
- 98% English-only · Spanish 1%
Political lean MEDSL · Hill
- 2024 margin
- R (+18.2) · D 38.7% · R 56.9% · Other 4.4%
- 2008→2024 swing
- -30.4pp toward R · 2008: 12.2pp · 2024: -18.2pp
- All cycles
- 2024: R+18.2 2020: R+13.6 2016: R+17.3 2012: D+3.5 2008: D+12.2
Not yet ingested
- Civics
- —
Market trends
- HPI YoY
- ▼ -121.86%
- Current HPI
- 209.1198
- Rent YoY
- —
- Metro
- nan
- State GDP YoY
- ▲ 3.41%
- F500 in state
- 2
Industry mix (Fortune 500 HQ in MT)
| Industry | F500 HQs | Revenue |
|---|---|---|
| Technology / Analytics | 1 | $2B |
|
||
Price history
+0.0% since first listed7 events — show timeline
- 2025-10-30 Relisted — HHLMLS
- 2025-09-17 Relisted — HHLMLS
- 2025-06-03 Relisted — HHLMLS
- 2024-10-30 Listed $150,000 HHLMLS
- 2024-08-03 Listed $150,000 HHLMLS
- 1998-04-15 Sold (Public Records) — Public Records
- 1991-03-14 Sold (Public Records) — Public Records
Property tax history
+1.9%/yrLatest (2025): $1,019 · -4.0% YoY. Source: county tax records.
Cash-flow waterfall
monthlySold comps — $/sqft
last 12 mo · ≤1 miLoading sold comps…