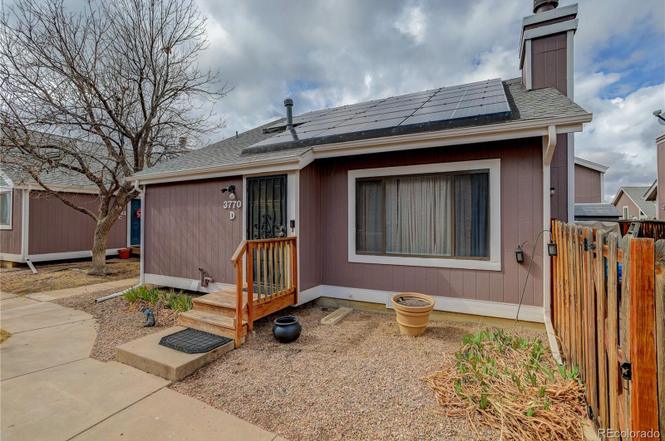
3770 S Genoa Cir Unit D · Aurora, CO
Flood risk 1/10 · Minimal
- FEMA flood zone
- X (unshaded)
- Chance of flooding over 30 yrs
- 0.0%
- Est. flood insurance / yr
- $473 – $860
Fire risk 4/10 · Minor
- Est. fire insurance / yr
- $939 – $1,743
Heat risk 3/10 · Minor
- Hot days now (above 91°F)
- 7 days/yr
- Hot days in 30 yrs
- 18 days/yr
Wind risk 2/10 · Minimal
- Chance of severe wind over 30 yrs
- —
Air-quality risk 2/10 · Minimal
- Unhealthy air days now
- 0 days/yr
- Unhealthy air days in 30 yrs
- 2 days/yr
Risk factors via First Street. Map © Google.
Why this score? — see what drove the D+ grade
The composite is a weighted blend of 9 inputs, each scored 0–100. Each bar is that input's sub-score; the figure is the points it added to the 100-point composite (weight × sub-score).
- ARV discount +15.0/15.0
- Cash flow +12.1/30.0
- Schools +4.4/10.0
- DSCR +3.6/10.0
- Livability +3.6/5.0
- Rent growth +3.4/5.0
- 1% rule +3.2/10.0
- Condition / age +2.5/5.0
- Appreciation +0.0/10.0
$350,000
🖨 Deal sheet 📄 Offer letter ✓ Due diligence
Listing remarks MLS
Welcome to this Hampden Hills home! This 4 bedroom, 2 bathroom home features an ideal layout with high ceilings, an open concept main level with a fireplace, two bedrooms and a jack-and-jill bathroom on the upper level and two bedrooms and a full bathroom on the lower level. The home has been well kept and maintained with upgraded granite counter tops and upgraded flooring. You'll get to enjoy your own private outdoor space off the back deck and the included solar panels greatly reduce monthly utility bills. The Seller has experienced NO power bills during the summer months, making the solar panels a great investment! With Hampden just a half a mile away, you'll love how close you are to schools, restaurants and shops. Schedule your tour asap!
Key facts
- Close to schools
- Upgraded flooring
- $231 HOA
Tags
Property features AI
Finance
- HOA & community: Part of Hampden Hills at Aurora homeowners association (professionally managed); Monthly HOA dues collect reserves, insurance, grounds maintenance, snow removal, and trash; Association amenities include park and parking; Pets allowed (cats and dogs)
Exterior
- Parking: 1 parking space
- Utilities: Electricity connected (110V); Natural gas connected; Public sewer; Cable available; Wired internet available; Phone service available
- Home design: Residential townhouse; Tri-level layout; Ground-level entry; Southeast facing; Individually owned
- Construction: Frame construction; Slab foundation; Shingle roof
- Exterior features: Deck; Public-maintained paved road frontage; Public water
Interior
- Kitchen: Dishwasher; Disposal; Microwave; Oven; Range; Refrigerator; Granite countertops
- Bedrooms: 4 bedrooms total — 2 on the upper level (including a primary suite) and 2 on the lower level (one noted as guest bedroom and one as 4th bedroom/bonus room)
- Flooring: Carpet; Vinyl
- Bathrooms: 2 full bathrooms — 1 on the upper level (Jack & Jill, primary suite) and 1 on the lower level (en suite for primary suite / lower level access)
- Heating & cooling: Baseboard heating; Evaporative cooling
- Interior features: Granite counters; High ceilings; Jack & Jill bathroom; Fireplace in the living room
- Laundry & utility: Washer and dryer included; In-unit laundry (laundry closet on the lower level)
Neighborhood map
What this means for you Summary
Snapshot
- This is a 4-bed/2.0-bath single-family listed at $350k.
Deal economics
- At list price, monthly cash flow is $-74 ($-892/yr) — negative.
- To cash-flow at today's rent, offer at most $337k (3.8% below list).
- To meet the 1% rule (rent ≥ 1% of price), the offer needs to be $287k (18.1% below list).
- Recommended offer: $287k (18.1% below list) — sets the bar for 1% rule.
- Cap rate 6.0% vs local median 3.3% in Aurora — top-decile yield for the area; either an underpriced asset or a hidden risk that comps aren't pricing in. Stress-test before assuming the spread holds.
Location & tenants
- Location reads 72/100 on livability (#70 in CO) — a middle-class / working-renter tenant base. Strengths: commute A+, housing A+, employment A-; Watch: crime F, cost of living F.
- Cherry Creek School District No. 5 In The County Of Arapah (urban): math 40% / reading 58% proficiency, ranked #11 of 86 in CO (top 13%) — families likely to look elsewhere, expect single-tenant / working-renter base with shorter leases.
- Zoned schools: Sunrise Elementary School (math 10% / reading 22%, grade F, #781 of 966 statewide, top 82%, 494 students, 57% FRL); Horizon Middle School (math 8% / reading 42%, grade F, #167 of 270 statewide, top 62%, 812 students, 58% FRL); Eaglecrest High School (math 34% / reading 60%, grade D-, #132 of 381 statewide, top 36%, 3,093 students, 30% FRL) — zoned schools average 48% FRL vs 21% district-wide (27 pts higher); higher-poverty schools than district average — tighter screening recommended.
- Zoned-school proficiency averages 29% at this address vs 49% district-wide (-20 pts) — the specific schools serving this property underperform the Cherry Creek School District No. 5 In The County Of Arapah average; the district grade overstates school quality for this exact location.
- Market conditions: Rents rising (+3.6%/yr); 117 active listings in the ZIP; 14 comparable units currently listed for rent nearby; rentals at typical pace (median 15d on market — plan ~3-4 weeks tenant-placement turnaround); solid renter incomes; 3,927 units permitted in Arapahoe County in 2024 (1,525 in 5+ unit buildings).
- This rent runs 34% of the median local income ($101k/yr) — at the standard rent-burdened threshold; future hikes will face affordability resistance.
Forward outlook
- Local home prices are declining (-3.0%/yr); year-one equity from $2k of loan paydown is wiped out by about $10k of value loss. Plan a longer hold.
- Arapahoe County population projected at +39% by 2050 — long-run rental-demand tailwind backs the buy-and-hold thesis.
Negotiation context
- It's been on market 103 days — a 9% lower offer ($318k) is reasonable based on typical stale-listing flexibility.
- 2 sale attempts with the ask held roughly flat each time — persistent listings suggest the price (not the market) is what's stuck; bring a comps-based counter.
- Current owner paid $96k; list at $350k implies a 265% gain — meaningful room to come down on a strong offer.
Questions for the listing agent
- What do current leases actually rent for vs. the listed asking? Can we see a recent rent roll and the last 12 months of T-12 income?
- It's been on market 103 days. Have you received any prior offers? Is the seller open to a 18% concession, seller financing, or rate buy-down credit?
- What does the HOA fee cover, when was the last increase, and are there any pending special assessments or reserve-fund shortfalls?
- Why hasn't it sold? Are there any deal-killer items the seller is aware of (foundation, flood, title, zoning, code violations)?
- Is there a deadline driving the sale (1031 exchange, divorce, estate, relocation)? That informs how much negotiation room exists.
- Schools are D-rated, which usually means shorter tenancies and higher turnover. Who's the typical renter profile here, and what's been the actual vacancy rate?
- Crime grade is F in this area — have there been break-ins, vandalism, or insurance claims at this property in the last 3 years? What carrier currently insures it and at what premium?
- The area grade is low — what's the realistic commute time and amenity access for the typical tenant pool here? Any planned neighborhood developments (good or bad) we should know about?
- What's the average days-on-market for RENTAL listings here right now (not sales)? A rising rental-DOM trend means longer vacancies and softer asking-rent achievability than the comps imply.
- What's the recent tenant-quality profile in this submarket — average credit score on applications, eviction rate, late-payment / NSF rate, and stable-employment percentage? A property-management company in the area should have these aggregated.
- How much new for-sale + rental construction is in the pipeline within 1–3 miles? Heavy new supply typically softens prices + rents 12–24 months out; constrained supply supports both.
Investment metrics
- 1% rule
- 0.82% ✗
- Cap rate
- 6.04%
- Cash-on-cash
- -0.91%
- DSCR
- 0.96
- GRM
- 10.2
CMA / ARV
- ARV (on-the-fly)
- $451,447
- Comps found
- 12
Show comp detail 12 sales within ~0.75 mi
| Address | Dist | Beds/Ba | Sqft | Sold | Price | $/sf | Match |
|---|---|---|---|---|---|---|---|
| 20468 E Milan Pl | 0.44mi | 3/2.0 (-1) | 1,310 (+1%) | 2mo | $456,000 | $348 | 72 |
| 4152 S Dunkirk Way | 0.47mi | 3/2.0 (-1) | 1,276 (-2%) | 2mo | $430,000 | $337 | 68 |
| 3570 S Jebel Cir | 0.56mi | 3/2.0 (-1) | 1,310 (+1%) | 1mo | $460,000 | $351 | 67 |
| 4219 S Halifax Ct | 0.46mi | 3/2.0 (-1) | 1,256 (-4%) | 4mo | $435,000 | $346 | 65 |
| 4231 S Gibralter St | 0.50mi | 3/2.0 (-1) | 1,256 (-4%) | 1mo | $415,000 | $330 | 65 |
| 3840 S Genoa Ct Unit B | 0.09mi | 4/3.0 | 1,489 (+14%) | 4mo | $355,000 | $238 | 64 |
| 3629 S Killarney St | 0.57mi | 3/2.0 (-1) | 1,284 (-1%) | 4mo | $460,000 | $358 | 63 |
| 20484 E Hampden Pl | 0.61mi | 3/2.0 (-1) | 1,310 (+1%) | 4mo | $454,900 | $347 | 62 |
| 18977 E Napa Dr | 0.50mi | 4/2.0 | 1,200 (-8%) | 4mo | $450,000 | $375 | 61 |
| 4206 S Halifax Way | 0.41mi | 3/1.0 (-1) | 1,192 (-8%) | 3mo | $405,000 | $340 | 56 |
| 4252 S Ireland Ct | 0.65mi | 3/3.0 (-1) | 1,279 (-2%) | 5mo | $460,000 | $360 | 54 |
| 18947 E Mercer Dr | 0.41mi | 3/2.0 (-1) | 1,466 (+13%) | 3mo | $455,000 | $310 | 52 |
Match score weights: distance 35% · size 25% · config 20% · recency 20%. Top-matched comps best support the ARV.
Projected returns pro-forma
-3.0% appreciation · 3.6% rent growth · sell at horizon
- IRR
- -17.2%
- Equity multiple
- 0.39×
- Total profit
- $-59,714
- Equity at exit
- $52,186
- IRR
- -8.1%
- Equity multiple
- 0.48×
- Total profit
- $-50,881
- Equity at exit
- $30,262
Cash invested: $98,000 (down + closing). Projections, not guarantees.
Landlord ↔ Tenant lean methodology
- Overall (STATE)
- 38 Tenant-Leaning
- State Colorado
- 38 Tenant-Leaning · D+4
- County
- — inherits STATE
- City
- — inherits STATE
ZIP-level market 80013
- Rents YoY
- 3.6%
- Active inventory
- 117
- Price-to-rent
- 10.2×
Monthly cashflow live
- Estimated rent
- $2,868 high interval (Pro) →
- Mortgage (P&I)
- −$1,835
- Tax from tax record
- −$128 /mo · $1,535/yr
- Insurance
- −$146
- HOA
- −$231
- Vacancy / Maint / Mgmt
- −$602
- Net cashflow
- $-74
Break-even live
UW: 25.0% down · 7.5% · 30yr · 1.5% tax · 5.0% vac · 8.0% maint · 8.0% mgmt
Financing live
Cash to close
- Down payment
- $87,500
- Closing costs
- $10,500
- Reserves months
- —
- Total cash needed
- —
Loan-product check · same deal, 3 products live
Conventional
25% down · 7.5% · 30yr
- Down + closing
- —
- Monthly P&I
- —
- Monthly cashflow
- —
- DSCR
- —
- Eligible?
- —
Personal DTI + credit; lowest rate.
DSCR
20% down · 8.5% · 30yr
- Down + closing
- —
- Monthly P&I
- —
- Monthly cashflow
- —
- DSCR
- —
- Eligible?
- —
No personal income docs; deal must DSCR.
Hard money
10% down · 12.0% · 12mo
- Down + closing
- —
- Monthly P&I
- —
- Monthly cashflow
- —
- DSCR
- —
- Eligible?
- —
Short-term bridge; refi at stabilization.
Rent comps 14 comps
| Address | Beds | Baths | Sqft | Rent | $/sqft | DOM | Units | Dist |
|---|---|---|---|---|---|---|---|---|
| 18901 E Kent Cir Aurora, CO | 4.0 | 2.0 | 1792 | $2,990 | $1.67 | 24d | 1 | 0.52mi |
| 19598 E Purdue Pl Aurora, CO | 4.0 | 2.0 | 1576 | $2,750 | $1.74 | 24d | 1 | 0.53mi |
| 3824 S Kirk Way Aurora, CO | 3.0 | 2.5 | 1469 | $3,000 | $2.04 | 5d | 1 | 0.55mi |
| 4275 S Halifax Way Aurora, CO | 3.0 | 2.0 | 1675 | $2,800 | $1.67 | 18d | 1 | 0.56mi |
| 19332 E Purdue Cir Aurora, CO | 4.0 | 2.0 | 1675 | $2,895 | $1.73 | 24d | 1 | 0.56mi |
| 4240 S Ireland St Unit Labs Aurora, CO | 3.0 | 2.0 | 1279 | $2,500 | $1.95 | 15d | 1 | 0.59mi |
| 3699 S Lisbon Ct Aurora, CO | 3.0–4.0 | 2.5–4.0 | 2068 | $3,148 | $1.52 | 2d | 3 | 0.74mi |
| 3382 S Biscay Way Aurora, CO | 2.0–3.0 | 2.5 | 1269 | $2,995 | $2.36 | 2d | 4 | 0.77mi |
| 21093 E Quincy Pl Aurora, CO | 3.0 | 3.5 | 1720 | $2,900 | $1.69 | 24d | 1 | 1.05mi |
| 19732 E Bates Dr Aurora, CO | 3.0 | 2.0 | 1824 | $3,100 | $1.70 | 3d | 1 | 1.14mi |
| 4717 S Ceylon St Aurora, CO | 3.0 | 2.0 | 1640 | $1,699 | $1.04 | 5d | 1 | 1.23mi |
| 4343 S Picadilly St Aurora, CO | 1.0–3.0 | 1.0–2.0 | 982 | $2,569 | $2.62 | 3d | 24 | 1.32mi |
| 19584 E Linvale Dr Aurora, CO | 3.0 | 2.0 | 1300 | $2,500 | $1.92 | 16d | 1 | 1.38mi |
| 20152 E Grand Pl Aurora, CO | 4.0 | 2.5 | 1654 | $2,960 | $1.79 | 15d | 1 | 1.50mi |
HOA detail
- Monthly dues
- $231 · $2,772/yr
Listing history 24 events
-
2026-06-18days on market $350,000 Active 103 DOM
-
2026-06-18price $350,000 Active 102 DOM
-
2026-06-17days on market $357,000 Active 102 DOM
-
2026-06-16days on market $357,000 Active 101 DOM
-
2026-06-15days on market $357,000 Active 100 DOM
-
2026-06-13days on market $357,000 Active 98 DOM
-
2026-06-13days on market $357,000 Active 97 DOM
-
2026-06-10days on market $357,000 Active 94 DOM
-
2026-06-08days on market $357,000 Active 93 DOM
-
2026-06-07days on market $357,000 Active 92 DOM
-
2026-06-04days on market $357,000 Active 89 DOM
-
2026-06-03days on market $357,000 Active 88 DOM
-
2026-06-02days on market $357,000 Active 87 DOM
-
2026-06-01days on market $357,000 Active 86 DOM
-
2026-05-31days on market $357,000 Active 85 DOM
-
2026-04-30price $357,000 753-char remark
Show marketing remark (753 chars)
Welcome to this Hampden Hills home! This 4 bedroom, 2 bathroom home features an ideal layout with high ceilings, an open concept main level with a fireplace, two bedrooms and a jack-and-jill bathroom on the upper level and two bedrooms and a full bathroom on the lower level. The home has been well kept and maintained with upgraded granite counter tops and upgraded flooring. You'll get to enjoy your own private outdoor space off the back deck and the included solar panels greatly reduce monthly utility bills. The Seller has experienced NO power bills during the summer months, making the solar panels a great investment! With Hampden just a half a mile away, you'll love how close you are to schools, restaurants and shops. Schedule your tour asap!
-
2026-03-07$360,000 Active 753-char remark
Show marketing remark (753 chars)
Welcome to this Hampden Hills home! This 4 bedroom, 2 bathroom home features an ideal layout with high ceilings, an open concept main level with a fireplace, two bedrooms and a jack-and-jill bathroom on the upper level and two bedrooms and a full bathroom on the lower level. The home has been well kept and maintained with upgraded granite counter tops and upgraded flooring. You'll get to enjoy your own private outdoor space off the back deck and the included solar panels greatly reduce monthly utility bills. The Seller has experienced NO power bills during the summer months, making the solar panels a great investment! With Hampden just a half a mile away, you'll love how close you are to schools, restaurants and shops. Schedule your tour asap!
-
1998-05-18soldstatus $96,000
-
1997-10-01soldstatus $94,000
-
1989-08-10soldstatus $43,000
-
1987-05-29soldstatus $72,822
-
1982-10-01soldstatus $66,200
ⓘ Source: listings_history table (triggers on properties + properties_extension) + one-shot
backfill from property_details.listing_events for pre-trigger history.
Tax reassessment forecast CO · Resets to sale price
- Current annual tax
- $1,535 · $128/mo
- Projected year-2 tax
- $1,925 · $160/mo
- Expected delta
- +$390/yr (+$33/mo · 25.4%)
ⓘ Screening estimate from a state-policy table — verify with the county assessor before closing.
Climate risk First Street
- Flood 1/10 Low FEMA zone X (unshaded) · 0% chance over 30 yrs
- Wildfire 4/10 Moderate
- Heat 3/10 Moderate 7 d/yr ≥91°F today · 18 d/yr by 30 yrs out
- Wind 2/10 Low
- Air quality 2/10 Low 0 unhealthy d/yr today · 2 by 30 yrs out
Nearby sold comps map
Loading sold comps map…
Walkable amenities ~0.75 mi
Loading nearby amenities…
Taxation est. · year 1
- Rental income
- $34,418
- − Mortgage interest
- −$19,605
- − Property taxes
- −$1,535
- − Insurance
- −$1,750
- − Repairs & maintenance
- −$2,753
- − Management
- −$2,753
- − HOA
- −$2,772
- − Depreciation
- −$10,182
- Taxable loss
- −$6,933
- Est. tax savings @ 24.0%
- +$1,664
- After-tax cash flow
- $772/yr
For passive investors: Depreciation is non-cash, so a rental often shows a tax loss while cash-flowing — sheltering income. Rental losses are passive: they offset passive income freely, and up to $25,000/yr can offset ordinary (W-2) income if you actively participate and your MAGI is under $100k (phasing out to $0 by $150k); unused losses carry forward. On sale, claimed depreciation is recaptured at up to 25%, and gains may owe capital-gains tax (a 1031 exchange can defer both). Figures are a year-1 estimate at your 24.0% rate — not tax advice; consult a CPA.
Schools (NCES district)
- District
- Cherry Creek School District No. 5 In The County Of Arapah
- NCES district ID
- 0802910
- Math proficiency
- 40% ▼ -4.00%
- Reading proficiency
- 58% ▲ 5.00%
- Median HH income
- $73,326
- Composite
- 44.12/100
- National rank
- #2866
- State rank
- #11 of 86 in CO
Livability — Aurora
- Score
- 72/100
- State rank
- #70
- US rank
- #6441
Category grades
Schools grade is shown separately in the Schools card above.
Census & demographics
- Census place
- Aurora, CO
- County
- Arapahoe County · 715,018 people
- City population
- 397,430
- Metro
- Denver-Aurora-Lakewood, CO
- Population (ZIP)
- 73,248
- Household income
- $101,191
- Rent vs Own
- Severe rent burden
- 1762.0
Population outlook (Arapahoe County) Hauer SSP2
- Today (2025)
- 757,407 people
- By 2030
- 819,724 · +8.2%
- By 2040
- 940,367 · +24.2%
- By 2050
- 1,053,720 · +39.1%
- By 2075
- 1,297,693 · +71.3%
- By 2100
- 1,412,796 · +86.5%
Race, ethnicity, and origin ACS 2023
- Neighborhood character
- Diverse neighborhood (Simpson 0.68)
- Race & ethnicity
- White 48% Hispanic / Latino 26% Two or more races 14% Black 13% Asian 6%
- Hispanic origin (detail)
- Mexican 19% Puerto Rican 1%
- Common ancestry
- Italian 2% Lithuanian 2% Slovak 2%
- Foreign-born
- 17% · Canada, Vietnam, South Korea
- Languages at home
- 73% English-only · Spanish 15% Russian/Polish/Slavic 2% Vietnamese 2%
Political lean MEDSL · Arapahoe
- 2024 margin
- Strong D (+20.1) · D 58.6% · R 38.5% · Other 2.9%
- 2008→2024 swing
- +7.2pp toward D · 2008: 12.9pp · 2024: 20.1pp
- All cycles
- 2024: D+20.1 2020: D+24.6 2016: D+13.8 2012: D+8.3 2008: D+12.9
Not yet ingested
- Civics
- —
Market trends
- HPI YoY
- ▼ -385.88%
- Current HPI
- 267.4954
- Rent YoY
- ▲ 3.60%
- Metro
- Denver-Aurora-Lakewood, CO
- State GDP YoY
- ▲ 1.95%
- F500 in state
- 14
Industry mix (Fortune 500 HQ in CO)
| Industry | F500 HQs | Revenue |
|---|---|---|
| Technology Distribution | 1 | $31B |
|
||
| Food / Agriculture | 1 | $18B |
|
||
| Packaging | 1 | $14B |
|
||
| Healthcare | 1 | $13B |
|
||
| Energy | 1 | $10B |
|
||
| Technology | 1 | $4B |
|
||
Price history
+439.3% since first listed9 events — show timeline
- 2026-04-30 Price Changed $357,000 IRES
- 2026-04-30 Price Changed $357,000 REColorado as Distributed by MLS Grid
- 2026-03-07 Listed $360,000 REColorado as Distributed by MLS Grid
- 2026-03-07 Listed $360,000 IRES
- 1998-05-18 Sold (Public Records) $96,000 Public Records
- 1997-10-01 Sold (Public Records) $94,000 Public Records
- 1989-08-10 Sold (Public Records) $43,000 Public Records
- 1987-05-29 Sold (Public Records) $72,822 Public Records
- 1982-10-01 Sold (Public Records) $66,200 Public Records
Property tax history
+6.0%/yrLatest (2025): $1,535 · +27.0% YoY. Source: county tax records.
Cash-flow waterfall
monthlySold comps — $/sqft
last 12 mo · ≤1 miLoading sold comps…