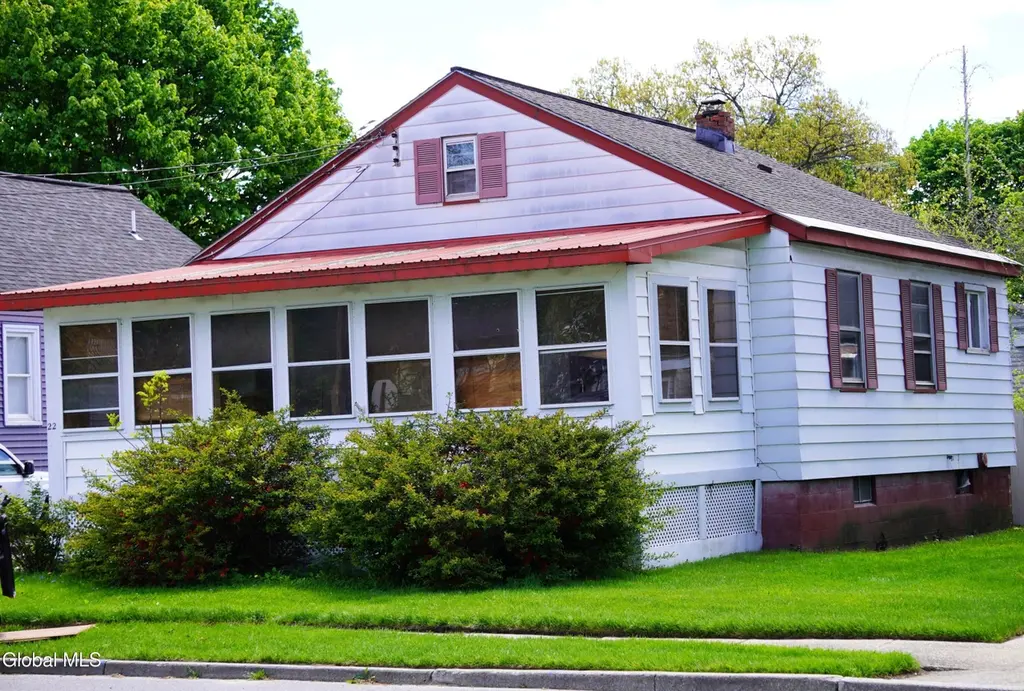
22 3rd Ave · Hudson Falls, NY
Flood risk 1/10 · Minimal
- FEMA flood zone
- —
- Chance of flooding over 30 yrs
- 0.0%
- Est. flood insurance / yr
- —
Fire risk 2/10 · Minimal
- Est. fire insurance / yr
- $691 – $1,283
Heat risk 3/10 · Minor
- Hot days now (above 96°F)
- 7 days/yr
- Hot days in 30 yrs
- 16 days/yr
Wind risk 2/10 · Minimal
- Chance of severe wind over 30 yrs
- 3.0%
Air-quality risk 1/10 · Minimal
- Unhealthy air days now
- 0 days/yr
- Unhealthy air days in 30 yrs
- 0 days/yr
Risk factors via First Street. Map © Google.
Why this score? — see what drove the D+ grade
The composite is a weighted blend of 9 inputs, each scored 0–100. Each bar is that input's sub-score; the figure is the points it added to the 100-point composite (weight × sub-score).
- ARV discount +15.0/15.0
- Appreciation +10.0/10.0
- Cash flow +7.3/30.0
- Schools +3.7/10.0
- Livability +3.5/5.0
- 1% rule +2.9/10.0
- Rent growth +2.5/5.0
- Condition / age +2.5/5.0
- DSCR +1.5/10.0
$164,900
🖨 Deal sheet (PDF) 📄 Offer letter ✓ Due diligence
Listing remarks MLS
Adorable cottage style home with large front enclosed porch, 2 bedrooms 1 full bath, deep lot with lovely back yard ! Great Started home! Why rent when you can own for less.
Key facts
- New stove
- New furnace
- New hot water heater
Tags
Property features AI
Exterior
- Parking: Off-street parking for 2 vehicles
- Utilities: Public water; Public sewer
- Home design: Single family residence
- Construction: Constructed with other materials
- Exterior features: Paved driveway
Interior
- Kitchen: Refrigerator
- Bedrooms: Two bedrooms on the first floor
- Bathrooms: One full bathroom on the first floor
- Heating & cooling: Natural gas heating
- Interior features: 7 total rooms; Full basement
- Laundry & utility: Washer and dryer
Neighborhood map
What this means for you Summary
Snapshot
- This is a 1-bed/1.0-bath single-family listed at $165k.
Deal economics
- At list price, monthly cash flow is $-219 ($-3k/yr) — negative.
- To cash-flow at today's rent, offer at most $126k (23.5% below list).
- To meet the 1% rule (rent ≥ 1% of price), the offer needs to be $130k (21.2% below list).
- Recommended offer: $126k (23.5% below list) — sets the bar for cash-flow.
Location & tenants
- Location reads 69/100 on livability (#481 in NY) — a middle-class / working-renter tenant base. Strengths: housing A+, health & safety A+, cost of living A-; Watch: crime D, employment D, amenities F.
- Hudson Falls Central School District (suburban): math 39% / reading 47% proficiency, ranked #486 of 590 in NY (top 82%) — families likely to look elsewhere, expect single-tenant / working-renter base with shorter leases.
- Zoned schools: Hudson Falls Primary School (math 42% / reading 47%, grade F, #1,277 of 2,108 statewide, top 64%, 429 students, 42% FRL); Hudson Falls Middle School (math 16% / reading 44%, grade F, #539 of 729 statewide, top 74%, 498 students, 39% FRL); Hudson Falls High School (math 87% / reading 77%, grade A, #452 of 1,100 statewide, top 44%, 694 students, 38% FRL) — zoned schools at 40% FRL track the district average.
- Market conditions: 58 active listings in the ZIP; 106 units permitted in Washington County in 2024 (0 in 5+ unit buildings).
Forward outlook
- In year one you build about $18k of equity ($1k loan paydown + $16k appreciation (10.0% local appreciation)).
- Washington County population projected at -20% by 2050 — secular population decline; favor cash flow + early exit over multi-decade hold.
- By year 3, paydown + projected appreciation supports a ~$45k cash-out refi (75% LTV) — recoverable capital for the next deal without selling this one.
Negotiation context
- It's been on market 38 days — a 3% lower offer ($160k) is reasonable based on typical stale-listing flexibility.
- 2 sale attempts since 7y ago; this cycle's ask has dropped $20k (11%) from the opening price — seller is motivated, your offer sets the floor, not the list.
- Current owner paid $85k; list at $165k implies a 94% gain — meaningful room to come down on a strong offer.
Risks & watch-outs
- Watch-outs: built in 1949 — expect roof / HVAC / electrical / plumbing capex.
Questions for the listing agent
- What do current leases actually rent for vs. the listed asking? Can we see a recent rent roll and the last 12 months of T-12 income?
- It's been on market 38 days. Have you received any prior offers? Is the seller open to a 24% concession, seller financing, or rate buy-down credit?
- Built in 1949 — when were the roof, HVAC, electrical panel, plumbing, and water heater last replaced?
- Is there a deadline driving the sale (1031 exchange, divorce, estate, relocation)? That informs how much negotiation room exists.
- Crime grade is D in this area — have there been break-ins, vandalism, or insurance claims at this property in the last 3 years? What carrier currently insures it and at what premium?
- The area grade is low — what's the realistic commute time and amenity access for the typical tenant pool here? Any planned neighborhood developments (good or bad) we should know about?
- What's the average days-on-market for RENTAL listings here right now (not sales)? A rising rental-DOM trend means longer vacancies and softer asking-rent achievability than the comps imply.
- What's the recent tenant-quality profile in this submarket — average credit score on applications, eviction rate, late-payment / NSF rate, and stable-employment percentage? A property-management company in the area should have these aggregated.
- How much new for-sale + rental construction is in the pipeline within 1–3 miles? Heavy new supply typically softens prices + rents 12–24 months out; constrained supply supports both.
Investment metrics
- 1% rule
- 0.79% ✗
- Cap rate
- 4.70%
- Cash-on-cash
- -5.70%
- DSCR
- 0.75
- GRM
- 10.6
CMA / ARV
- ARV (median comp)
- $218,257
- List price
- $164,900
- Delta
- -24.45%
- Verdict
- UNDERPRICED
- Comps
- 20 within 1.0 mi
Show comp detail 5 sales within ~0.75 mi
| Address | Dist | Beds/Ba | Sqft | Sold | Price | $/sf | Match |
|---|---|---|---|---|---|---|---|
| 16 Liberty Pl | 0.37mi | 2/1.5 (+1) | 1,001 (-2%) | 19mo | $137,500 | $137 | 57 |
| 12 Thomas Ave | 0.46mi | 2/1.0 (+1) | 960 (-6%) | 24mo | $230,000 | $240 | 44 |
| 27 William St | 0.58mi | 2/1.5 (+1) | 1,134 (+11%) | 7mo | $215,000 | $190 | 41 |
| 20 Wright St | 0.35mi | 2/1.5 (+1) | 1,155 (+13%) | 17mo | $190,000 | $165 | 40 |
| 35 Coleman Ave | 0.70mi | 2/1.5 (+1) | 1,146 (+12%) | 5mo | $182,000 | $159 | 35 |
Match score weights: distance 35% · size 25% · config 20% · recency 20%. Top-matched comps best support the ARV.
Projected returns pro-forma
10.0% appreciation · 3.0% rent growth · sell at horizon
- IRR
- 20.3%
- Equity multiple
- 2.64×
- Total profit
- $75,916
- Equity at exit
- $148,555
- IRR
- 18.5%
- Equity multiple
- 6.08×
- Total profit
- $234,721
- Equity at exit
- $320,364
Cash invested: $46,172 (down + closing). Projections, not guarantees.
Landlord ↔ Tenant lean methodology
- Overall (STATE)
- 15 Strongly Tenant-Friendly
- State New York
- 15 Strongly Tenant-Friendly · D+10
- County
- — inherits STATE
- City
- — inherits STATE
ZIP-level market 12839
- Home prices YoY
- 8.5%
- Active inventory
- 58
- Price-to-rent
- 10.6×
Monthly cashflow live
- Estimated rent
- $1,299 medium interval (Pro) →
- Mortgage (P&I)
- −$865
- Tax from tax record
- −$312 /mo · $3,749/yr
- Insurance
- −$69
- HOA
- −$0
- Vacancy / Maint / Mgmt
- −$273
- Net cashflow
- $-219
Break-even live
Sensitivity live
| Price | -10% $-126 | -5% $-173 | +0% $-219 | +5% $-266 | +10% $-313 |
|---|---|---|---|---|---|
| Rent | -10% $-322 | -5% $-271 | +0% $-219 | +5% $-168 | +10% $-117 |
| Rate | -1.0pp $-136 | -0.5pp $-178 | base $-219 | +0.5pp $-262 | +1.0pp $-306 |
UW: 25.0% down · 7.5% · 30yr · 1.5% tax · 5.0% vac · 8.0% maint · 8.0% mgmt
Financing live
Cash to close
- Down payment
- $41,225
- Closing costs
- $4,947
- Reserves months
- —
- Total cash needed
- —
Loan-product check · same deal, 3 products live
Conventional
25% down · 7.5% · 30yr
- Down + closing
- —
- Monthly P&I
- —
- Monthly cashflow
- —
- DSCR
- —
- Eligible?
- —
Personal DTI + credit; lowest rate.
DSCR
20% down · 8.5% · 30yr
- Down + closing
- —
- Monthly P&I
- —
- Monthly cashflow
- —
- DSCR
- —
- Eligible?
- —
No personal income docs; deal must DSCR.
Hard money
10% down · 12.0% · 12mo
- Down + closing
- —
- Monthly P&I
- —
- Monthly cashflow
- —
- DSCR
- —
- Eligible?
- —
Short-term bridge; refi at stabilization.
Listing history 19 events
-
2026-06-21days on market $164,900 Active 38 DOM
-
2026-06-18days on market $164,900 Active 35 DOM
-
2026-06-17days on market $164,900 Active 34 DOM
-
2026-06-16days on market $164,900 Active 33 DOM
-
2026-06-15days on market $164,900 Active 32 DOM
-
2026-06-14days on market $164,900 Active 30 DOM
-
2026-06-13days on market $164,900 Active 29 DOM
-
2026-06-10days on market $164,900 Active 27 DOM
-
2026-06-09days on market $164,900 Active 26 DOM
-
2026-06-08days on market $164,900 Active 25 DOM
-
2026-06-07pricedays on market $164,900 Active 24 DOM
-
2026-06-03days on market $184,900 Active 20 DOM
-
2026-06-02days on market $184,900 Active 19 DOM
-
2026-06-01days on market $184,900 Active 18 DOM
-
2026-05-31days on market $184,900 Active 17 DOM
-
2026-05-31days on market $184,900 Active 16 DOM
-
2026-05-14$184,900 Active 231-char remark
-
2020-01-30soldstatus $84,800 Closed (Final Sale) 173-char remark
Show marketing remark (173 chars)
Adorable cottage style home with large front enclosed porch, 2 bedrooms 1 full bath, deep lot with lovely back yard ! Great Started home! Why rent when you can own for less.
-
2019-10-01$84,900 Active 173-char remark
Show marketing remark (173 chars)
Adorable cottage style home with large front enclosed porch, 2 bedrooms 1 full bath, deep lot with lovely back yard ! Great Started home! Why rent when you can own for less.
ⓘ Source: listings_history table (triggers on properties + properties_extension) + one-shot
backfill from property_details.listing_events for pre-trigger history.
Tax reassessment forecast NY · Partial reset (capped growth)
- Current annual tax
- $3,749 · $312/mo
- Projected year-2 tax
- $3,749 · $312/mo
- Expected delta
- $0/yr ($0/mo · 0.0%)
ⓘ Screening estimate from a state-policy table — verify with the county assessor before closing.
Climate risk First Street
- Flood 1/10 Low 0% chance over 30 yrs
- Wildfire 2/10 Low
- Heat 3/10 Moderate 7 d/yr ≥96°F today · 16 d/yr by 30 yrs out
- Wind 2/10 Low 3% chance of damaging wind over 30 yrs
- Air quality 1/10 Low 0 unhealthy d/yr today · 0 by 30 yrs out
Nearby sold comps map
Loading sold comps map…
Walkable amenities ~0.75 mi
Loading nearby amenities…
Taxation est. · year 1
- Rental income
- $15,591
- − Mortgage interest
- −$9,237
- − Property taxes
- −$3,749
- − Insurance
- −$824
- − Repairs & maintenance
- −$1,247
- − Management
- −$1,247
- − Depreciation
- −$4,797
- Taxable loss
- −$5,511
- Est. tax savings @ 24.0%
- +$1,323
- After-tax cash flow
- $-1,311/yr
For passive investors: Depreciation is non-cash, so a rental often shows a tax loss while cash-flowing — sheltering income. Rental losses are passive: they offset passive income freely, and up to $25,000/yr can offset ordinary (W-2) income if you actively participate and your MAGI is under $100k (phasing out to $0 by $150k); unused losses carry forward. On sale, claimed depreciation is recaptured at up to 25%, and gains may owe capital-gains tax (a 1031 exchange can defer both). Figures are a year-1 estimate at your 24.0% rate — not tax advice; consult a CPA.
Schools (NCES district)
- District
- Hudson Falls Central School District
- NCES district ID
- 3614970
- Math proficiency
- 39% ▼ -8.00%
- Reading proficiency
- 47% ▲ 6.00%
- Median HH income
- $46,019
- Composite
- 36.57/100
- National rank
- #4635
- State rank
- #486 of 590 in NY
Livability — Hudson Falls
- Score
- 69/100
- State rank
- #481
- US rank
- #8482
Category grades
Schools grade is shown separately in the Schools card above.
Census & demographics
- Census place
- Hudson Falls, NY
- Population (ZIP)
- 13,618
Population outlook (Washington County) Hauer SSP2
- Today (2025)
- 59,576 people
- By 2030
- 57,618 · -3.3%
- By 2040
- 52,751 · -11.5%
- By 2050
- 47,514 · -20.2%
- By 2075
- 35,690 · -40.1%
- By 2100
- 24,807 · -58.4%
Race, ethnicity, and origin ACS 2023
- Neighborhood character
- Predominantly White (89%)
- Race & ethnicity
- White 89% Hispanic / Latino 4% Two or more races 4%
- Common ancestry
- Lithuanian 8% Slovak 5% Estonian 3%
- Foreign-born
- 5% · Canada, Guatemala
- Languages at home
- 92% English-only · Spanish 4% Other Indo-European 2% German/W. Germanic 2%
Political lean MEDSL · Washington
- 2024 margin
- Strong R (+21.2) · D 39.4% · R 60.6%
- 2008→2024 swing
- -22.0pp toward R · 2008: 0.8pp · 2024: -21.2pp
- All cycles
- 2024: R+21.2 2020: R+15.6 2016: R+20.2 2012: D+1.6 2008: D+0.8
Not yet ingested
- Civics
- —
Market trends
- HPI YoY
- ▲ 25.92%
- Current HPI
- 331.6315
- Rent YoY
- —
- Metro
- —
- State GDP YoY
- ▲ 2.60%
- F500 in state
- 92
Industry mix (Fortune 500 HQ in NY)
| Industry | F500 HQs | Revenue |
|---|---|---|
| Financial Services | 10 | $950B |
|
||
| Consumer Goods | 9 | $162B |
|
||
| Insurance | 4 | $225B |
|
||
| Telecommunications | 2 | $144B |
|
||
| Pharmaceuticals | 2 | $112B |
|
||
| Media / Entertainment | 2 | $69B |
|
||
Price history
+94.2% since first listed4 events — show timeline
- 2026-06-04 Price Changed $164,900 Global MLS
- 2026-05-14 Listed $184,900 Global MLS
- 2020-01-30 Sold (MLS) $84,800 Global MLS
- 2019-10-01 Listed $84,900 Global MLS
Property tax history
+9.1%/yrLatest (2025): $3,749 · +43.5% YoY. Source: county tax records.
Cash-flow waterfall
monthlySold comps — $/sqft
last 12 mo · ≤1 miLoading sold comps…