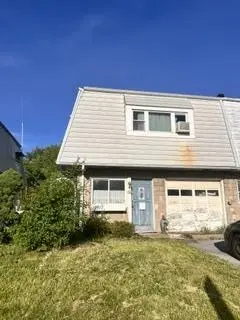
705 N Lacrosse St · Allentown, PA
Flood risk 1/10 · Minimal
- FEMA flood zone
- X (unshaded)
- Chance of flooding over 30 yrs
- 0.0%
- Est. flood insurance / yr
- $507 – $1,088
Fire risk 2/10 · Minimal
- Est. fire insurance / yr
- $511 – $949
Heat risk 5/10 · Moderate
- Hot days now (above 100°F)
- 7 days/yr
- Hot days in 30 yrs
- 15 days/yr
Wind risk 4/10 · Minor
- Chance of severe wind over 30 yrs
- 16.0%
Air-quality risk 4/10 · Minor
- Unhealthy air days now
- 3 days/yr
- Unhealthy air days in 30 yrs
- 6 days/yr
Risk factors via First Street. Map © Google.
Why this score? — see what drove the C- grade
The composite is a weighted blend of 9 inputs, each scored 0–100. Each bar is that input's sub-score; the figure is the points it added to the 100-point composite (weight × sub-score).
- ARV discount +15.0/15.0
- Cash flow +14.5/30.0
- DSCR +4.4/10.0
- 1% rule +4.2/10.0
- Rent growth +4.1/5.0
- Livability +4.0/5.0
- Condition / age +2.5/5.0
- Schools +1.2/10.0
- Appreciation +0.0/10.0
$200,000
🖨 Deal sheet (PDF) 📄 Offer letter ✓ Due diligence
Listing remarks
Investor Alert! Exceptional value-add opportunity in East Allentown. This solid 1954 brick-and-frame end of row townhome offers 1,356 sq. ft. of interior living space, currently configured with 2 bedrooms and 1 bathroom. Featuring an attached 1-car garage, an eat-in kitchen layout, first-floor laundry convenience, and a spacious fenced yard with a rear patio, the property provides an excellent canvas for optimization. The generous floor plan yields strong potential for repositioning or adding a 3rd bedroom to maximize market rent or resale value. Located in the R-M Medium Density Residential zone with easy proximity to local shopping and major transportation routes. Property sold as-is; buy
Key facts
- Spacious fenced yard
- Attached garage
- Generous floor plan
Tags
Property features AI
Exterior
- Parking: Built-in garage with 1 garage space; Driveway parking
- Utilities: Public water; Public sewer
- Home design: Two-story home; Above-grade finished area approximately 1,356
- Construction: Brick construction; Asphalt/fiberglass roof; Slab foundation; Built on a lot of about 3,415 sq ft
- Exterior features: Lot zoned R-M (medium density residential); Lot approximately 0.078 acres
Interior
- Kitchen: Second-floor kitchen (14 x 7)
- Bedrooms: Second-floor bedrooms (two additional second-floor bedroom dimensions: 14 x 11 and 14 x 8)
- Heating & cooling: Baseboard heating; Wall/window air conditioning units
- Interior features: Dining area
- Laundry & utility: Electric water heater
Neighborhood map
What this means for you Summary
Snapshot
- This is a 2-bed/1.0-bath townhouse listed at $200k.
Deal economics
- At list price, monthly cash flow is $45 ($537/yr) — positive.
- The deal already cash-flows at list — no discount required.
- To meet the 1% rule (rent ≥ 1% of price), the offer needs to be $185k (7.7% below list).
- Recommended offer: $185k (7.7% below list) — sets the bar for 1% rule.
- Cap rate 6.6% vs local median 5.3% in Allentown — meaningfully above typical; check what's discounted (condition, days-on-market, listing class) to confirm the premium yield is real.
Location & tenants
- Location reads 81/100 on livability (#171 in PA, #1,440 nationally) — a professional / high-income tenant draw. Strengths: commute A+, cost of living A+, housing A+; Watch: employment D.
- Allentown City SD (urban): math 10% / reading 20% proficiency, ranked #513 of 539 in PA (top 95%) — low school quality limits family demand, transient renter base, plan for 1-2y turnover; 73% free/reduced lunch — lower-income household profile, screen leases tightly.
- Zoned schools: Ritter El Sch (math 8%, 409 students, 100% FRL); Harrison-Morton Ms (math 3% / reading 30%, grade F, #463 of 512 statewide, top 91%, 733 students, 100% FRL); Louis E Dieruff Hs (math 32% / reading 10%, grade F, #385 of 437 statewide, top 88%, 1,915 students, 89% FRL) — zoned schools average 96% FRL vs 73% district-wide (23 pts higher); higher-poverty schools than district average — tighter screening recommended.
- Market conditions: Rents rising fast (+6.6%/yr); 59 active listings in the ZIP; 20 comparable units currently listed for rent nearby; rentals at typical pace (median 16d on market — plan ~3-4 weeks tenant-placement turnaround); 765 units permitted in Lehigh County in 2024 (286 in 5+ unit buildings).
- This rent runs 38% of the median local income ($58k/yr) — at the standard rent-burdened threshold; future hikes will face affordability resistance.
Forward outlook
- Local home prices are declining (-3.0%/yr); year-one equity from $1k of loan paydown is wiped out by about $6k of value loss. Plan a longer hold.
- Lehigh County population projected at +21% by 2050 — long-run rental-demand tailwind backs the buy-and-hold thesis.
Negotiation context
- Only 11 days on market — expect competitive offers; lowballing is unlikely to land.
Risks & watch-outs
- Watch-outs: built in 1954 — expect roof / HVAC / electrical / plumbing capex.
- Climate carrying-cost: extreme-heat days projected 7→15/yr by 2055 (HVAC capex compounding) — expect insurance premiums to compound above CPI over the hold.
Questions for the listing agent
- Built in 1954 — when were the roof, HVAC, electrical panel, plumbing, and water heater last replaced?
- Is there a deadline driving the sale (1031 exchange, divorce, estate, relocation)? That informs how much negotiation room exists.
- Schools are D-rated, which usually means shorter tenancies and higher turnover. Who's the typical renter profile here, and what's been the actual vacancy rate?
- What's the average days-on-market for RENTAL listings here right now (not sales)? A rising rental-DOM trend means longer vacancies and softer asking-rent achievability than the comps imply.
- What's the recent tenant-quality profile in this submarket — average credit score on applications, eviction rate, late-payment / NSF rate, and stable-employment percentage? A property-management company in the area should have these aggregated.
- How much new for-sale + rental construction is in the pipeline within 1–3 miles? Heavy new supply typically softens prices + rents 12–24 months out; constrained supply supports both.
Investment metrics
- 1% rule
- 0.92% ✗
- Cap rate
- 6.56%
- Cash-on-cash
- 0.96%
- DSCR
- 1.04
- GRM
- 9.0
CMA / ARV
- ARV (on-the-fly)
- $246,792
- Comps found
- 12
Show comp detail 12 sales within ~0.75 mi
| Address | Dist | Beds/Ba | Sqft | Sold | Price | $/sf | Match |
|---|---|---|---|---|---|---|---|
| 754 E Green St | 0.46mi | 2/1.0 | 1,356 (0%) | 2mo | $215,000 | $159 | 77 |
| 768 E Green St | 0.42mi | 3/1.0 (+1) | 1,356 (0%) | 3mo | $235,000 | $173 | 72 |
| 735 N Plymouth St | 0.24mi | 3/1.0 (+1) | 1,521 (+12%) | 0mo | $230,000 | $151 | 63 |
| 805 N Oswego St | 0.21mi | 3/3.0 (+1) | 1,440 (+6%) | 5mo | $245,000 | $170 | 63 |
| 752 E Green St | 0.46mi | 3/1.0 (+1) | 1,280 (-6%) | 2mo | $221,650 | $173 | 62 |
| 867 N Polk | 0.38mi | 3/1.5 (+1) | 1,488 (+10%) | 0mo | $290,000 | $195 | 59 |
| 459 N Oswego St | 0.22mi | 3/1.5 (+1) | 1,536 (+13%) | 5mo | $280,000 | $182 | 57 |
| 879 N Halstead St | 0.48mi | 3/1.5 (+1) | 1,480 (+9%) | 2mo | $197,000 | $133 | 54 |
| 1414 E Pennsylvania St | 0.62mi | 3/1.5 (+1) | 1,280 (-6%) | 1mo | $275,000 | $215 | 54 |
| 899 N Graham St | 0.60mi | 3/2.5 (+1) | 1,500 (+11%) | 0mo | $350,000 | $233 | 43 |
| 897 Graham St | 0.61mi | 3/2.5 (+1) | 1,500 (+11%) | 1mo | $350,000 | $233 | 42 |
| 895 Graham St | 0.61mi | 3/2.5 (+1) | 1,500 (+11%) | 4mo | $360,000 | $240 | 40 |
Match score weights: distance 35% · size 25% · config 20% · recency 20%. Top-matched comps best support the ARV.
Projected returns pro-forma
-3.0% appreciation · 6.57% rent growth · sell at horizon
- IRR
- -10.7%
- Equity multiple
- 0.60×
- Total profit
- $-22,644
- Equity at exit
- $29,821
- IRR
- 3.1%
- Equity multiple
- 1.26×
- Total profit
- $14,479
- Equity at exit
- $17,292
Cash invested: $56,000 (down + closing). Projections, not guarantees.
Landlord ↔ Tenant lean methodology
- Overall (STATE)
- 62 Landlord-Friendly
- State Pennsylvania
- 62 Landlord-Friendly · EVEN
- County
- — inherits STATE
- City
- — inherits STATE
ZIP-level market 18109
- Home prices YoY
- -21.9%
- Rents YoY
- 6.6%
- Active inventory
- 59
- Price-to-rent
- 9.0×
Monthly cashflow live
- Estimated rent
- $1,846 high interval (Pro) →
- Mortgage (P&I)
- −$1,049
- Tax from tax record
- −$282 /mo · $3,379/yr
- Insurance
- −$83
- HOA
- −$0
- Vacancy / Maint / Mgmt
- −$388
- Net cashflow
- $45
Break-even live
Sensitivity live
| Price | -10% $158 | -5% $101 | +0% $45 | +5% $-12 | +10% $-68 |
|---|---|---|---|---|---|
| Rent | -10% $-101 | -5% $-28 | +0% $45 | +5% $118 | +10% $191 |
| Rate | -1.0pp $145 | -0.5pp $96 | base $45 | +0.5pp $-7 | +1.0pp $-60 |
UW: 25.0% down · 7.5% · 30yr · 1.5% tax · 5.0% vac · 8.0% maint · 8.0% mgmt
Financing live
Cash to close
- Down payment
- $50,000
- Closing costs
- $6,000
- Reserves months
- —
- Total cash needed
- —
Loan-product check · same deal, 3 products live
Conventional
25% down · 7.5% · 30yr
- Down + closing
- —
- Monthly P&I
- —
- Monthly cashflow
- —
- DSCR
- —
- Eligible?
- —
Personal DTI + credit; lowest rate.
DSCR
20% down · 8.5% · 30yr
- Down + closing
- —
- Monthly P&I
- —
- Monthly cashflow
- —
- DSCR
- —
- Eligible?
- —
No personal income docs; deal must DSCR.
Hard money
10% down · 12.0% · 12mo
- Down + closing
- —
- Monthly P&I
- —
- Monthly cashflow
- —
- DSCR
- —
- Eligible?
- —
Short-term bridge; refi at stabilization.
Rent comps 20 comps
| Address | Beds | Baths | Sqft | Rent | $/sqft | DOM | Units | Dist |
|---|---|---|---|---|---|---|---|---|
| 743 N Halstead St Allentown, PA | 3.0 | 1.0 | 1356 | $1,800 | $1.33 | 4d | 1 | 0.39mi |
| 801-819 N Halstead St Allentown, PA | 2.0 | 2.0 | 995 | $1,795 | $1.80 | 45d | 1 | 0.41mi |
| 801 N Halstead St Allentown, PA | 1.0–2.0 | 1.0–2.0 | 872 | $1,795 | $2.06 | 4d | 1 | 0.41mi |
| 949 E Linden St Allentown, PA | 2.0 | 2.0 | 880 | $1,795 | $2.04 | 16d | 1 | 0.44mi |
| 1939 E Jonathan St Allentown, PA | 3.0 | 2.0 | 1601 | $2,400 | $1.50 | 16d | 1 | 0.97mi |
| 303 E Union St Unit 1st Allentown, PA | 2.0 | 1.0 | 977 | $1,550 | $1.59 | 45d | 1 | 1.03mi |
| 333 River Dr Allentown, PA | 1.0–2.0 | 1.0–2.0 | 869 | $2,025 | $2.33 | 4d | 13 | 1.07mi |
| 2010B Pinehurst Ct Allentown, PA | 1.0–2.0 | 1.0 | 844 | $1,850 | $2.19 | 4d | 6 | 1.16mi |
| 230 E Fairview St Allentown, PA | 3.0 | 2.0 | 1414 | $2,300 | $1.63 | 25d | 1 | 1.18mi |
| 1820 Sherwood St Allentown, PA | 3.0 | 1.5 | 1780 | $2,900 | $1.63 | 16d | 1 | 1.18mi |
| 503 S Austin St Unit 503 A Allentown, PA | 2.0 | 1.0 | 1000 | $1,900 | $1.90 | 16d | 1 | 1.29mi |
| 503 S Austin St Unit 517 A Allentown, PA | 2.0 | 1.0 | 1000 | $1,900 | $1.90 | 16d | 1 | 1.29mi |
| 503 S Austin St Unit 514 Allentown, PA | 2.0 | 1.0 | 1000 | $1,550 | $1.55 | 16d | 1 | 1.31mi |
| 503 S Austin St Unit A Allentown, PA | 2.0 | 1.0 | 1000 | $1,650 | $1.65 | 4d | 1 | 1.31mi |
| 503 S Austin St Unit 524 Allentown, PA | 2.0 | 1.0 | 1000 | $1,750 | $1.75 | 25d | 1 | 1.31mi |
| 503 S Austin St Unit 520 Allentown, PA | 2.0 | 1.0 | 1000 | $1,650 | $1.65 | 16d | 1 | 1.31mi |
| 236 N Front St Allentown, PA | 3.0 | 1.0 | 1020 | $1,800 | $1.76 | 4d | 1 | 1.35mi |
| 132 Chew St Allentown, PA | 3.0 | 1.0 | 1160 | $1,995 | $1.72 | 16d | 1 | 1.39mi |
| 948 N Front St Unit C-2 Allentown, PA | 2.0 | 2.0 | 954 | $2,300 | $2.41 | 4d | 1 | 1.43mi |
| 177 W Tilghman St Allentown, PA | 3.0 | 1.5 | 1800 | $1,650 | $0.92 | 4d | 1 | 1.48mi |
Listing history 10 events
-
2026-06-17status $200,000 Pending 11 DOM
-
2026-06-17days on market $200,000 Active 11 DOM
-
2026-06-16pricedays on market $200,000 Active 10 DOM
-
2026-06-15days on market $215,000 Active 9 DOM
-
2026-06-14days on market $215,000 Active 7 DOM
-
2026-06-10days on market $215,000 Active 4 DOM
-
2026-06-09days on market $215,000 Active 3 DOM
-
2026-06-08days on market $215,000 Active 2 DOM
-
2026-06-07remarks 699-char remark
-
2026-06-07$215,000 Active 1 DOM
ⓘ Source: listings_history table (triggers on properties + properties_extension) + one-shot
backfill from property_details.listing_events for pre-trigger history.
Tax reassessment forecast PA · Partial reset (capped growth)
- Current annual tax
- $3,379 · $282/mo
- Projected year-2 tax
- $3,379 · $282/mo
- Expected delta
- $0/yr ($0/mo · 0.0%)
ⓘ Screening estimate from a state-policy table — verify with the county assessor before closing.
Climate risk First Street
- Flood 1/10 Low FEMA zone X (unshaded) · 0% chance over 30 yrs
- Wildfire 2/10 Low
- Heat 5/10 Major 7 d/yr ≥100°F today · 15 d/yr by 30 yrs out
- Wind 4/10 Moderate 16% chance of damaging wind over 30 yrs
- Air quality 4/10 Moderate 3 unhealthy d/yr today · 6 by 30 yrs out
Nearby sold comps map
Loading sold comps map…
Walkable amenities ~0.75 mi
Loading nearby amenities…
Taxation est. · year 1
- Rental income
- $22,154
- − Mortgage interest
- −$11,203
- − Property taxes
- −$3,379
- − Insurance
- −$1,000
- − Repairs & maintenance
- −$1,772
- − Management
- −$1,772
- − Depreciation
- −$5,818
- Taxable loss
- −$2,791
- Est. tax savings @ 24.0%
- +$670
- After-tax cash flow
- $1,207/yr
For passive investors: Depreciation is non-cash, so a rental often shows a tax loss while cash-flowing — sheltering income. Rental losses are passive: they offset passive income freely, and up to $25,000/yr can offset ordinary (W-2) income if you actively participate and your MAGI is under $100k (phasing out to $0 by $150k); unused losses carry forward. On sale, claimed depreciation is recaptured at up to 25%, and gains may owe capital-gains tax (a 1031 exchange can defer both). Figures are a year-1 estimate at your 24.0% rate — not tax advice; consult a CPA.
Schools (NCES district)
- District
- Allentown City SD
- NCES district ID
- 4202280
- Math proficiency
- 10% ▼ -10.00%
- Reading proficiency
- 20% ▼ -15.00%
- Median HH income
- $36,337
- Composite
- 12.43/100
- National rank
- #9630
- State rank
- #513 of 539 in PA
Livability — Allentown
- Score
- 81/100
- State rank
- #171
- US rank
- #1440
Category grades
Schools grade is shown separately in the Schools card above.
Census & demographics
- Census place
- Allentown, PA
- County
- Lehigh County · 333,019 people
- City population
- 172,996
- Metro
- Allentown-Bethlehem-Easton, PA-NJ
- Population (ZIP)
- 18,446
- Household income
- $58,031
- Rent vs Own
- Severe rent burden
- 898.0
Population outlook (Lehigh County) Hauer SSP2
- Today (2025)
- 392,957 people
- By 2030
- 408,319 · +3.9%
- By 2040
- 440,007 · +12.0%
- By 2050
- 475,940 · +21.1%
- By 2075
- 590,448 · +50.3%
- By 2100
- 690,314 · +75.7%
Race, ethnicity, and origin ACS 2023
- Neighborhood character
- Diverse neighborhood (Simpson 0.59)
- Race & ethnicity
- Hispanic / Latino 55% White 33% Two or more races 15% Black 8% Asian 2%
- Hispanic origin (detail)
- Mexican 1% Puerto Rican 27% Cuban 1% Dominican 18%
- Common ancestry
- Hispanic 2% Romanian 1% Polish 1%
- Foreign-born
- 22% · Canada, Jamaica
- Languages at home
- 53% English-only · Spanish 37% Arabic 6% French/Haitian/Cajun 2%
Political lean MEDSL · Lehigh
- 2024 margin
- Toss-up / Even · D 50.7% · R 48.0% · Other 1.2%
- 2008→2024 swing
- -12.9pp toward R · 2008: 15.6pp · 2024: 2.7pp
- All cycles
- 2024: D+2.7 2020: D+7.6 2016: D+4.4 2012: D+7.5 2008: D+15.6
Not yet ingested
- Civics
- —
Market trends
- HPI YoY
- ▼ -96.00%
- Current HPI
- 342.9027
- Rent YoY
- ▲ 6.57%
- Metro
- Allentown-Bethlehem-Easton, PA-NJ
- State GDP YoY
- ▲ 1.68%
- F500 in state
- 34
Industry mix (Fortune 500 HQ in PA)
| Industry | F500 HQs | Revenue |
|---|---|---|
| Healthcare | 2 | $309B |
|
||
| Insurance | 2 | $27B |
|
||
| Telecommunications / Media | 1 | $124B |
|
||
| Industrial Distribution | 1 | $22B |
|
||
| Financial Services | 1 | $20B |
|
||
| Chemicals / Materials | 1 | $18B |
|
||
Price history
1 event — show timeline
- 2026-06-05 Listed $215,000 GLVRMLS
Property tax history
-1.8%/yrLatest (2026): $3,379 · +0.8% YoY. Source: county tax records.
Cash-flow waterfall
monthlySold comps — $/sqft
last 12 mo · ≤1 miLoading sold comps…