 🔨 Auction
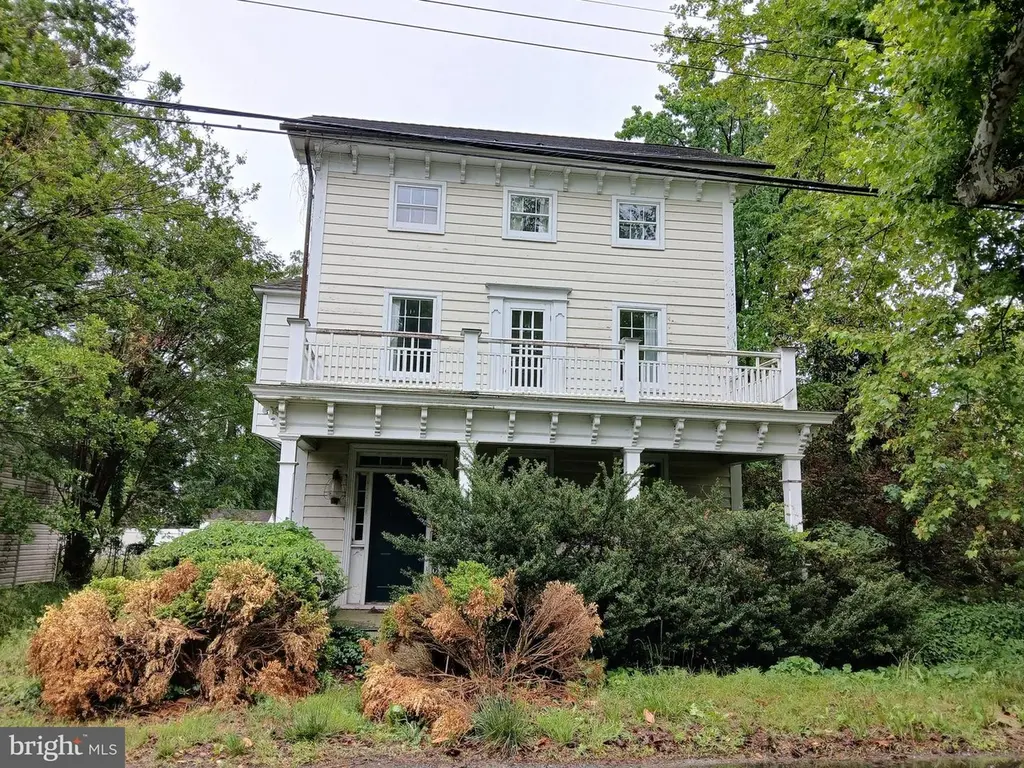
107 2nd St · Crumpton, MD
Flood risk 1/10 · Minimal
- FEMA flood zone
- X (unshaded)
- Chance of flooding over 30 yrs
- 0.0%
- Est. flood insurance / yr
- $507 – $1,088
Fire risk 3/10 · Minor
- Est. fire insurance / yr
- $755 – $1,403
Heat risk 8/10 · Major
- Hot days now (above 104°F)
- 7 days/yr
- Hot days in 30 yrs
- 15 days/yr
Wind risk 6/10 · Moderate
- Chance of severe wind over 30 yrs
- 27.0%
Air-quality risk 2/10 · Minimal
- Unhealthy air days now
- 2 days/yr
- Unhealthy air days in 30 yrs
- 2 days/yr
Risk factors via First Street. Map © Google.
Why this score? — see what drove the F grade
The composite is a weighted blend of 9 inputs, each scored 0–100. Each bar is that input's sub-score; the figure is the points it added to the 100-point composite (weight × sub-score).
- ARV discount +7.5/15.0
- Appreciation +6.2/10.0
- Cash flow +4.3/30.0
- Schools +3.0/10.0
- Rent growth +2.5/5.0
- Livability +2.5/5.0
- Condition / age +2.5/5.0
- 1% rule +0.0/10.0
- DSCR +0.0/10.0
$110,000
🖨 Deal sheet 📄 Offer letter ✓ Due diligence
Listing remarks
ONLINE AUCTION: This auction takes place on the Ashland Auction Group Website Bidding Platform. Bidding begins 06/01/2026 @ 10:00 AM. Bidding ends 06/03/2026 @ 11:20 AM. List Price is Suggested Opening Bid. Deposit: $20,000. 3 Story Townhouse located in the Crumpton area of Queen Anne's County. JUST MINUTES to Chester River. Easy access to major traffic artery Blue Star Memorial Highway.
Key facts
- 3 story townhouse
- 0.3 acre lot
- Built 1910
Tags
Property features AI
Finance
- Financial info: Fee simple ownership
Exterior
- Parking: On-street parking
- Utilities: Other water source; Other power/utility details
- Home design: Detached structure; Shingle siding
- Construction: Other foundation; Above-grade and below-grade other structures
- Exterior features: No tidal water
Interior
- Bedrooms: 3 bedrooms on main level
- Bathrooms: 1 full bathroom; 1 half bathroom
- Heating & cooling: Other heating; Other cooling; Other hot water
- Interior features: No basement; Living area per assessor
Neighborhood map
What this means for you Summary
Snapshot
- This is a 3-bed/1.5-bath single-family listed at $110k.
Deal economics
- At list price, monthly cash flow is $-1k ($-12k/yr) — negative.
- The deal already cash-flows at list — no discount required.
- Meets the 1% rule at list price ($2k rent vs $110k).
- Recommended offer: $108k (1.5% below list) — sets the bar for market timing.
Location & tenants
- Location reads: area grade F — affects rentability + tenant quality, not the cash-flow math above.
- Queen Anne'S County Public Schools (rural): math 22% / reading 39% proficiency, ranked #7 of 24 in MD (top 29%) — families likely to look elsewhere, expect single-tenant / working-renter base with shorter leases.
- Market conditions: 3 active listings in the ZIP; 320 units permitted in Queen Anne's County in 2024 (56 in 5+ unit buildings).
Forward outlook
- In year one you build about $12k of equity ($3k loan paydown + $9k appreciation (2.4% local appreciation)).
- By year 4, paydown + projected appreciation supports a ~$40k cash-out refi (75% LTV) — recoverable capital for the next deal without selling this one.
Negotiation context
- It's been on market 22 days — a 2% lower offer ($108k) is reasonable based on typical stale-listing flexibility.
- Current owner paid $44k; list at $110k implies a 147% gain — meaningful room to come down on a strong offer.
Risks & watch-outs
- Watch-outs: built in 1910 — expect roof / HVAC / electrical / plumbing capex.
- Climate carrying-cost: major wind risk, 27% chance of damaging wind over 30y; extreme-heat days projected 7→15/yr by 2055 (HVAC capex compounding) — expect insurance premiums to compound above CPI over the hold.
Questions for the listing agent
- What do current leases actually rent for vs. the listed asking? Can we see a recent rent roll and the last 12 months of T-12 income?
- Built in 1910 — when were the roof, HVAC, electrical panel, plumbing, and water heater last replaced?
- Is there a deadline driving the sale (1031 exchange, divorce, estate, relocation)? That informs how much negotiation room exists.
- The area grade is low — what's the realistic commute time and amenity access for the typical tenant pool here? Any planned neighborhood developments (good or bad) we should know about?
- What's the average days-on-market for RENTAL listings here right now (not sales)? A rising rental-DOM trend means longer vacancies and softer asking-rent achievability than the comps imply.
- What's the recent tenant-quality profile in this submarket — average credit score on applications, eviction rate, late-payment / NSF rate, and stable-employment percentage? A property-management company in the area should have these aggregated.
- How much new for-sale + rental construction is in the pipeline within 1–3 miles? Heavy new supply typically softens prices + rents 12–24 months out; constrained supply supports both.
Investment metrics
- 1% rule
- 0.44% ✗
- Cap rate
- 3.09%
- Cash-on-cash
- -11.43%
- DSCR
- 0.49
- GRM
- 19.0
CMA / ARV
- ARV (on-the-fly)
- $379,432
- Comps found
- 1
Show comp detail 1 sale within ~0.75 mi
| Address | Dist | Beds/Ba | Sqft | Sold | Price | $/sf | Match |
|---|---|---|---|---|---|---|---|
| 338 Broad St | 0.05mi | 3/3.0 | 2,412 (+9%) | 13mo | $415,000 | $172 | 65 |
Match score weights: distance 35% · size 25% · config 20% · recency 20%. Top-matched comps best support the ARV.
Projected returns pro-forma
2.4% appreciation · 3.0% rent growth · sell at horizon
- IRR
- -5.2%
- Equity multiple
- 0.71×
- Total profit
- $-30,866
- Equity at exit
- $157,850
- IRR
- -0.3%
- Equity multiple
- 0.96×
- Total profit
- $-4,450
- Equity at exit
- $233,775
Cash invested: $106,241 (down + closing). Projections, not guarantees.
Landlord ↔ Tenant lean methodology
- Overall (STATE)
- 27 Tenant-Leaning
- State Maryland
- 27 Tenant-Leaning · D+14
- County
- — inherits STATE
- City
- — inherits STATE
ZIP-level market 21628
- Home prices YoY
- 1.1%
- Active inventory
- 3
- Price-to-rent
- 5.5×
Monthly cashflow live
- Estimated rent
- $1,668 medium interval (Pro) →
- Mortgage (P&I)
- −$1,990
- Tax from tax record
- −$182 /mo · $2,180/yr
- Insurance
- −$158
- HOA
- −$0
- Vacancy / Maint / Mgmt
- −$350
- Net cashflow
- $-1,012
Break-even live
UW: 25.0% down · 7.5% · 30yr · 1.5% tax · 5.0% vac · 8.0% maint · 8.0% mgmt
Financing live
Cash to close
- Down payment
- $94,858
- Closing costs
- $11,383
- Reserves months
- —
- Total cash needed
- —
Loan-product check · same deal, 3 products live
Conventional
25% down · 7.5% · 30yr
- Down + closing
- —
- Monthly P&I
- —
- Monthly cashflow
- —
- DSCR
- —
- Eligible?
- —
Personal DTI + credit; lowest rate.
DSCR
20% down · 8.5% · 30yr
- Down + closing
- —
- Monthly P&I
- —
- Monthly cashflow
- —
- DSCR
- —
- Eligible?
- —
No personal income docs; deal must DSCR.
Hard money
10% down · 12.0% · 12mo
- Down + closing
- —
- Monthly P&I
- —
- Monthly cashflow
- —
- DSCR
- —
- Eligible?
- —
Short-term bridge; refi at stabilization.
Listing history 14 events
-
2026-06-17days on market $110,000 Active 22 DOM
-
2026-06-16days on market $110,000 Active 21 DOM
-
2026-06-15days on market $110,000 Active 20 DOM
-
2026-06-13days on market $110,000 Active 18 DOM
-
2026-06-09days on market $110,000 Active 14 DOM
-
2026-06-08days on market $110,000 Active 13 DOM
-
2026-06-07days on market $110,000 Active 12 DOM
-
2026-06-04days on market $110,000 Active 9 DOM
-
2026-06-03days on market $110,000 Active 8 DOM
-
2026-06-02days on market $110,000 Active 7 DOM
-
2026-06-01days on market $110,000 Active 6 DOM
-
2026-05-31days on market $110,000 Active 5 DOM
-
2026-05-26$110,000 Active
-
1987-06-01soldstatus $44,500
ⓘ Source: listings_history table (triggers on properties + properties_extension) + one-shot
backfill from property_details.listing_events for pre-trigger history.
Tax reassessment forecast MD · Partial reset (capped growth)
- Current annual tax
- $2,180 · $182/mo
- Projected year-2 tax
- $2,180 · $182/mo
- Expected delta
- $0/yr ($0/mo · 0.0%)
ⓘ Screening estimate from a state-policy table — verify with the county assessor before closing.
Climate risk First Street
- Flood 1/10 Low FEMA zone X (unshaded) · 0% chance over 30 yrs
- Wildfire 3/10 Moderate
- Heat 8/10 Severe 7 d/yr ≥104°F today · 15 d/yr by 30 yrs out
- Wind 6/10 Major 27% chance of damaging wind over 30 yrs
- Air quality 2/10 Low 2 unhealthy d/yr today · 2 by 30 yrs out
Nearby sold comps map
Loading sold comps map…
Walkable amenities ~0.75 mi
Loading nearby amenities…
Taxation est. · year 1
- Rental income
- $20,021
- − Mortgage interest
- −$21,254
- − Property taxes
- −$2,180
- − Insurance
- −$1,897
- − Repairs & maintenance
- −$1,602
- − Management
- −$1,602
- − Depreciation
- −$11,038
- Taxable loss
- −$19,552
- Est. tax savings @ 24.0%
- +$4,693
- After-tax cash flow
- $-7,446/yr
For passive investors: Depreciation is non-cash, so a rental often shows a tax loss while cash-flowing — sheltering income. Rental losses are passive: they offset passive income freely, and up to $25,000/yr can offset ordinary (W-2) income if you actively participate and your MAGI is under $100k (phasing out to $0 by $150k); unused losses carry forward. On sale, claimed depreciation is recaptured at up to 25%, and gains may owe capital-gains tax (a 1031 exchange can defer both). Figures are a year-1 estimate at your 24.0% rate — not tax advice; consult a CPA.
Schools (NCES district)
- District
- Queen Anne'S County Public Schools
- NCES district ID
- 2400540
- Math proficiency
- 22% ▼ -30.00%
- Reading proficiency
- 39% ▼ -22.00%
- Median HH income
- $84,577
- Composite
- 29.86/100
- National rank
- #6406
- State rank
- #7 of 24 in MD
Livability — Crumpton
No livability data for this city. (Only ~50 U.S. cities are tracked.)
Census & demographics
- Census place
- Crumpton, MD
- City population
- 299
- Population (ZIP)
- 299
Population outlook (Queen Anne's County) Hauer SSP2
- Today (2025)
- 51,149 people
- By 2030
- 51,979 · +1.6%
- By 2040
- 52,728 · +3.1%
- By 2050
- 51,828 · +1.3%
- By 2075
- 50,169 · -1.9%
- By 2100
- 44,442 · -13.1%
Race, ethnicity, and origin ACS 2023
- Neighborhood character
- Predominantly White (97%)
- Race & ethnicity
- White 97% Two or more races 3%
- Common ancestry
- Romanian 9%
Political lean MEDSL · Queen Anne's
- 2024 margin
- Strong R (+27.8) · D 35.1% · R 62.9% · Other 2.1%
- 2008→2024 swing
- -0.7pp no change · 2008: -27.1pp · 2024: -27.8pp
- All cycles
- 2024: R+27.8 2020: R+26.5 2016: R+36.1 2012: R+30.1 2008: R+27.1
Not yet ingested
- Civics
- —
Market trends
- HPI YoY
- ▲ 2.40%
- Current HPI
- 221.8983
- Rent YoY
- —
- Metro
- —
- State GDP YoY
- ▲ 2.97%
- F500 in state
- 12
Industry mix (Fortune 500 HQ in MD)
| Industry | F500 HQs | Revenue |
|---|---|---|
| Aerospace / Defense | 1 | $71B |
|
||
| Utilities | 1 | $25B |
|
||
| Hotels | 1 | $24B |
|
||
| Consumer Goods | 1 | $7B |
|
||
| Real Estate | 1 | $6B |
|
||
| Chemicals | 1 | $2B |
|
||
Price history
+147.2% since first listed2 events — show timeline
- 2026-05-26 Listed $110,000 BRIGHT MLS
- 1987-06-01 Sold (Public Records) $44,500 Public Records
Property tax history
+2.4%/yrLatest (2024): $2,180 · +11.1% YoY. Source: county tax records.
Cash-flow waterfall
monthlySold comps — $/sqft
last 12 mo · ≤1 miLoading sold comps…