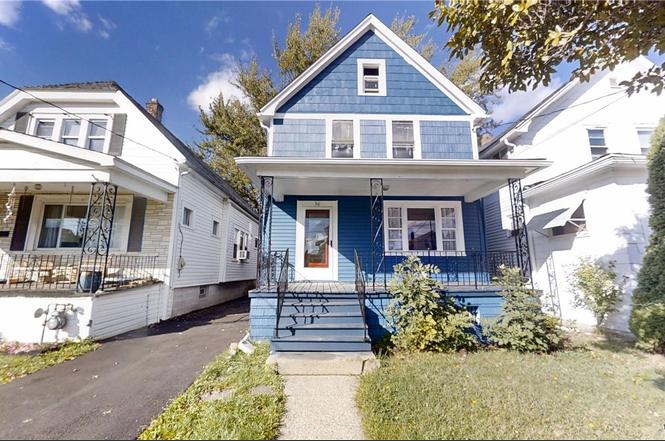
36 Layer Ave · Buffalo, NY
Flood risk 1/10 · Minimal
- FEMA flood zone
- X (unshaded)
- Chance of flooding over 30 yrs
- 0.0%
- Est. flood insurance / yr
- $473 – $860
Fire risk 1/10 · Minimal
- Est. fire insurance / yr
- $691 – $1,283
Heat risk 3/10 · Minor
- Hot days now (above 92°F)
- 7 days/yr
- Hot days in 30 yrs
- 15 days/yr
Wind risk 1/10 · Minimal
- Chance of severe wind over 30 yrs
- —
Air-quality risk 3/10 · Minor
- Unhealthy air days now
- 3 days/yr
- Unhealthy air days in 30 yrs
- 4 days/yr
Risk factors via First Street. Map © Google.
Why this score? — see what drove the D+ grade
The composite is a weighted blend of 9 inputs, each scored 0–100. Each bar is that input's sub-score; the figure is the points it added to the 100-point composite (weight × sub-score).
- Cash flow +14.8/30.0
- ARV discount +9.0/15.0
- DSCR +4.5/10.0
- Rent growth +4.5/5.0
- Livability +3.9/5.0
- Schools +3.3/10.0
- 1% rule +2.8/10.0
- Condition / age +2.5/5.0
- Appreciation +0.0/10.0
$179,000
🖨 Deal sheet (PDF) 📄 Offer letter ✓ Due diligence
Listing remarks
Welcome to 36 Layer Ave a beautifully updated home in Buffalo’s desirable Black Rock neighborhood! Step inside and be greeted by fresh new flooring and paint throughout, creating a bright and inviting atmosphere. The home features new drywalls, and an updated kitchen with refreshed cabinets, offering both style and functionality. Major improvements include a newer roof, new garage roof and siding, and a new driveway, giving you peace of mind and great curb appeal. The living and dining spaces are filled with natural light, making it perfect for everyday living or entertaining guests. Enjoy a covered front porch for relaxing evenings and a private backyard for outdoor gatherings. Conve
Key facts
- Covered front porch
- New garage roof
- Newer roof
Tags
Neighborhood map
What this means for you Summary
Snapshot
- This is a 3-bed/1.0-bath single-family listed at $179k.
Deal economics
- At list price, monthly cash flow is $50 ($603/yr) — positive.
- The deal already cash-flows at list — no discount required.
- To meet the 1% rule (rent ≥ 1% of price), the offer needs to be $140k (21.9% below list).
- Recommended offer: $140k (21.9% below list) — sets the bar for 1% rule.
Location & tenants
- Location reads 77/100 on livability (#195 in NY, #3,011 nationally) — a middle-class / working-renter tenant base. Strengths: commute A+, housing A+, health & safety A+; Watch: crime F, employment D-.
- Buffalo City School District (urban): math 41% / reading 40% proficiency, ranked #535 of 590 in NY (top 91%) — families likely to look elsewhere, expect single-tenant / working-renter base with shorter leases; 75% free/reduced lunch — lower-income household profile, screen leases tightly.
- Zoned schools: International School (math 8% / reading 17%, grade F, #2,048 of 2,108 statewide, top 97%, 981 students, 92% FRL); Hutchinson Central Technical High School (math 96% / reading 32%, grade B-, #807 of 1,100 statewide, top 73%, 1,175 students, 78% FRL).
- Market conditions: Rents rising fast (+8.2%/yr); 199 active listings in the ZIP; 33 comparable units currently listed for rent nearby; rentals at typical pace (median 26d on market — plan ~3-4 weeks tenant-placement turnaround); lower-income renter base — watch delinquency; 1,244 units permitted in Erie County in 2024 (563 in 5+ unit buildings).
- This rent runs 42% of the median local income ($40k/yr) — at the standard rent-burdened threshold; future hikes will face affordability resistance.
Forward outlook
- Local home prices are declining (-3.0%/yr); year-one equity from $1k of loan paydown is wiped out by about $5k of value loss. Plan a longer hold.
Negotiation context
- It's been on market 93 days — a 9% lower offer ($163k) is reasonable based on typical stale-listing flexibility.
- Current owner paid $30k; list at $179k implies a 497% gain — meaningful room to come down on a strong offer.
Risks & watch-outs
- Watch-outs: built in 1927 — expect roof / HVAC / electrical / plumbing capex.
Questions for the listing agent
- It's been on market 93 days. Have you received any prior offers? Is the seller open to a 22% concession, seller financing, or rate buy-down credit?
- Built in 1927 — when were the roof, HVAC, electrical panel, plumbing, and water heater last replaced?
- Why hasn't it sold? Are there any deal-killer items the seller is aware of (foundation, flood, title, zoning, code violations)?
- Is there a deadline driving the sale (1031 exchange, divorce, estate, relocation)? That informs how much negotiation room exists.
- Crime grade is F in this area — have there been break-ins, vandalism, or insurance claims at this property in the last 3 years? What carrier currently insures it and at what premium?
- The area grade is low — what's the realistic commute time and amenity access for the typical tenant pool here? Any planned neighborhood developments (good or bad) we should know about?
- What's the average days-on-market for RENTAL listings here right now (not sales)? A rising rental-DOM trend means longer vacancies and softer asking-rent achievability than the comps imply.
- What's the recent tenant-quality profile in this submarket — average credit score on applications, eviction rate, late-payment / NSF rate, and stable-employment percentage? A property-management company in the area should have these aggregated.
- How much new for-sale + rental construction is in the pipeline within 1–3 miles? Heavy new supply typically softens prices + rents 12–24 months out; constrained supply supports both.
Investment metrics
- 1% rule
- 0.78% ✗
- Cap rate
- 6.63%
- Cash-on-cash
- 1.20%
- DSCR
- 1.05
- GRM
- 10.7
CMA / ARV
- ARV (on-the-fly)
- $185,120
- Comps found
- 12
Show comp detail 12 sales within ~0.75 mi
| Address | Dist | Beds/Ba | Sqft | Sold | Price | $/sf | Match |
|---|---|---|---|---|---|---|---|
| 36 Layer Ave | 0.00mi | 3/1.0 | 1,040 (0%) | 1mo | $185,000 | $178 | 100 |
| 5 Ruhl Ave | 0.09mi | 3/1.0 | 964 (-7%) | 0mo | $234,100 | $243 | 84 |
| 242 Hoover Ave | 0.41mi | 3/1.0 | 1,035 (-0%) | 6mo | $227,500 | $220 | 75 |
| 34 Race St | 0.20mi | 2/1.0 (-1) | 960 (-8%) | 4mo | $158,500 | $165 | 70 |
| 56 Gallatin Ave | 0.69mi | 3/1.5 | 1,052 (+1%) | 2mo | $178,000 | $169 | 62 |
| 212 Hinman Ave | 0.59mi | 4/1.0 (+1) | 1,008 (-3%) | 7mo | $275,000 | $273 | 56 |
| 145 Hoover Ave | 0.49mi | 3/2.0 | 1,143 (+10%) | 2mo | $155,000 | $136 | 55 |
| 446 Victoria Blvd | 0.61mi | 3/1.0 | 1,144 (+10%) | 2mo | $265,000 | $232 | 53 |
| 133 Mayer Ave | 0.60mi | 3/1.0 | 1,134 (+9%) | 6mo | $195,000 | $172 | 52 |
| 268 Riverside Ave | 0.60mi | 3/1.0 | 936 (-10%) | 5mo | $150,000 | $160 | 51 |
| 384 Mang Ave | 0.55mi | 3/1.0 | 1,155 (+11%) | 7mo | $267,000 | $231 | 50 |
| 82 Beatrice Ave | 0.63mi | 3/1.0 | 1,166 (+12%) | 2mo | $165,000 | $142 | 48 |
Match score weights: distance 35% · size 25% · config 20% · recency 20%. Top-matched comps best support the ARV.
Projected returns pro-forma
-3.0% appreciation · 8.0% rent growth · sell at horizon
- IRR
- -9.7%
- Equity multiple
- 0.63×
- Total profit
- $-18,503
- Equity at exit
- $26,689
- IRR
- 4.8%
- Equity multiple
- 1.42×
- Total profit
- $21,287
- Equity at exit
- $15,477
Cash invested: $50,120 (down + closing). Projections, not guarantees.
Landlord ↔ Tenant lean methodology
- Overall (STATE)
- 15 Strongly Tenant-Friendly
- State New York
- 15 Strongly Tenant-Friendly · D+10
- County
- — inherits STATE
- City
- — inherits STATE
ZIP-level market 14207
- Home prices YoY
- -18.9%
- Rents YoY
- 8.2%
- Active inventory
- 199
- Price-to-rent
- 10.7×
Monthly cashflow live
- Estimated rent
- $1,399 high interval (Pro) →
- Mortgage (P&I)
- −$939
- Tax from tax record
- −$42 /mo · $499/yr
- Insurance
- −$75
- HOA
- −$0
- Vacancy / Maint / Mgmt
- −$294
- Net cashflow
- $50
Break-even live
Sensitivity live
| Price | -10% $152 | -5% $101 | +0% $50 | +5% $0 | +10% $-51 |
|---|---|---|---|---|---|
| Rent | -10% $-60 | -5% $-5 | +0% $50 | +5% $106 | +10% $161 |
| Rate | -1.0pp $140 | -0.5pp $96 | base $50 | +0.5pp $4 | +1.0pp $-43 |
UW: 25.0% down · 7.5% · 30yr · 1.5% tax · 5.0% vac · 8.0% maint · 8.0% mgmt
Financing live
Cash to close
- Down payment
- $44,750
- Closing costs
- $5,370
- Reserves months
- —
- Total cash needed
- —
Loan-product check · same deal, 3 products live
Conventional
25% down · 7.5% · 30yr
- Down + closing
- —
- Monthly P&I
- —
- Monthly cashflow
- —
- DSCR
- —
- Eligible?
- —
Personal DTI + credit; lowest rate.
DSCR
20% down · 8.5% · 30yr
- Down + closing
- —
- Monthly P&I
- —
- Monthly cashflow
- —
- DSCR
- —
- Eligible?
- —
No personal income docs; deal must DSCR.
Hard money
10% down · 12.0% · 12mo
- Down + closing
- —
- Monthly P&I
- —
- Monthly cashflow
- —
- DSCR
- —
- Eligible?
- —
Short-term bridge; refi at stabilization.
Rent comps 33 comps
| Address | Beds | Baths | Sqft | Rent | $/sqft | DOM | Units | Dist |
|---|---|---|---|---|---|---|---|---|
| 480 W Hazeltine Ave Buffalo, NY | 3.0 | 1.0 | 989 | $1,900 | $1.92 | 25d | 1 | 0.36mi |
| 68 Laforce Pl Unit U Buffalo, NY | 2.0 | 1.0 | 900 | $1,099 | $1.22 | 45d | 1 | 0.39mi |
| 134 Philadelphia St Buffalo, NY | 3.0 | 1.0 | 871 | $1,100 | $1.26 | 5d | 1 | 0.41mi |
| 15 Beatrice Ave Buffalo, NY | 2.0 | 1.0 | 950 | $1,150 | $1.21 | 16d | 1 | 0.49mi |
| 356 Hertel Ave Buffalo, NY | 2.0 | 1.5 | 800 | $2,300 | $2.88 | 4d | 1 | 0.60mi |
| 239 Crowley Ave Buffalo, NY | 2.0 | 1.0 | 966 | $1,025 | $1.06 | 5d | 1 | 0.62mi |
| 118 Rano St Buffalo, NY | 3.0 | 1.0 | 1050 | $1,200 | $1.14 | 23d | 1 | 0.62mi |
| 2075 Kenmore Ave Unit 611 Buffalo, NY | 2.0 | 2.0 | 981 | $1,950 | $1.99 | 3d | 1 | 0.64mi |
| 158 Chadduck Ave Buffalo, NY | 4.0 | 1.0 | 1200 | $1,250 | $1.04 | 25d | 1 | 0.78mi |
| 62 Seabrook St Buffalo, NY | 4.0 | 1.0 | 1300 | $2,000 | $1.54 | 3d | 1 | 0.80mi |
| 72 Reservation St Unit 2 Buffalo, NY | 3.0 | 1.0 | 950 | $1,150 | $1.21 | 25d | 1 | 0.85mi |
| 155 Germain St Apt 1 Buffalo, NY | 2.0 | 1.0 | 1000 | $1,000 | $1.00 | 12d | 1 | 0.86mi |
| 293 Grote St Buffalo, NY | 1.0–2.0 | 1.0–2.0 | 817 | $2,345 | $2.87 | 3d | 1 | 0.94mi |
| 2522 Delaware Ave Buffalo, NY | 3.0 | 1.0 | 1150 | $1,625 | $1.41 | 3d | 1 | 1.00mi |
| 68 Peter St Buffalo, NY | 2.0 | 1.0 | 900 | $900 | $1.00 | 25d | 1 | 1.00mi |
| 62 Germain St Buffalo, NY | 3.0 | 1.0 | 1320 | $1,250 | $0.95 | 25d | 1 | 1.03mi |
| 15 Ontario St Unit 1 Buffalo, NY | 3.0 | 1.0 | 1000 | $1,500 | $1.50 | 3d | 1 | 1.06mi |
| 2449 Delaware Ave Unit Upper Buffalo, NY | 2.0 | 1.0 | 772 | $1,200 | $1.55 | 45d | 1 | 1.06mi |
| 244 Hartwell Rd Buffalo, NY | 3.0 | 1.0 | 1250 | $1,500 | $1.20 | 5d | 1 | 1.10mi |
| 1558 Elmwood Ave Unit 4 Buffalo, NY | 2.0 | 1.0 | 800 | $1,100 | $1.38 | 45d | 1 | 1.14mi |
| 139 Fordham Dr Buffalo, NY | 3.0 | 1.0 | 1453 | $1,700 | $1.17 | 25d | 1 | 1.19mi |
| 20 Avery Ave Buffalo, NY | 2.0 | 1.0 | 1000 | $1,300 | $1.30 | 16d | 1 | 1.19mi |
| 2099 Niagara St Unit A Buffalo, NY | 2.0 | 1.0 | 1000 | $1,197 | $1.20 | 45d | 1 | 1.20mi |
| 237 W Girard Blvd Buffalo, NY | 4.0 | 1.5 | 1329 | $4,000 | $3.01 | 25d | 1 | 1.26mi |
| 77 Lovering Ave #2 Buffalo, NY | 3.0 | 1.0 | 1450 | $1,895 | $1.31 | 45d | 1 | 1.35mi |
| 3113 Delaware Ave Unit 1 Buffalo, NY | 2.0 | 1.0 | 1083 | $1,200 | $1.11 | 25d | 1 | 1.40mi |
| 140 Commonwealth Ave Unit 1 Buffalo, NY | 3.0 | 1.0 | 1250 | $3,500 | $2.80 | 45d | 1 | 1.41mi |
| 324 Crestwood Ave Apt 2 Buffalo, NY | 2.0 | 1.0 | 1016 | $1,500 | $1.48 | 16d | 1 | 1.44mi |
| 88 Commonwealth Ave Buffalo, NY | 3.0 | 1.0 | 1355 | $1,695 | $1.25 | 21d | 1 | 1.44mi |
| 52 Kenwood Rd Unit 1 Buffalo, NY | 2.0 | 1.0 | 1100 | $1,250 | $1.14 | 25d | 1 | 1.44mi |
| 52 Somerton Ave Unit Upper Buffalo, NY | 2.0 | 1.0 | 900 | $1,200 | $1.33 | 25d | 1 | 1.46mi |
| 79 Commonwealth Ave Buffalo, NY | 3.0 | 1.0 | 1450 | $1,600 | $1.10 | 25d | 1 | 1.48mi |
| 2022 Delaware Ave Unit 5 Buffalo, NY | 2.0 | 1.0 | 725 | $1,250 | $1.72 | 45d | 1 | 1.49mi |
Listing history 3 events
-
2026-01-15status Pending
-
2025-10-13$179,000 Active
-
2004-02-09soldstatus $30,000
ⓘ Source: listings_history table (triggers on properties + properties_extension) + one-shot
backfill from property_details.listing_events for pre-trigger history.
Tax reassessment forecast NY · Partial reset (capped growth)
- Current annual tax
- $499 · $42/mo
- Projected year-2 tax
- $1,762 · $147/mo
- Expected delta
- +$1,263/yr (+$105/mo · 253.2%)
ⓘ Screening estimate from a state-policy table — verify with the county assessor before closing.
Climate risk First Street
- Flood 1/10 Low FEMA zone X (unshaded) · 0% chance over 30 yrs
- Wildfire 1/10 Low
- Heat 3/10 Moderate 7 d/yr ≥92°F today · 15 d/yr by 30 yrs out
- Wind 1/10 Low
- Air quality 3/10 Moderate 3 unhealthy d/yr today · 4 by 30 yrs out
Nearby sold comps map
Loading sold comps map…
Walkable amenities ~0.75 mi
Loading nearby amenities…
Taxation est. · year 1
- Rental income
- $16,786
- − Mortgage interest
- −$10,027
- − Property taxes
- −$499
- − Insurance
- −$895
- − Repairs & maintenance
- −$1,343
- − Management
- −$1,343
- − Depreciation
- −$5,207
- Taxable loss
- −$2,527
- Est. tax savings @ 24.0%
- +$607
- After-tax cash flow
- $1,210/yr
For passive investors: Depreciation is non-cash, so a rental often shows a tax loss while cash-flowing — sheltering income. Rental losses are passive: they offset passive income freely, and up to $25,000/yr can offset ordinary (W-2) income if you actively participate and your MAGI is under $100k (phasing out to $0 by $150k); unused losses carry forward. On sale, claimed depreciation is recaptured at up to 25%, and gains may owe capital-gains tax (a 1031 exchange can defer both). Figures are a year-1 estimate at your 24.0% rate — not tax advice; consult a CPA.
Schools (NCES district)
- District
- Buffalo City School District
- NCES district ID
- 3605850
- Math proficiency
- 41% ▲ 11.00%
- Reading proficiency
- 40% ▲ 7.00%
- Median HH income
- $31,665
- Composite
- 33.17/100
- National rank
- #5544
- State rank
- #535 of 590 in NY
Livability — Buffalo
- Score
- 77/100
- State rank
- #195
- US rank
- #3011
Category grades
Schools grade is shown separately in the Schools card above.
Census & demographics
- Census place
- Buffalo, NY
- County
- Erie County · 714,559 people
- City population
- 440,021
- Metro
- Buffalo-Cheektowaga, NY
- Population (ZIP)
- 26,327
- Household income
- $39,753
- Rent vs Own
- Severe rent burden
- 2177.0
Population outlook (Erie County) Hauer SSP2
- Today (2025)
- 933,037 people
- By 2030
- 935,181 · +0.2%
- By 2040
- 928,531 · -0.5%
- By 2050
- 905,725 · -2.9%
- By 2075
- 834,037 · -10.6%
- By 2100
- 708,033 · -24.1%
Race, ethnicity, and origin ACS 2023
- Neighborhood character
- Highly diverse neighborhood (Simpson 0.74)
- Race & ethnicity
- White 40% Hispanic / Latino 23% Black 16% Asian 15% Two or more races 14%
- Hispanic origin (detail)
- Puerto Rican 18% Dominican 2%
- Common ancestry
- Romanian 8% Portuguese 1% Arab 1%
- Foreign-born
- 19% · Philippines, Canada, India
- Languages at home
- 65% English-only · Spanish 14% Other Asian/Pacific 10% Other Indo-European 5%
Political lean MEDSL · Erie
- 2024 margin
- Lean D (+9.7) · D 54.8% · R 45.2%
- 2008→2024 swing
- -7.9pp toward R · 2008: 17.5pp · 2024: 9.7pp
- All cycles
- 2024: D+9.7 2020: D+14.7 2016: D+4.8 2012: D+15.6 2008: D+17.5
Not yet ingested
- Civics
- —
Market trends
- HPI YoY
- ▼ -54.42%
- Current HPI
- 233.0902
- Rent YoY
- ▲ 8.19%
- Metro
- Buffalo-Cheektowaga, NY
- State GDP YoY
- ▲ 2.60%
- F500 in state
- 92
Industry mix (Fortune 500 HQ in NY)
| Industry | F500 HQs | Revenue |
|---|---|---|
| Financial Services | 10 | $950B |
|
||
| Consumer Goods | 9 | $162B |
|
||
| Insurance | 4 | $225B |
|
||
| Telecommunications | 2 | $144B |
|
||
| Pharmaceuticals | 2 | $112B |
|
||
| Media / Entertainment | 2 | $69B |
|
||
Price history
+496.7% since first listed3 events — show timeline
- 2026-01-15 Pending — WNYREIS
- 2025-10-13 Listed $179,000 WNYREIS
- 2004-02-09 Sold (Public Records) $30,000 Public Records
Property tax history
+7.6%/yrLatest (2025): $499 · +0.0% YoY. Source: county tax records.
Cash-flow waterfall
monthlySold comps — $/sqft
last 12 mo · ≤1 miLoading sold comps…