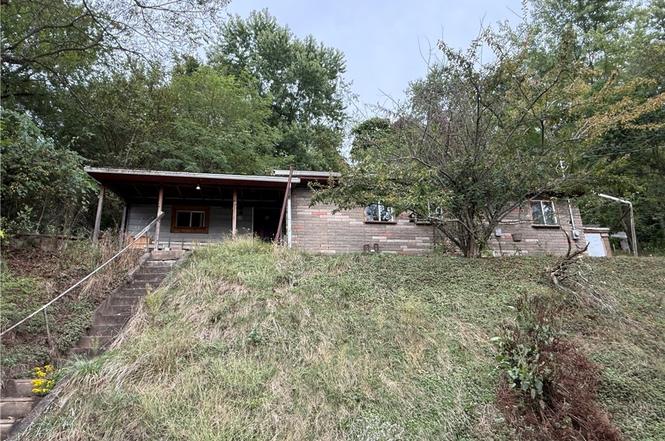
705 Maryland Ave · Glassport, PA
Flood risk 1/10 · Minimal
- FEMA flood zone
- X (unshaded)
- Chance of flooding over 30 yrs
- 0.0%
- Est. flood insurance / yr
- $473 – $860
Fire risk 1/10 · Minimal
- Est. fire insurance / yr
- $511 – $949
Heat risk 3/10 · Minor
- Hot days now (above 97°F)
- 7 days/yr
- Hot days in 30 yrs
- 17 days/yr
Wind risk 2/10 · Minimal
- Chance of severe wind over 30 yrs
- —
Air-quality risk 5/10 · Moderate
- Unhealthy air days now
- 8 days/yr
- Unhealthy air days in 30 yrs
- 8 days/yr
Risk factors via First Street. Map © Google.
Why this score? — see what drove the D+ grade
The composite is a weighted blend of 9 inputs, each scored 0–100. Each bar is that input's sub-score; the figure is the points it added to the 100-point composite (weight × sub-score).
- Cash flow +15.0/30.0
- ARV discount +7.5/15.0
- Appreciation +5.1/10.0
- 1% rule +5.0/10.0
- DSCR +5.0/10.0
- Livability +3.6/5.0
- Schools +2.8/10.0
- Rent growth +2.5/5.0
- Condition / age +2.5/5.0
$18,000
🖨 Deal sheet 📄 Offer letter ✓ Due diligence
Listing remarks
Low traffic street, simple home. 2 bed 1 bath with an additional room that could be a bedroom. Metal roof, new windows, electric service and furnace in 2018. Could be a starter home or great opportunity to start investing in real estate.
Key facts
- Electric service
- Metal roof
- Furnace
Tags
Property features AI
Exterior
- Parking: On-street parking
- Utilities: Public water
- Home design: Single-story residence; Resale property
- Construction: Brick construction; Metal roof
- Exterior features: Public transportation access nearby
Interior
- Kitchen: Refrigerator; Stove; Some gas appliances
- Bedrooms: Bedroom on main level; Additional bonus room on main level
- Bathrooms: 1 full bathroom
- Heating & cooling: Forced air heating (gas)
- Interior features: Window treatments throughout; Interior entry basement
Neighborhood map
What this means for you Summary
Snapshot
- This is a 2-bed/1.0-bath single-family listed at $18k.
Deal economics
- At list price, monthly cash flow is $707 ($8k/yr) — positive.
- The deal already cash-flows at list — no discount required.
- Meets the 1% rule at list price ($1k rent vs $18k).
- Recommended offer: $16k (12.0% below list) — sets the bar for market timing.
- Cap rate 53.4% vs local median 8.4% in Glassport — top-decile yield for the area; either an underpriced asset or a hidden risk that comps aren't pricing in. Stress-test before assuming the spread holds.
Location & tenants
- Location reads 71/100 on livability (#716 in PA) — a middle-class / working-renter tenant base. Strengths: cost of living A+, housing A+, commute A-; Watch: crime C-, employment D+, schools D-.
- South Allegheny SD (suburban): math 23% / reading 44% proficiency, ranked #430 of 539 in PA (top 80%) — families likely to look elsewhere, expect single-tenant / working-renter base with shorter leases.
- Market conditions: 24 active listings in the ZIP; 4 comparable units currently listed for rent nearby; rentals lingering (median 44d on market — plan ~5-8 weeks vacancy on turnover, expect pricing pressure); 50% of comp listings sitting > 30 days — soft ceiling on asking rent; 2,996 units permitted in Allegheny County in 2024 (1,588 in 5+ unit buildings).
Forward outlook
- In year one you build about $156 of equity ($124 loan paydown + $32 appreciation (0.2% local appreciation)).
- At projected returns (0.2% appreciation + 3.0% rent growth), your $5k cash investment doubles in ~1 year — after that, you're playing with house money.
Negotiation context
- It's been on market 133 days — a 12% lower offer ($16k) is reasonable based on typical stale-listing flexibility.
- 3 sale attempts; this cycle's ask has dropped $11k (38%) from the opening price — seller is motivated, your offer sets the floor, not the list.
Risks & watch-outs
- Watch-outs: built in 1900 — expect roof / HVAC / electrical / plumbing capex.
Questions for the listing agent
- It's been on market 133 days. Have you received any prior offers? Is the seller open to a 12% concession, seller financing, or rate buy-down credit?
- Built in 1900 — when were the roof, HVAC, electrical panel, plumbing, and water heater last replaced?
- Why hasn't it sold? Are there any deal-killer items the seller is aware of (foundation, flood, title, zoning, code violations)?
- Is there a deadline driving the sale (1031 exchange, divorce, estate, relocation)? That informs how much negotiation room exists.
- Schools are D-rated, which usually means shorter tenancies and higher turnover. Who's the typical renter profile here, and what's been the actual vacancy rate?
- The area grade is low — what's the realistic commute time and amenity access for the typical tenant pool here? Any planned neighborhood developments (good or bad) we should know about?
- What's the average days-on-market for RENTAL listings here right now (not sales)? A rising rental-DOM trend means longer vacancies and softer asking-rent achievability than the comps imply.
- What's the recent tenant-quality profile in this submarket — average credit score on applications, eviction rate, late-payment / NSF rate, and stable-employment percentage? A property-management company in the area should have these aggregated.
- How much new for-sale + rental construction is in the pipeline within 1–3 miles? Heavy new supply typically softens prices + rents 12–24 months out; constrained supply supports both.
Investment metrics
- 1% rule
- 5.85% ✓
- Cap rate
- 53.45%
- Cash-on-cash
- 168.42%
- DSCR
- 8.49
- GRM
- 1.4
CMA / ARV
- ARV (on-the-fly)
- $70,312
- Comps found
- 3
Show comp detail 3 sales within ~0.75 mi
| Address | Dist | Beds/Ba | Sqft | Sold | Price | $/sf | Match |
|---|---|---|---|---|---|---|---|
| 715 Indiana Ave | 0.12mi | 1/1.0 (-1) | 772 (+3%) | 14mo | $18,000 | $23 | 72 |
| 415 Euclid Ave | 0.36mi | 2/2.0 | 836 (+12%) | 4mo | $89,900 | $108 | 56 |
| 1035 Delaware Ave | 0.39mi | 3/1.5 (+1) | 690 (-8%) | 14mo | $65,000 | $94 | 50 |
Match score weights: distance 35% · size 25% · config 20% · recency 20%. Top-matched comps best support the ARV.
Projected returns pro-forma
0.18% appreciation · 3.0% rent growth · sell at horizon
- IRR
- —
- Equity multiple
- 9.87×
- Total profit
- $44,692
- Equity at exit
- $5,388
- IRR
- —
- Equity multiple
- 20.75×
- Total profit
- $99,526
- Equity at exit
- $6,606
Cash invested: $5,040 (down + closing). Projections, not guarantees.
Landlord ↔ Tenant lean methodology
- Overall (STATE)
- 62 Landlord-Friendly
- State Pennsylvania
- 62 Landlord-Friendly · EVEN
- County
- — inherits STATE
- City
- — inherits STATE
ZIP-level market 15045
- Home prices YoY
- 0.1%
- Active inventory
- 24
- Price-to-rent
- 1.4×
Monthly cashflow live
- Estimated rent
- $1,053 medium interval (Pro) →
- Mortgage (P&I)
- −$94
- Tax est. 1.5%
- −$22 /mo · $270/yr
- Insurance
- −$8
- HOA
- −$0
- Vacancy / Maint / Mgmt
- −$221
- Net cashflow
- $707
Break-even live
UW: 25.0% down · 7.5% · 30yr · 1.5% tax · 5.0% vac · 8.0% maint · 8.0% mgmt
Financing live
Cash to close
- Down payment
- $4,500
- Closing costs
- $540
- Reserves months
- —
- Total cash needed
- —
Loan-product check · same deal, 3 products live
Conventional
25% down · 7.5% · 30yr
- Down + closing
- —
- Monthly P&I
- —
- Monthly cashflow
- —
- DSCR
- —
- Eligible?
- —
Personal DTI + credit; lowest rate.
DSCR
20% down · 8.5% · 30yr
- Down + closing
- —
- Monthly P&I
- —
- Monthly cashflow
- —
- DSCR
- —
- Eligible?
- —
No personal income docs; deal must DSCR.
Hard money
10% down · 12.0% · 12mo
- Down + closing
- —
- Monthly P&I
- —
- Monthly cashflow
- —
- DSCR
- —
- Eligible?
- —
Short-term bridge; refi at stabilization.
Rent comps 4 comps
| Address | Beds | Baths | Sqft | Rent | $/sqft | DOM | Units | Dist |
|---|---|---|---|---|---|---|---|---|
| 642 Ohio Ave Unit 1 Glassport, PA | 2.0 | 1.0 | 700 | $1,200 | $1.71 | 44d | 1 | 0.30mi |
| 2860 Washington Blvd Unit 5 McKeesport, PA | 1.0 | 1.0 | 600 | $799 | $1.33 | 24d | 1 | 1.29mi |
| 2860 Washington Blvd Unit 3 McKeesport, PA | 1.0 | 1.0 | 600 | $799 | $1.33 | 44d | 1 | 1.29mi |
| 313 San Juan Dr McKeesport, PA | 1.0 | 1.0 | 520 | $775 | $1.49 | 24d | 1 | 1.31mi |
Listing history 5 events
-
2026-06-18days on market $18,000 Active 133 DOM
-
2026-06-17days on market $18,000 Active 132 DOM
-
2026-06-16days on market $18,000 Active 131 DOM
-
2026-06-16remarks 237-char remark
-
2026-06-16$18,000 Active 130 DOM
ⓘ Source: listings_history table (triggers on properties + properties_extension) + one-shot
backfill from property_details.listing_events for pre-trigger history.
Climate risk First Street
- Flood 1/10 Low FEMA zone X (unshaded) · 0% chance over 30 yrs
- Wildfire 1/10 Low
- Heat 3/10 Moderate 7 d/yr ≥97°F today · 17 d/yr by 30 yrs out
- Wind 2/10 Low
- Air quality 5/10 Major 8 unhealthy d/yr today · 8 by 30 yrs out
Nearby sold comps map
Loading sold comps map…
Walkable amenities ~0.75 mi
Loading nearby amenities…
Taxation est. · year 1
- Rental income
- $12,634
- − Mortgage interest
- −$1,008
- − Property taxes
- −$270
- − Insurance
- −$90
- − Repairs & maintenance
- −$1,011
- − Management
- −$1,011
- − Depreciation
- −$524
- Taxable income
- $8,721
- Est. tax owed @ 24.0%
- −$2,093
- After-tax cash flow
- $6,395/yr
For passive investors: Depreciation is non-cash, so a rental often shows a tax loss while cash-flowing — sheltering income. Rental losses are passive: they offset passive income freely, and up to $25,000/yr can offset ordinary (W-2) income if you actively participate and your MAGI is under $100k (phasing out to $0 by $150k); unused losses carry forward. On sale, claimed depreciation is recaptured at up to 25%, and gains may owe capital-gains tax (a 1031 exchange can defer both). Figures are a year-1 estimate at your 24.0% rate — not tax advice; consult a CPA.
Schools (NCES district)
- District
- South Allegheny SD
- NCES district ID
- 4221910
- Math proficiency
- 23% ▼ -10.00%
- Reading proficiency
- 44% ▼ -13.00%
- Median HH income
- $40,891
- Composite
- 28.15/100
- National rank
- #6815
- State rank
- #430 of 539 in PA
Livability — Glassport
- Score
- 71/100
- State rank
- #716
- US rank
- #7113
Category grades
Schools grade is shown separately in the Schools card above.
Census & demographics
- Census place
- Glassport, PA
- City population
- 4,400
- Population (ZIP)
- 4,400
Population outlook (Allegheny County) Hauer SSP2
- Today (2025)
- 1,250,282 people
- By 2030
- 1,256,482 · +0.5%
- By 2040
- 1,256,318 · +0.5%
- By 2050
- 1,244,169 · -0.5%
- By 2075
- 1,197,693 · -4.2%
- By 2100
- 1,093,187 · -12.6%
Race, ethnicity, and origin ACS 2023
- Neighborhood character
- Predominantly White (88%)
- Race & ethnicity
- White 88% Hispanic / Latino 6% Black 4% Two or more races 3%
- Hispanic origin (detail)
- Mexican 4%
- Common ancestry
- Romanian 18% Portuguese 6% Serbian 6%
- Foreign-born
- 1% · South Korea, Canada
- Languages at home
- 97% English-only · German/W. Germanic 1% Spanish 1% Korean 1%
Political lean MEDSL · Allegheny
- 2024 margin
- Strong D (+20.3) · D 59.7% · R 39.4%
- 2008→2024 swing
- +4.8pp toward D · 2008: 15.5pp · 2024: 20.3pp
- All cycles
- 2024: D+20.3 2020: D+20.4 2016: D+16.4 2012: D+14.4 2008: D+15.5
Not yet ingested
- Civics
- —
Market trends
- HPI YoY
- ▲ 0.18%
- Current HPI
- 214.7403
- Rent YoY
- —
- Metro
- —
- State GDP YoY
- ▲ 1.68%
- F500 in state
- 34
Industry mix (Fortune 500 HQ in PA)
| Industry | F500 HQs | Revenue |
|---|---|---|
| Healthcare | 2 | $309B |
|
||
| Insurance | 2 | $27B |
|
||
| Telecommunications / Media | 1 | $124B |
|
||
| Industrial Distribution | 1 | $22B |
|
||
| Financial Services | 1 | $20B |
|
||
| Chemicals / Materials | 1 | $18B |
|
||
Price history
+80.0% since first listed11 events — show timeline
- 2026-06-15 Relisted — West Penn MLS
- 2026-06-08 Price Changed $18,000 West Penn MLS
- 2026-03-27 Contingent — West Penn MLS
- 2026-03-16 Price Changed $20,500 West Penn MLS
- 2026-03-01 Price Changed $21,900 West Penn MLS
- 2026-02-18 Relisted — West Penn MLS
- 2026-02-11 Contingent — West Penn MLS
- 2026-01-20 Price Changed $24,900 West Penn MLS
- 2026-01-08 Listed $29,000 West Penn MLS
- 2022-10-07 Sold (Public Records) $30,929 Public Records
- 2016-10-13 Sold (Public Records) $10,000 Public Records
Property tax history
+14.4%/yrLatest (2026): $1,072 · +6.9% YoY. Source: county tax records.
Cash-flow waterfall
monthlySold comps — $/sqft
last 12 mo · ≤1 miLoading sold comps…