45 County Route 26a · Coxsackie, NY
Flood risk 1/10 · Minimal
- FEMA flood zone
- X
- Chance of flooding over 30 yrs
- 0.0%
- Est. flood insurance / yr
- $473 – $860
Fire risk 1/10 · Minimal
- Est. fire insurance / yr
- $691 – $1,283
Heat risk 4/10 · Minor
- Hot days now (above 99°F)
- 7 days/yr
- Hot days in 30 yrs
- 16 days/yr
Wind risk 3/10 · Minor
- Chance of severe wind over 30 yrs
- 7.0%
Air-quality risk 2/10 · Minimal
- Unhealthy air days now
- 0 days/yr
- Unhealthy air days in 30 yrs
- 1 days/yr
Risk factors via First Street. Map © Google.
Why this score? — see what drove the A- grade
The composite is a weighted blend of 9 inputs, each scored 0–100. Each bar is that input's sub-score; the figure is the points it added to the 100-point composite (weight × sub-score).
- Cash flow +30.0/30.0
- 1% rule +10.0/10.0
- DSCR +10.0/10.0
- Appreciation +10.0/10.0
- ARV discount +7.5/15.0
- Schools +4.8/10.0
- Livability +3.7/5.0
- Rent growth +2.5/5.0
- Condition / age +2.5/5.0
$119,888
🖨 Deal sheet 📄 Offer letter ✓ Due diligence
Listing remarks
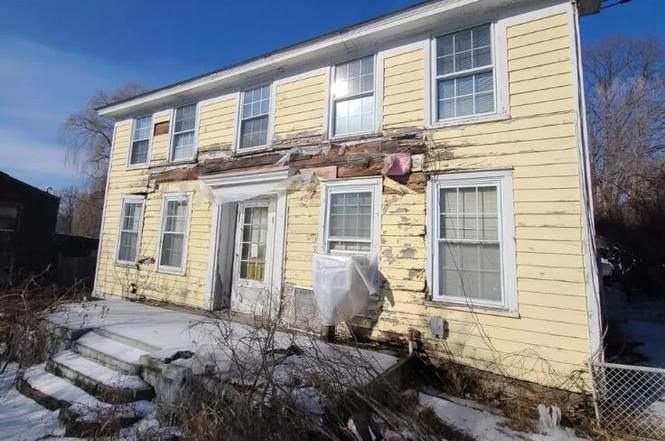
Opportunity awaits as this affordable 3-bedroom 2 bath Stuyvesant home hits the market! This home needs some work and would need to be a rehab loan or cash but there is tremendous potential here. Two fireplaces, hardwood floors, laundry room and extra summer kitchen are all positives! Convenient location and great yard!
Key facts
- Laundry room
- Extra summer kitchen
- Great yard
Tags
Property features AI
Exterior
- Parking: Driveway with space for 2 vehicles
- Utilities: Septic tank sewer; Cistern water source
- Home design: Single-family residence; Updated / remodeled
- Construction: Wood siding construction; Asphalt roof (and other); Built on a full foundation
- Exterior features: Deck; Garden; Exterior lighting; Fenced yard; Landscaped, level lot
Interior
- Kitchen: Dishwasher; Range hood; Refrigerator
- Bedrooms: Bedrooms on the first and second levels
- Flooring: Wood and hardwood flooring
- Bathrooms: Two full bathrooms (one on first level, one on second level)
- Heating & cooling: Hot water heating using oil
- Interior features: Built-in features; Full basement; One wood-burning fireplace
- Laundry & utility: Dedicated laundry room
Neighborhood map
What this means for you Summary
Snapshot
- This is a 2-bed/1.0-bath single-family listed at $120k.
Deal economics
- At list price, monthly cash flow is $1k ($12k/yr) — positive.
- The deal already cash-flows at list — no discount required.
- Meets the 1% rule at list price ($2k rent vs $120k).
- Recommended offer: $106k (12.0% below list) — sets the bar for market timing.
- Cap rate 16.4% vs local median 3.2% in Coxsackie — top-decile yield for the area; either an underpriced asset or a hidden risk that comps aren't pricing in. Stress-test before assuming the spread holds.
Location & tenants
- Location reads 73/100 on livability (#310 in NY) — a middle-class / working-renter tenant base. Strengths: housing A+, health & safety A+, crime A; Watch: amenities F, commute F.
- Kinderhook Central School District (rural): math 49% / reading 59% proficiency, ranked #294 of 590 in NY (top 50%) — acceptable for families but not a draw, mixed tenant base, ~2y average lease.
- Market conditions: 22 active listings in the ZIP; 1 comparable units currently listed for rent nearby; 136 units permitted in Columbia County in 2024 (0 in 5+ unit buildings).
Forward outlook
- In year one you build about $13k of equity ($829 loan paydown + $12k appreciation (10.0% local appreciation)).
- Columbia County population projected at -22% by 2050 — secular population decline; favor cash flow + early exit over multi-decade hold.
- At projected returns (10.0% appreciation + 3.0% rent growth), your $34k cash investment doubles in ~2 years — after that, you're playing with house money.
- By year 3, paydown + projected appreciation supports a ~$32k cash-out refi (75% LTV) — recoverable capital for the next deal without selling this one.
Negotiation context
- It's been on market 262 days — a 12% lower offer ($106k) is reasonable based on typical stale-listing flexibility.
- 2 sale attempts since 4y ago with the ask held roughly flat each time — persistent listings suggest the price (not the market) is what's stuck; bring a comps-based counter.
Risks & watch-outs
- Watch-outs: property tax is 2.9% of price; built in 1850 — expect roof / HVAC / electrical / plumbing capex.
Questions for the listing agent
- It's been on market 262 days. Have you received any prior offers? Is the seller open to a 12% concession, seller financing, or rate buy-down credit?
- Built in 1850 — when were the roof, HVAC, electrical panel, plumbing, and water heater last replaced?
- Property tax is high relative to price — has the assessment been appealed recently, and will the sale trigger a re-assessment?
- Why hasn't it sold? Are there any deal-killer items the seller is aware of (foundation, flood, title, zoning, code violations)?
- Is there a deadline driving the sale (1031 exchange, divorce, estate, relocation)? That informs how much negotiation room exists.
- What's the average days-on-market for RENTAL listings here right now (not sales)? A rising rental-DOM trend means longer vacancies and softer asking-rent achievability than the comps imply.
- What's the recent tenant-quality profile in this submarket — average credit score on applications, eviction rate, late-payment / NSF rate, and stable-employment percentage? A property-management company in the area should have these aggregated.
- How much new for-sale + rental construction is in the pipeline within 1–3 miles? Heavy new supply typically softens prices + rents 12–24 months out; constrained supply supports both.
Investment metrics
- 1% rule
- 2.09% ✓
- Cap rate
- 16.36%
- Cash-on-cash
- 35.95%
- DSCR
- 2.60
- GRM
- 4.0
CMA / ARV
No comps found within radius.
Projected returns pro-forma
10.0% appreciation · 3.0% rent growth · sell at horizon
- IRR
- 51.9%
- Equity multiple
- 4.86×
- Total profit
- $129,475
- Equity at exit
- $108,005
- IRR
- 45.6%
- Equity multiple
- 10.87×
- Total profit
- $331,156
- Equity at exit
- $232,916
Cash invested: $33,569 (down + closing). Projections, not guarantees.
Landlord ↔ Tenant lean methodology
- Overall (STATE)
- 15 Strongly Tenant-Friendly
- State New York
- 15 Strongly Tenant-Friendly · D+10
- County
- — inherits STATE
- City
- — inherits STATE
ZIP-level market 12173
- Home prices YoY
- 8.6%
- Active inventory
- 22
- Price-to-rent
- 4.0×
Monthly cashflow live
- Estimated rent
- $2,500 medium interval (Pro) →
- Mortgage (P&I)
- −$629
- Tax from tax record
- −$291 /mo · $3,487/yr
- Insurance
- −$50
- HOA
- −$0
- Vacancy / Maint / Mgmt
- −$525
- Net cashflow
- $1,006
Break-even live
UW: 25.0% down · 7.5% · 30yr · 1.5% tax · 5.0% vac · 8.0% maint · 8.0% mgmt
Financing live
Cash to close
- Down payment
- $29,972
- Closing costs
- $3,597
- Reserves months
- —
- Total cash needed
- —
Loan-product check · same deal, 3 products live
Conventional
25% down · 7.5% · 30yr
- Down + closing
- —
- Monthly P&I
- —
- Monthly cashflow
- —
- DSCR
- —
- Eligible?
- —
Personal DTI + credit; lowest rate.
DSCR
20% down · 8.5% · 30yr
- Down + closing
- —
- Monthly P&I
- —
- Monthly cashflow
- —
- DSCR
- —
- Eligible?
- —
No personal income docs; deal must DSCR.
Hard money
10% down · 12.0% · 12mo
- Down + closing
- —
- Monthly P&I
- —
- Monthly cashflow
- —
- DSCR
- —
- Eligible?
- —
Short-term bridge; refi at stabilization.
Rent comps 1 comps
| Address | Beds | Baths | Sqft | Rent | $/sqft | DOM | Units | Dist |
|---|---|---|---|---|---|---|---|---|
| 100 Summerset Rd Stuyvesant, NY | 2.0 | 2.0 | 1560 | $2,500 | $1.60 | 14d | 1 | 0.47mi |
Listing history 19 events
-
2026-06-19days on market $119,888 Active 262 DOM
-
2026-06-18days on market $119,888 Active 261 DOM
-
2026-06-17days on market $119,888 Active 260 DOM
-
2026-06-16days on market $119,888 Active 259 DOM
-
2026-06-15days on market $119,888 Active 258 DOM
-
2026-06-14days on market $119,888 Active 256 DOM
-
2026-06-12days on market $119,888 Active 255 DOM
-
2026-06-09days on market $119,888 Active 252 DOM
-
2026-06-08days on market $119,888 Active 251 DOM
-
2026-06-07days on market $119,888 Active 250 DOM
-
2026-06-07days on market $119,888 Active 249 DOM
-
2026-06-04days on market $119,888 Active 246 DOM
-
2026-06-02days on market $119,888 Active 245 DOM
-
2026-06-01days on market $119,888 Active 244 DOM
-
2026-05-31days on market $119,888 Active 243 DOM
-
2026-05-31days on market $119,888 Active 242 DOM
-
2025-11-18price $119,888
-
2025-09-30$124,888 Active
-
2022-02-15$149,000
ⓘ Source: listings_history table (triggers on properties + properties_extension) + one-shot
backfill from property_details.listing_events for pre-trigger history.
Tax reassessment forecast NY · Partial reset (capped growth)
- Current annual tax
- $3,487 · $291/mo
- Projected year-2 tax
- $3,487 · $291/mo
- Expected delta
- $0/yr ($0/mo · 0.0%)
ⓘ Screening estimate from a state-policy table — verify with the county assessor before closing.
Climate risk First Street
- Flood 1/10 Low FEMA zone X · 0% chance over 30 yrs
- Wildfire 1/10 Low
- Heat 4/10 Moderate 7 d/yr ≥99°F today · 16 d/yr by 30 yrs out
- Wind 3/10 Moderate 7% chance of damaging wind over 30 yrs
- Air quality 2/10 Low 0 unhealthy d/yr today · 1 by 30 yrs out
Nearby sold comps map
Loading sold comps map…
Walkable amenities ~0.75 mi
Loading nearby amenities…
Taxation est. · year 1
- Rental income
- $30,000
- − Mortgage interest
- −$6,716
- − Property taxes
- −$3,487
- − Insurance
- −$599
- − Repairs & maintenance
- −$2,400
- − Management
- −$2,400
- − Depreciation
- −$3,488
- Taxable income
- $10,910
- Est. tax owed @ 24.0%
- −$2,618
- After-tax cash flow
- $9,451/yr
For passive investors: Depreciation is non-cash, so a rental often shows a tax loss while cash-flowing — sheltering income. Rental losses are passive: they offset passive income freely, and up to $25,000/yr can offset ordinary (W-2) income if you actively participate and your MAGI is under $100k (phasing out to $0 by $150k); unused losses carry forward. On sale, claimed depreciation is recaptured at up to 25%, and gains may owe capital-gains tax (a 1031 exchange can defer both). Figures are a year-1 estimate at your 24.0% rate — not tax advice; consult a CPA.
Schools (NCES district)
- District
- Kinderhook Central School District
- NCES district ID
- 3615210
- Math proficiency
- 49% ▼ -10.00%
- Reading proficiency
- 59% ▲ 1.00%
- Median HH income
- $68,409
- Composite
- 47.82/100
- National rank
- #2223
- State rank
- #294 of 590 in NY
Livability — Coxsackie
- Score
- 73/100
- State rank
- #310
- US rank
- #5149
Category grades
Schools grade is shown separately in the Schools card above.
Census & demographics
- Population (ZIP)
- 2,040
Population outlook (Columbia County) Hauer SSP2
- Today (2025)
- 58,662 people
- By 2030
- 56,557 · -3.6%
- By 2040
- 51,324 · -12.5%
- By 2050
- 45,790 · -21.9%
- By 2075
- 35,232 · -39.9%
- By 2100
- 25,846 · -55.9%
Race, ethnicity, and origin ACS 2023
- Neighborhood character
- Predominantly White (86%)
- Race & ethnicity
- White 86% Hispanic / Latino 11% Two or more races 2% Black 1%
- Hispanic origin (detail)
- Mexican 8% Cuban 2%
- Common ancestry
- Iranian 12% Romanian 6% Lithuanian 3%
- Foreign-born
- 1% · Canada
- Languages at home
- 92% English-only · Spanish 8%
Political lean MEDSL · Columbia
- 2024 margin
- D (+14.7) · D 57.4% · R 42.6%
- 2008→2024 swing
- +1.3pp toward D · 2008: 13.4pp · 2024: 14.7pp
- All cycles
- 2024: D+14.7 2020: D+16.7 2016: D+1.4 2012: D+11.7 2008: D+13.4
Not yet ingested
- Civics
- —
Market trends
- HPI YoY
- ▲ 31.11%
- Current HPI
- 393.6279
- Rent YoY
- —
- Metro
- —
- State GDP YoY
- ▲ 2.60%
- F500 in state
- 92
Industry mix (Fortune 500 HQ in NY)
| Industry | F500 HQs | Revenue |
|---|---|---|
| Financial Services | 10 | $950B |
|
||
| Consumer Goods | 9 | $162B |
|
||
| Insurance | 4 | $225B |
|
||
| Telecommunications | 2 | $144B |
|
||
| Pharmaceuticals | 2 | $112B |
|
||
| Media / Entertainment | 2 | $69B |
|
||
Price history
-19.5% since first listed3 events — show timeline
- 2025-11-18 Price Changed $119,888 Global MLS
- 2025-09-30 Listed $124,888 Global MLS
- 2022-02-15 Listed $149,000 HVCRMLS
Property tax history
+2.7%/yrLatest (2025): $3,487 · -4.8% YoY. Source: county tax records.
Cash-flow waterfall
monthlySold comps — $/sqft
last 12 mo · ≤1 miLoading sold comps…