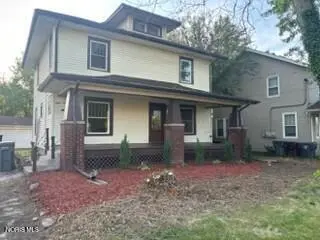
813 College Ave · Lima, OH
Flood risk 1/10 · Minimal
- FEMA flood zone
- X (unshaded)
- Chance of flooding over 30 yrs
- 0.0%
- Est. flood insurance / yr
- $473 – $860
Fire risk 1/10 · Minimal
- Est. fire insurance / yr
- $713 – $1,323
Heat risk 3/10 · Minor
- Hot days now (above 100°F)
- 7 days/yr
- Hot days in 30 yrs
- 18 days/yr
Wind risk 2/10 · Minimal
- Chance of severe wind over 30 yrs
- —
Air-quality risk 2/10 · Minimal
- Unhealthy air days now
- 1 days/yr
- Unhealthy air days in 30 yrs
- 2 days/yr
Risk factors via First Street. Map © Google.
Why this score? — see what drove the D grade
The composite is a weighted blend of 9 inputs, each scored 0–100. Each bar is that input's sub-score; the figure is the points it added to the 100-point composite (weight × sub-score).
- Cash flow +17.6/30.0
- ARV discount +7.0/15.0
- DSCR +5.5/10.0
- 1% rule +3.8/10.0
- Livability +3.2/5.0
- Schools +2.6/10.0
- Rent growth +2.5/5.0
- Condition / age +2.5/5.0
- Appreciation +0.0/10.0
$180,000
🖨 Deal sheet (PDF) 📄 Offer letter ✓ Due diligence
Listing remarks MLS
Wonderfully maintained family home with great backyard living space. Great warmth and homey feel. Cute kitchen, with dinette, close to school. Don't miss it!
Key facts
- 8,233 sq ft lot
- 2 garage spots
- Built 1920
Property features AI
Exterior
- Parking: Detached garage; Driveway; Total parking for 4 vehicles; 2-car garage
- Utilities: Electricity connected; Natural gas connected; Public water; Public sewer
- Home design: Single-family residence (house); Two stories; No shared/common walls; Living area reported from public records
- Construction: Brick and vinyl siding exterior; Block foundation; Year built from public records
- Exterior features: Front porch; Deck; Shingle roof; City street frontage with asphalt road
Interior
- Kitchen: Dishwasher; Electric range; Refrigerator; Garden window
- Bedrooms: Primary/other bedroom on main level; Three bedrooms located on the upper level
- Flooring: Carpet; Luxury vinyl
- Bathrooms: Two full bathrooms
- Heating & cooling: Forced air heating; Central air conditioning
- Interior features: Double vanity; Eat-in kitchen; Ceiling fans throughout; Gas fireplace
- Laundry & utility: Main-level laundry with electric dryer hookup; Unfinished basement for additional storage/utility space
Neighborhood map
What this means for you Summary
Snapshot
- This is a 3-bed/1.0-bath single-family listed at $180k.
Deal economics
- At list price, monthly cash flow is $141 ($2k/yr) — positive.
- The deal already cash-flows at list — no discount required.
- To meet the 1% rule (rent ≥ 1% of price), the offer needs to be $158k (12.3% below list).
- Recommended offer: $158k (12.3% below list) — sets the bar for 1% rule.
Location & tenants
- Location reads 64/100 on livability (#787 in OH) — a middle-class / working-renter tenant base. Strengths: cost of living A+, housing A+, health & safety A-; Watch: crime F, amenities F, commute F.
- Lima City (urban): math 29% / reading 36% proficiency, ranked #575 of 656 in OH (top 88%) — families likely to look elsewhere, expect single-tenant / working-renter base with shorter leases; 83% free/reduced lunch — lower-income household profile, screen leases tightly.
- Zoned schools: Heritage Elementary School (math 42% / reading 32%, grade F, #1,087 of 1,584 statewide, top 70%, 421 students, 0% FRL); Lima West Middle School (math 22% / reading 24%, grade F, #600 of 654 statewide, top 92%, 352 students, 0% FRL); Lima Senior High School (math 16% / reading 42%, grade F, #627 of 781 statewide, top 81%, 1,013 students, 0% FRL) — zoned schools average 0% FRL vs 83% district-wide (83 pts lower); this property's tenant base skews higher-income than the district average.
- Market conditions: 106 active listings in the ZIP; 8 comparable units currently listed for rent nearby; rentals lingering (median 46d on market — plan ~5-8 weeks vacancy on turnover, expect pricing pressure); 100% of comp listings sitting > 30 days — soft ceiling on asking rent; 88 units permitted in Allen County in 2024 (0 in 5+ unit buildings).
Forward outlook
- Local home prices are declining (-3.0%/yr); year-one equity from $1k of loan paydown is wiped out by about $5k of value loss. Plan a longer hold.
- Allen County population projected at -14% by 2050 — secular population decline; favor cash flow + early exit over multi-decade hold.
Negotiation context
- Only 14 days on market — expect competitive offers; lowballing is unlikely to land.
- Current owner paid $80k; list at $180k implies a 124% gain — meaningful room to come down on a strong offer.
Risks & watch-outs
- Watch-outs: built in 1920 — expect roof / HVAC / electrical / plumbing capex.
Questions for the listing agent
- Built in 1920 — when were the roof, HVAC, electrical panel, plumbing, and water heater last replaced?
- Is there a deadline driving the sale (1031 exchange, divorce, estate, relocation)? That informs how much negotiation room exists.
- Crime grade is F in this area — have there been break-ins, vandalism, or insurance claims at this property in the last 3 years? What carrier currently insures it and at what premium?
- The area grade is low — what's the realistic commute time and amenity access for the typical tenant pool here? Any planned neighborhood developments (good or bad) we should know about?
- What's the average days-on-market for RENTAL listings here right now (not sales)? A rising rental-DOM trend means longer vacancies and softer asking-rent achievability than the comps imply.
- What's the recent tenant-quality profile in this submarket — average credit score on applications, eviction rate, late-payment / NSF rate, and stable-employment percentage? A property-management company in the area should have these aggregated.
- How much new for-sale + rental construction is in the pipeline within 1–3 miles? Heavy new supply typically softens prices + rents 12–24 months out; constrained supply supports both.
Investment metrics
- 1% rule
- 0.88% ✗
- Cap rate
- 7.23%
- Cash-on-cash
- 3.35%
- DSCR
- 1.15
- GRM
- 9.5
CMA / ARV
- ARV (on-the-fly)
- $177,840
- Comps found
- 12
Show comp detail 12 sales within ~0.75 mi
| Address | Dist | Beds/Ba | Sqft | Sold | Price | $/sf | Match |
|---|---|---|---|---|---|---|---|
| 1206 Rice Ave | 0.12mi | 3/1.0 | 1,643 (+5%) | 4mo | $144,000 | $88 | 82 |
| 974 Richie Ave | 0.31mi | 3/1.5 | 1,464 (-6%) | 2mo | $175,000 | $120 | 71 |
| 956 Rice Ave | 0.24mi | 4/1.5 (+1) | 1,463 (-6%) | 1mo | $107,500 | $73 | 70 |
| 1150 Brice Ave | 0.24mi | 4/2.0 (+1) | 1,468 (-6%) | 1mo | $114,900 | $78 | 69 |
| 1600 Leland Ave | 0.47mi | 3/2.0 | 1,684 (+8%) | 1mo | $190,900 | $113 | 60 |
| 824 Rice Ave | 0.36mi | 4/2.0 (+1) | 1,667 (+7%) | 4mo | $28,000 | $17 | 60 |
| 931 Richie Ave | 0.39mi | 3/1.0 | 1,398 (-10%) | 8mo | $118,000 | $84 | 57 |
| 1721 Rice Ave | 0.71mi | 3/1.0 | 1,440 (-8%) | 1mo | $174,500 | $121 | 53 |
| 1004 Sherman Ave | 0.53mi | 3/2.0 | 1,408 (-10%) | 4mo | $195,200 | $139 | 51 |
| 1521 Oakland Pkwy | 0.56mi | 3/1.5 | 1,694 (+9%) | 8mo | $225,900 | $133 | 51 |
| 837 Runyan Ave | 0.64mi | 4/2.0 (+1) | 1,494 (-4%) | 9mo | $172,000 | $115 | 47 |
| 765 W O'connor Ave | 0.73mi | 3/2.0 | 1,401 (-10%) | 7mo | $160,000 | $114 | 39 |
Match score weights: distance 35% · size 25% · config 20% · recency 20%. Top-matched comps best support the ARV.
Projected returns pro-forma
-3.0% appreciation · 3.0% rent growth · sell at horizon
- IRR
- -11.1%
- Equity multiple
- 0.60×
- Total profit
- $-20,275
- Equity at exit
- $26,839
- IRR
- -1.9%
- Equity multiple
- 0.87×
- Total profit
- $-6,372
- Equity at exit
- $15,563
Cash invested: $50,400 (down + closing). Projections, not guarantees.
Landlord ↔ Tenant lean methodology
- Overall (STATE)
- 73 Landlord-Friendly
- State Ohio
- 73 Landlord-Friendly · R+6
- County
- — inherits STATE
- City
- — inherits STATE
ZIP-level market 45805
- Active inventory
- 106
- Price-to-rent
- 9.5×
Monthly cashflow live
- Estimated rent
- $1,579 high interval (Pro) →
- Mortgage (P&I)
- −$944
- Tax from tax record
- −$88 /mo · $1,056/yr
- Insurance
- −$75
- HOA
- −$0
- Vacancy / Maint / Mgmt
- −$332
- Net cashflow
- $141
Break-even live
Sensitivity live
| Price | -10% $242 | -5% $192 | +0% $141 | +5% $90 | +10% $39 |
|---|---|---|---|---|---|
| Rent | -10% $16 | -5% $78 | +0% $141 | +5% $203 | +10% $265 |
| Rate | -1.0pp $231 | -0.5pp $186 | base $141 | +0.5pp $94 | +1.0pp $46 |
UW: 25.0% down · 7.5% · 30yr · 1.5% tax · 5.0% vac · 8.0% maint · 8.0% mgmt
Financing live
Cash to close
- Down payment
- $45,000
- Closing costs
- $5,400
- Reserves months
- —
- Total cash needed
- —
Loan-product check · same deal, 3 products live
Conventional
25% down · 7.5% · 30yr
- Down + closing
- —
- Monthly P&I
- —
- Monthly cashflow
- —
- DSCR
- —
- Eligible?
- —
Personal DTI + credit; lowest rate.
DSCR
20% down · 8.5% · 30yr
- Down + closing
- —
- Monthly P&I
- —
- Monthly cashflow
- —
- DSCR
- —
- Eligible?
- —
No personal income docs; deal must DSCR.
Hard money
10% down · 12.0% · 12mo
- Down + closing
- —
- Monthly P&I
- —
- Monthly cashflow
- —
- DSCR
- —
- Eligible?
- —
Short-term bridge; refi at stabilization.
Rent comps 8 comps
| Address | Beds | Baths | Sqft | Rent | $/sqft | DOM | Units | Dist |
|---|---|---|---|---|---|---|---|---|
| 405 N Kenilworth Ave Lima, OH | 3.0 | 1.0 | 1352 | $1,795 | $1.33 | 45d | 1 | 0.36mi |
| 1436 W High St Lima, OH | 2.0 | 1.0 | 1205 | $895 | $0.74 | 45d | 1 | 0.58mi |
| 555 Haller St Lima, OH | 3.0 | 2.0 | 1953 | $1,700 | $0.87 | 45d | 1 | 0.60mi |
| 420 N Baxter St Lima, OH | 3.0 | 2.0 | 1386 | $1,200 | $0.87 | 45d | 1 | 0.63mi |
| 228 Nye St Lima, OH | 4.0 | 2.0 | 1686 | $675 | $0.40 | 45d | 1 | 0.99mi |
| 330 W Ashton Ave Lima, OH | 3.0 | 1.0 | 1288 | $2,000 | $1.55 | 45d | 1 | 1.03mi |
| 43 Town Sq Lima, OH | 2.0–3.0 | 1.0–2.0 | 1100 | $1,413 | $1.28 | 45d | 9 | 1.28mi |
| 608 S Primrose Pl Lima, OH | 3.0 | 2.0 | 1200 | $2,500 | $2.08 | 45d | 1 | 1.37mi |
Listing history 17 events
-
2026-06-19days on market $180,000 Active 14 DOM
-
2026-06-18days on market $180,000 Active 13 DOM
-
2026-06-17days on market $180,000 Active 12 DOM
-
2026-06-16days on market $180,000 Active 11 DOM
-
2026-06-15days on market $180,000 Active 10 DOM
-
2026-06-14days on market $180,000 Active 8 DOM
-
2026-06-12days on market $180,000 Active 7 DOM
-
2026-06-09days on market $180,000 Active 4 DOM
-
2026-06-08days on market $180,000 Active 3 DOM
-
2026-06-07days on market $180,000 Active 2 DOM
-
2026-06-07statusdays on market $180,000 Active 1 DOM
-
2026-06-04days on market $180,000 Coming Soon 4 DOM
-
2026-06-02days on market $180,000 Coming Soon 3 DOM
-
2026-06-01remarks 699-char remark
-
2026-06-01days on market $180,000 Coming Soon 2 DOM
-
2026-05-31remarks 356-char remark
-
2026-05-31$180,000 Coming Soon 1 DOM
ⓘ Source: listings_history table (triggers on properties + properties_extension) + one-shot
backfill from property_details.listing_events for pre-trigger history.
Tax reassessment forecast OH · Partial reset (capped growth)
- Current annual tax
- $1,056 · $88/mo
- Projected year-2 tax
- $1,932 · $161/mo
- Expected delta
- +$876/yr (+$73/mo · 83.0%)
ⓘ Screening estimate from a state-policy table — verify with the county assessor before closing.
Climate risk First Street
- Flood 1/10 Low FEMA zone X (unshaded) · 0% chance over 30 yrs
- Wildfire 1/10 Low
- Heat 3/10 Moderate 7 d/yr ≥100°F today · 18 d/yr by 30 yrs out
- Wind 2/10 Low
- Air quality 2/10 Low 1 unhealthy d/yr today · 2 by 30 yrs out
Nearby sold comps map
Loading sold comps map…
Walkable amenities ~0.75 mi
Loading nearby amenities…
Taxation est. · year 1
- Rental income
- $18,949
- − Mortgage interest
- −$10,083
- − Property taxes
- −$1,056
- − Insurance
- −$900
- − Repairs & maintenance
- −$1,516
- − Management
- −$1,516
- − Depreciation
- −$5,236
- Taxable loss
- −$1,358
- Est. tax savings @ 24.0%
- +$326
- After-tax cash flow
- $2,013/yr
For passive investors: Depreciation is non-cash, so a rental often shows a tax loss while cash-flowing — sheltering income. Rental losses are passive: they offset passive income freely, and up to $25,000/yr can offset ordinary (W-2) income if you actively participate and your MAGI is under $100k (phasing out to $0 by $150k); unused losses carry forward. On sale, claimed depreciation is recaptured at up to 25%, and gains may owe capital-gains tax (a 1031 exchange can defer both). Figures are a year-1 estimate at your 24.0% rate — not tax advice; consult a CPA.
Schools (NCES district)
- District
- Lima City
- NCES district ID
- 3904422
- Math proficiency
- 29% ▼ -13.00%
- Reading proficiency
- 36% ▼ -6.00%
- Median HH income
- $29,685
- Composite
- 26.31/100
- National rank
- #7243
- State rank
- #575 of 656 in OH
Livability — Lima
- Score
- 64/100
- State rank
- #787
- US rank
- #14288
Category grades
Schools grade is shown separately in the Schools card above.
Census & demographics
- Census place
- Lima, OH
- County
- Allen · 98,169 people
- City population
- 21,739
- Metro
- Lima, OH
- Population (ZIP)
- 24,746
- Household income
- $65,954
- Rent vs Own
- Severe rent burden
- 8.0
Population outlook (Allen County) Hauer SSP2
- Today (2025)
- 100,321 people
- By 2030
- 97,693 · -2.6%
- By 2040
- 91,802 · -8.5%
- By 2050
- 86,152 · -14.1%
- By 2075
- 73,659 · -26.6%
- By 2100
- 58,716 · -41.5%
Race, ethnicity, and origin ACS 2023
- Neighborhood character
- Predominantly White (74%)
- Race & ethnicity
- White 74% Black 15% Two or more races 6% Hispanic / Latino 4% Asian 1%
- Common ancestry
- Italian 2% Slovak 2% Romanian 2%
- Foreign-born
- 2% · Canada, Vietnam
- Languages at home
- 96% English-only · Spanish 1% Vietnamese 1%
Political lean MEDSL · Allen
- 2024 margin
- Solid R (+44.1) · D 27.5% · R 71.6%
- 2008→2024 swing
- -23.4pp toward R · 2008: -20.7pp · 2024: -44.1pp
- All cycles
- 2024: R+44.1 2020: R+39.5 2016: R+38.2 2012: R+25.7 2008: R+20.7
Not yet ingested
- Civics
- —
Market trends
- HPI YoY
- ▼ -156.78%
- Current HPI
- 210.6397
- Rent YoY
- —
- Metro
- —
- State GDP YoY
- ▲ 1.98%
- F500 in state
- 48
Industry mix (Fortune 500 HQ in OH)
| Industry | F500 HQs | Revenue |
|---|---|---|
| Insurance | 3 | $145B |
|
||
| Industrial Machinery | 3 | $49B |
|
||
| Financial Services | 3 | $24B |
|
||
| Consumer Goods | 2 | $93B |
|
||
| Aerospace / Defense | 2 | $47B |
|
||
| Utilities | 2 | $33B |
|
||
Price history
+150.0% since first listed5 events — show timeline
- 2026-05-30 Coming Soon $180,000 NORIS
- 2025-12-15 Sold (Public Records) $80,300 Public Records
- 2019-04-26 Sold (Public Records) $72,000 Public Records
- 2019-04-26 Sold (MLS) $72,000 WCARE
- 2018-09-19 Listed $72,000 WCARE
Property tax history
+4.8%/yrLatest (2025): $1,056 · +0.1% YoY. Source: county tax records.
Cash-flow waterfall
monthlySold comps — $/sqft
last 12 mo · ≤1 miLoading sold comps…