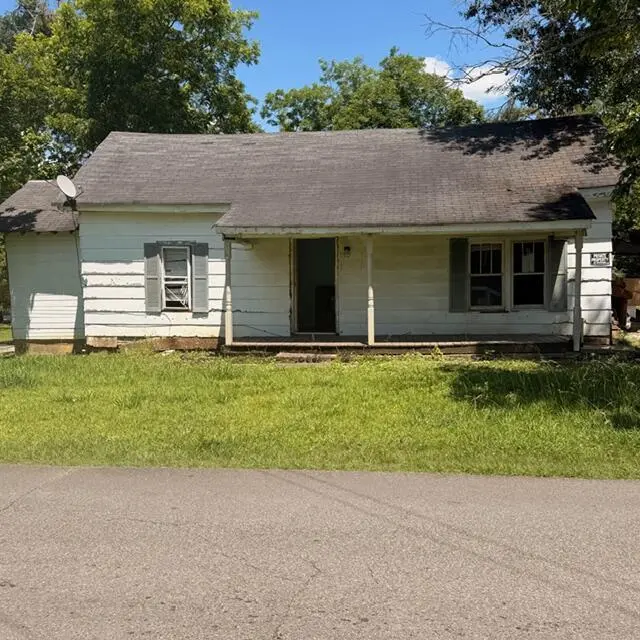
517 N College St · Booneville, MS
Flood risk 1/10 · Minimal
- FEMA flood zone
- X (unshaded)
- Chance of flooding over 30 yrs
- 0.0%
- Est. flood insurance / yr
- $507 – $1,088
Fire risk 4/10 · Minor
- Est. fire insurance / yr
- $1,241 – $2,305
Heat risk 6/10 · Moderate
- Hot days now (above 108°F)
- 7 days/yr
- Hot days in 30 yrs
- 19 days/yr
Wind risk 5/10 · Moderate
- Chance of severe wind over 30 yrs
- 23.0%
Air-quality risk 1/10 · Minimal
- Unhealthy air days now
- 0 days/yr
- Unhealthy air days in 30 yrs
- 0 days/yr
Risk factors via First Street. Map © Google.
Why this score? — see what drove the B- grade
The composite is a weighted blend of 9 inputs, each scored 0–100. Each bar is that input's sub-score; the figure is the points it added to the 100-point composite (weight × sub-score).
- Cash flow +30.0/30.0
- 1% rule +10.0/10.0
- DSCR +10.0/10.0
- ARV discount +7.5/15.0
- Schools +3.9/10.0
- Livability +3.2/5.0
- Rent growth +2.5/5.0
- Condition / age +2.5/5.0
- Appreciation +0.0/10.0
$25,000
🖨 Deal sheet 📄 Offer letter ✓ Due diligence
Listing remarks
Investor Special in Booneville! 2BR/2BA home located in the Booneville City School District. Being sold AS-IS, this property is perfect for investors, flippers, or buyers looking for their next renovation project. Great potential to add value and customize to your vision. Priced to sell--don't miss this opportunity!
Key facts
- 0.3 acre lot
- Built 1959
- Listed 6 days
Property features AI
Finance
- Financial info: Annual property tax approximately $654.71
Exterior
- Home design: Single-family residential property
- Exterior features: Asphalt roof; Lot approximately 0.3 acres; Lot dimensions about 105 x 125
Interior
- Bathrooms: 2 full bathrooms
- Interior features: Total of 4 rooms
Neighborhood map
What this means for you Summary
Snapshot
- This is a 2-bed/2.0-bath single-family listed at $25k.
Deal economics
- At list price, monthly cash flow is $594 ($7k/yr) — positive.
- The deal already cash-flows at list — no discount required.
- Meets the 1% rule at list price ($1k rent vs $25k).
Location & tenants
- Location reads 65/100 on livability (#117 in MS) — a middle-class / working-renter tenant base. Strengths: cost of living A+, housing A+; Watch: employment D+, crime D, amenities F.
- Booneville School District (town): math 49% / reading 46% proficiency, ranked #24 of 130 in MS (top 18%) — families likely to look elsewhere, expect single-tenant / working-renter base with shorter leases.
- Market conditions: 137 active listings in the ZIP; 1 comparable units currently listed for rent nearby; 11 units permitted in Prentiss County in 2024 (0 in 5+ unit buildings).
Forward outlook
- Local home prices are declining (-3.0%/yr); year-one equity from $173 of loan paydown is wiped out by about $750 of value loss. Plan a longer hold.
- Prentiss County population projected to shrink 6% by 2050 — rents likely to lag national; underwrite the cash flow, not the appreciation.
- At projected returns (-3.0% appreciation + 3.0% rent growth), your $7k cash investment doubles in ~2 years — after that, you're playing with house money.
Negotiation context
- Only 7 days on market — expect competitive offers; lowballing is unlikely to land.
Risks & watch-outs
- Watch-outs: property tax is 2.6% of price; built in 1959 — expect roof / HVAC / electrical / plumbing capex.
- Climate carrying-cost: moderate wind risk, 23% chance of damaging wind over 30y; extreme-heat days projected 7→19/yr by 2055 (HVAC capex compounding) — expect insurance premiums to compound above CPI over the hold.
Questions for the listing agent
- Built in 1959 — when were the roof, HVAC, electrical panel, plumbing, and water heater last replaced?
- Property tax is high relative to price — has the assessment been appealed recently, and will the sale trigger a re-assessment?
- Is there a deadline driving the sale (1031 exchange, divorce, estate, relocation)? That informs how much negotiation room exists.
- Crime grade is D in this area — have there been break-ins, vandalism, or insurance claims at this property in the last 3 years? What carrier currently insures it and at what premium?
- What's the average days-on-market for RENTAL listings here right now (not sales)? A rising rental-DOM trend means longer vacancies and softer asking-rent achievability than the comps imply.
- What's the recent tenant-quality profile in this submarket — average credit score on applications, eviction rate, late-payment / NSF rate, and stable-employment percentage? A property-management company in the area should have these aggregated.
- How much new for-sale + rental construction is in the pipeline within 1–3 miles? Heavy new supply typically softens prices + rents 12–24 months out; constrained supply supports both.
Investment metrics
- 1% rule
- 4.00% ✓
- Cap rate
- 34.80%
- Cash-on-cash
- 101.82%
- DSCR
- 5.53
- GRM
- 2.1
CMA / ARV
- ARV (on-the-fly)
- $132,704
- Comps found
- 1
Show comp detail 1 sale within ~0.75 mi
| Address | Dist | Beds/Ba | Sqft | Sold | Price | $/sf | Match |
|---|---|---|---|---|---|---|---|
| 305 Jackson | 0.60mi | 3/2.0 (+1) | 1,120 (-2%) | 19mo | $130,000 | $116 | 48 |
Match score weights: distance 35% · size 25% · config 20% · recency 20%. Top-matched comps best support the ARV.
Projected returns pro-forma
-3.0% appreciation · 3.0% rent growth · sell at horizon
- IRR
- —
- Equity multiple
- 5.83×
- Total profit
- $33,806
- Equity at exit
- $3,728
- IRR
- —
- Equity multiple
- 12.18×
- Total profit
- $78,265
- Equity at exit
- $2,162
Cash invested: $7,000 (down + closing). Projections, not guarantees.
Landlord ↔ Tenant lean methodology
- Overall (STATE)
- 90 Strongly Landlord-Friendly
- State Mississippi
- 90 Strongly Landlord-Friendly · R+11
- County
- — inherits STATE
- City
- — inherits STATE
ZIP-level market 38829
- Active inventory
- 137
- Price-to-rent
- 2.1×
Monthly cashflow live
- Estimated rent
- $1,000 medium interval (Pro) →
- Mortgage (P&I)
- −$131
- Tax from tax record
- −$55 /mo · $655/yr
- Insurance
- −$10
- HOA
- −$0
- Vacancy / Maint / Mgmt
- −$210
- Net cashflow
- $594
Break-even live
UW: 25.0% down · 7.5% · 30yr · 1.5% tax · 5.0% vac · 8.0% maint · 8.0% mgmt
Financing live
Cash to close
- Down payment
- $6,250
- Closing costs
- $750
- Reserves months
- —
- Total cash needed
- —
Loan-product check · same deal, 3 products live
Conventional
25% down · 7.5% · 30yr
- Down + closing
- —
- Monthly P&I
- —
- Monthly cashflow
- —
- DSCR
- —
- Eligible?
- —
Personal DTI + credit; lowest rate.
DSCR
20% down · 8.5% · 30yr
- Down + closing
- —
- Monthly P&I
- —
- Monthly cashflow
- —
- DSCR
- —
- Eligible?
- —
No personal income docs; deal must DSCR.
Hard money
10% down · 12.0% · 12mo
- Down + closing
- —
- Monthly P&I
- —
- Monthly cashflow
- —
- DSCR
- —
- Eligible?
- —
Short-term bridge; refi at stabilization.
Rent comps 1 comps
| Address | Beds | Baths | Sqft | Rent | $/sqft | DOM | Units | Dist |
|---|---|---|---|---|---|---|---|---|
| 106 Elm St Unit 1 Booneville, MS | 2.0 | 1.0 | 1095 | $1,000 | $0.91 | 43d | 1 | 0.58mi |
Listing history 7 events
-
2026-06-18days on market $25,000 Active 7 DOM
-
2026-06-17days on market $25,000 Active 6 DOM
-
2026-06-16days on market $25,000 Active 5 DOM
-
2026-06-15days on market $25,000 Active 4 DOM
-
2026-06-13days on market $25,000 Active 2 DOM
-
2026-06-12remarks 317-char remark
-
2026-06-12$25,000 Active 1 DOM
ⓘ Source: listings_history table (triggers on properties + properties_extension) + one-shot
backfill from property_details.listing_events for pre-trigger history.
Tax reassessment forecast MS · Resets to sale price
- Current annual tax
- $655 · $55/mo
- Projected year-2 tax
- $655 · $55/mo
- Expected delta
- $0/yr ($0/mo · 0.0%)
ⓘ Screening estimate from a state-policy table — verify with the county assessor before closing.
Climate risk First Street
- Flood 1/10 Low FEMA zone X (unshaded) · 0% chance over 30 yrs
- Wildfire 4/10 Moderate
- Heat 6/10 Major 7 d/yr ≥108°F today · 19 d/yr by 30 yrs out
- Wind 5/10 Major 23% chance of damaging wind over 30 yrs
- Air quality 1/10 Low 0 unhealthy d/yr today · 0 by 30 yrs out
Nearby sold comps map
Loading sold comps map…
Walkable amenities ~0.75 mi
Loading nearby amenities…
Taxation est. · year 1
- Rental income
- $12,000
- − Mortgage interest
- −$1,400
- − Property taxes
- −$655
- − Insurance
- −$125
- − Repairs & maintenance
- −$960
- − Management
- −$960
- − Depreciation
- −$727
- Taxable income
- $7,173
- Est. tax owed @ 24.0%
- −$1,721
- After-tax cash flow
- $5,406/yr
For passive investors: Depreciation is non-cash, so a rental often shows a tax loss while cash-flowing — sheltering income. Rental losses are passive: they offset passive income freely, and up to $25,000/yr can offset ordinary (W-2) income if you actively participate and your MAGI is under $100k (phasing out to $0 by $150k); unused losses carry forward. On sale, claimed depreciation is recaptured at up to 25%, and gains may owe capital-gains tax (a 1031 exchange can defer both). Figures are a year-1 estimate at your 24.0% rate — not tax advice; consult a CPA.
Schools (NCES district)
- District
- Booneville School District
- NCES district ID
- 2800820
- Math proficiency
- 49% ▼ -19.00%
- Reading proficiency
- 46% ▼ -10.00%
- Median HH income
- $29,722
- Composite
- 38.79/100
- National rank
- #4120
- State rank
- #24 of 130 in MS
Livability — Booneville
- Score
- 65/100
- State rank
- #117
- US rank
- #13203
Category grades
Schools grade is shown separately in the Schools card above.
Census & demographics
- Census place
- Booneville, MS
- City population
- 18,036
- Population (ZIP)
- 18,036
Population outlook (Prentiss County) Hauer SSP2
- Today (2025)
- 25,348 people
- By 2030
- 25,247 · -0.4%
- By 2040
- 24,786 · -2.2%
- By 2050
- 23,851 · -5.9%
- By 2075
- 20,434 · -19.4%
- By 2100
- 15,359 · -39.4%
Race, ethnicity, and origin ACS 2023
- Neighborhood character
- Predominantly White (83%)
- Race & ethnicity
- White 83% Black 10% Two or more races 3% Asian 3% Hispanic / Latino 1%
- Common ancestry
- Italian 3% Lithuanian 2% Slovak 1%
- Foreign-born
- 2% · China, South Korea
- Languages at home
- 97% English-only · Vietnamese 1% Tagalog/Filipino 1%
Political lean MEDSL · Prentiss
- 2024 margin
- Solid R (+66.0) · D 16.6% · R 82.7%
- 2008→2024 swing
- -23.2pp toward R · 2008: -42.8pp · 2024: -66.0pp
- All cycles
- 2024: R+66.0 2020: R+58.3 2016: R+56.5 2012: R+42.4 2008: R+42.8
Not yet ingested
- Civics
- —
Market trends
- HPI YoY
- ▼ -113.50%
- Current HPI
- 108.2429
- Rent YoY
- —
- Metro
- —
- State GDP YoY
- —
- F500 in state
- 0
Price history
2 events — show timeline
- 2026-06-09 Listed $25,000 NEMSBD
- 2005-01-07 Sold (Public Records) — Public Records
Property tax history
+13.3%/yrLatest (2024): $655 · +20.0% YoY. Source: county tax records.
Cash-flow waterfall
monthlySold comps — $/sqft
last 12 mo · ≤1 miLoading sold comps…