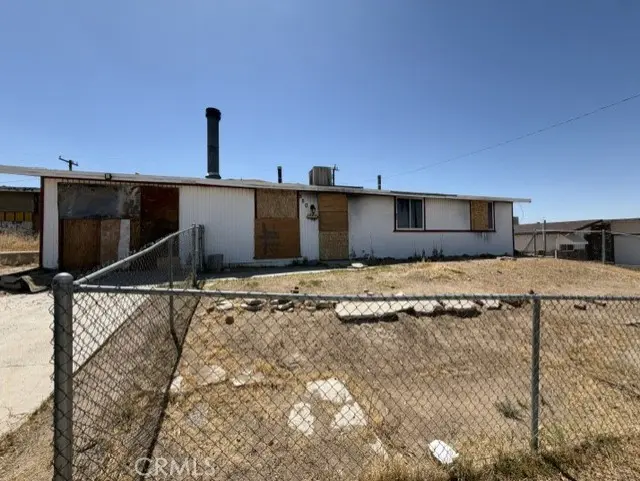
550 Frances · Barstow, CA
Flood risk 1/10 · Minimal
- FEMA flood zone
- X (unshaded)
- Chance of flooding over 30 yrs
- 0.0%
- Est. flood insurance / yr
- $507 – $1,088
Fire risk 3/10 · Minor
- Est. fire insurance / yr
- $659 – $1,223
Heat risk 8/10 · Major
- Hot days now (above 103°F)
- 5 days/yr
- Hot days in 30 yrs
- 15 days/yr
Wind risk 1/10 · Minimal
- Chance of severe wind over 30 yrs
- —
Air-quality risk 6/10 · Moderate
- Unhealthy air days now
- 11 days/yr
- Unhealthy air days in 30 yrs
- 15 days/yr
Risk factors via First Street. Map © Google.
Why this score? — see what drove the B- grade
The composite is a weighted blend of 9 inputs, each scored 0–100. Each bar is that input's sub-score; the figure is the points it added to the 100-point composite (weight × sub-score).
- Cash flow +30.0/30.0
- DSCR +10.0/10.0
- 1% rule +9.7/10.0
- ARV discount +7.5/15.0
- Livability +3.2/5.0
- Rent growth +3.1/5.0
- Condition / age +2.5/5.0
- Schools +1.4/10.0
- Appreciation +0.0/10.0
$105,000
🖨 Deal sheet (PDF) 📄 Offer letter ✓ Due diligence
Listing remarks MLS
This property was previously a beautifully laid-out 3 bedroom, 2 bathroom home before being damaged by fire. It is currently red-tagged and deemed uninhabitable. Investor Special Cash Only. Buyer to perform their own due diligence. Home offers great potential once rebuilt
Key facts
- 6,500 sq ft lot
- Garage
- Built 1956
Property features AI
Finance
- HOA & community: Community features include curbs and biking access; near BLM/National Forest
Exterior
- Parking: Attached garage (1 car); 2 uncovered parking spaces; Total of 3 parking spaces
- Utilities: Public sewer; District/public water
- Home design: Single-story; No accessory dwelling unit
- Construction: Year built per assessor; No shared/common walls
- Exterior features: House; No pool; Views
Interior
- Bedrooms: 3 bedrooms on the main level
- Bathrooms: 2 full bathrooms on the main level
- Heating & cooling: Evaporative cooling
- Interior features: One-level home; All bedrooms on the main level; Side-fence entry; Living room fireplace
- Laundry & utility: Laundry area in the garage
Neighborhood map
What this means for you Summary
Snapshot
- This is a 3-bed/2.0-bath single-family listed at $105k.
Deal economics
- At list price, monthly cash flow is $531 ($6k/yr) — positive.
- The deal already cash-flows at list — no discount required.
- Meets the 1% rule at list price ($2k rent vs $105k).
- Recommended offer: $103k (1.5% below list) — sets the bar for market timing.
- Cap rate 12.4% vs local median 4.6% in Barstow — top-decile yield for the area; either an underpriced asset or a hidden risk that comps aren't pricing in. Stress-test before assuming the spread holds.
Location & tenants
- Location reads 63/100 on livability (#444 in CA) — a middle-class / working-renter tenant base. Strengths: commute A+, housing A+; Watch: amenities C-, health & safety C-, schools F.
- Barstow Unified (town): math 11% / reading 22% proficiency, ranked #482 of 517 in CA (top 93%) — low school quality limits family demand, transient renter base, plan for 1-2y turnover; 68% free/reduced lunch — lower-income household profile, screen leases tightly.
- Market conditions: Rents rising (+2.3%/yr); 349 active listings in the ZIP; 27 comparable units currently listed for rent nearby; rentals at typical pace (median 25d on market — plan ~3-4 weeks tenant-placement turnaround); 5,458 units permitted in San Bernardino County in 2024 (1,500 in 5+ unit buildings).
Forward outlook
- Local home prices are declining (-3.0%/yr); year-one equity from $726 of loan paydown is wiped out by about $3k of value loss. Plan a longer hold.
- San Bernardino County population projected at +15% by 2050 — modest demand growth; plan on rents tracking national, not racing it.
- At projected returns (-3.0% appreciation + 2.3% rent growth), your $29k cash investment doubles in ~6 years — after that, you're playing with house money.
Negotiation context
- It's been on market 17 days — a 2% lower offer ($103k) is reasonable based on typical stale-listing flexibility.
- 2 sale attempts with the ask held roughly flat each time — persistent listings suggest the price (not the market) is what's stuck; bring a comps-based counter.
- Current owner paid $80k; 31% above their basis — modest negotiation headroom, anchor on the comps not their cost.
Risks & watch-outs
- Watch-outs: built in 1956 — expect roof / HVAC / electrical / plumbing capex.
- Climate carrying-cost: extreme-heat days projected 5→15/yr by 2055 (HVAC capex compounding) — expect insurance premiums to compound above CPI over the hold.
Questions for the listing agent
- Built in 1956 — when were the roof, HVAC, electrical panel, plumbing, and water heater last replaced?
- Is there a deadline driving the sale (1031 exchange, divorce, estate, relocation)? That informs how much negotiation room exists.
- Schools are F-rated, which usually means shorter tenancies and higher turnover. Who's the typical renter profile here, and what's been the actual vacancy rate?
- Crime grade is F in this area — have there been break-ins, vandalism, or insurance claims at this property in the last 3 years? What carrier currently insures it and at what premium?
- What's the average days-on-market for RENTAL listings here right now (not sales)? A rising rental-DOM trend means longer vacancies and softer asking-rent achievability than the comps imply.
- What's the recent tenant-quality profile in this submarket — average credit score on applications, eviction rate, late-payment / NSF rate, and stable-employment percentage? A property-management company in the area should have these aggregated.
- How much new for-sale + rental construction is in the pipeline within 1–3 miles? Heavy new supply typically softens prices + rents 12–24 months out; constrained supply supports both.
Investment metrics
- 1% rule
- 1.47% ✓
- Cap rate
- 12.36%
- Cash-on-cash
- 21.66%
- DSCR
- 1.96
- GRM
- 5.7
CMA / ARV
- ARV (on-the-fly)
- $253,116
- Comps found
- 12
Show comp detail 12 sales within ~0.75 mi
| Address | Dist | Beds/Ba | Sqft | Sold | Price | $/sf | Match |
|---|---|---|---|---|---|---|---|
| 540 Frances Dr | 0.01mi | 3/2.0 | 1,068 (0%) | 2mo | $237,000 | $222 | 97 |
| 700 Agnes | 0.17mi | 3/2.0 | 1,068 (0%) | 2mo | $269,999 | $253 | 90 |
| 601 Kathleen | 0.14mi | 3/1.5 | 1,096 (+3%) | 0mo | $260,000 | $237 | 87 |
| 571 Lillian | 0.20mi | 3/1.0 | 1,080 (+1%) | 0mo | $250,000 | $231 | 85 |
| 660 Kathleen Dr | 0.21mi | 3/1.0 | 1,014 (-5%) | 2mo | $158,400 | $156 | 77 |
| 621 Stevens | 0.27mi | 3/2.0 | 1,144 (+7%) | 2mo | $345,000 | $302 | 74 |
| 541 Frances Dr | 0.03mi | 3/2.0 | 1,228 (+15%) | 2mo | $275,000 | $224 | 72 |
| 840 E Virginia | 0.51mi | 3/2.0 | 1,038 (-3%) | 1mo | $279,900 | $270 | 70 |
| 610 S Muriel Dr | 0.10mi | 2/1.0 (-1) | 960 (-10%) | 1mo | $235,000 | $245 | 68 |
| 909 Las Amigas Dr | 0.56mi | 3/2.0 | 1,152 (+8%) | 2mo | $295,000 | $256 | 59 |
| 1429 Mesa | 0.71mi | 3/1.0 | 984 (-8%) | 2mo | $120,000 | $122 | 48 |
| 536 E Fredricks | 0.57mi | 3/1.0 | 944 (-12%) | 4mo | $185,000 | $196 | 47 |
Match score weights: distance 35% · size 25% · config 20% · recency 20%. Top-matched comps best support the ARV.
Projected returns pro-forma
-3.0% appreciation · 2.32% rent growth · sell at horizon
- IRR
- 13.5%
- Equity multiple
- 1.54×
- Total profit
- $15,737
- Equity at exit
- $15,656
- IRR
- 21.8%
- Equity multiple
- 2.80×
- Total profit
- $52,984
- Equity at exit
- $9,078
Cash invested: $29,400 (down + closing). Projections, not guarantees.
Landlord ↔ Tenant lean methodology
- Overall (STATE)
- 18 Strongly Tenant-Friendly
- State California
- 18 Strongly Tenant-Friendly · D+13
- County
- — inherits STATE
- City
- — inherits STATE
ZIP-level market 92311
- Home prices YoY
- -30.6%
- Rents YoY
- 2.3%
- Active inventory
- 349
- Price-to-rent
- 5.7×
Monthly cashflow live
- Estimated rent
- $1,541 high interval (Pro) →
- Mortgage (P&I)
- −$551
- Tax from tax record
- −$92 /mo · $1,108/yr
- Insurance
- −$44
- HOA
- −$0
- Vacancy / Maint / Mgmt
- −$324
- Net cashflow
- $531
Break-even live
Sensitivity live
| Price | -10% $590 | -5% $560 | +0% $531 | +5% $501 | +10% $471 |
|---|---|---|---|---|---|
| Rent | -10% $409 | -5% $470 | +0% $531 | +5% $592 | +10% $652 |
| Rate | -1.0pp $584 | -0.5pp $557 | base $531 | +0.5pp $503 | +1.0pp $476 |
UW: 25.0% down · 7.5% · 30yr · 1.5% tax · 5.0% vac · 8.0% maint · 8.0% mgmt
Financing live
Cash to close
- Down payment
- $26,250
- Closing costs
- $3,150
- Reserves months
- —
- Total cash needed
- —
Loan-product check · same deal, 3 products live
Conventional
25% down · 7.5% · 30yr
- Down + closing
- —
- Monthly P&I
- —
- Monthly cashflow
- —
- DSCR
- —
- Eligible?
- —
Personal DTI + credit; lowest rate.
DSCR
20% down · 8.5% · 30yr
- Down + closing
- —
- Monthly P&I
- —
- Monthly cashflow
- —
- DSCR
- —
- Eligible?
- —
No personal income docs; deal must DSCR.
Hard money
10% down · 12.0% · 12mo
- Down + closing
- —
- Monthly P&I
- —
- Monthly cashflow
- —
- DSCR
- —
- Eligible?
- —
Short-term bridge; refi at stabilization.
Rent comps 27 comps
| Address | Beds | Baths | Sqft | Rent | $/sqft | DOM | Units | Dist |
|---|---|---|---|---|---|---|---|---|
| 650 S Muriel Dr Barstow, CA | 3.0 | 1.0 | 1320 | $1,625 | $1.23 | 25d | 1 | 0.16mi |
| 313 Maxine Ave Barstow, CA | 2.0 | 1.0 | 700 | $1,400 | $2.00 | 13d | 1 | 0.21mi |
| 945 Carson St Barstow, CA | 2.0 | 1.0 | 800 | $1,300 | $1.62 | 44d | 1 | 0.27mi |
| 937 E Elizabeth St Barstow, CA | 4.0 | 1.0 | 1422 | $2,195 | $1.54 | 5d | 1 | 0.40mi |
| 755 E Virginia Way Barstow, CA | 1.0–2.0 | 1.0–2.0 | 889 | $1,295 | $1.46 | 0d | 1 | 0.47mi |
| 615 E Virginia Way Barstow, CA | 2.0 | 1.0 | 755 | $1,036 | $1.37 | 0d | 1 | 0.58mi |
| 628 E Virginia Way Unit D Barstow, CA | 2.0 | 1.0 | 848 | $1,095 | $1.29 | 6d | 1 | 0.62mi |
| 310 N 3rd Ave Barstow, CA | 3.0 | 1.0 | 862 | $1,500 | $1.74 | 25d | 1 | 0.82mi |
| 411 S 1st Ave Barstow, CA | 2.0 | 1.0 | 800 | $1,125 | $1.41 | 44d | 1 | 0.85mi |
| 332 Date Ave Barstow, CA | 4.0 | 2.0 | 1144 | $1,950 | $1.70 | 44d | 1 | 0.86mi |
| 100 E Fredricks St Barstow, CA | 2.0 | 1.0 | 1100 | $1,195 | $1.09 | 25d | 1 | 0.89mi |
| 200 E Elizabeth St Barstow, CA | 3.0 | 1.0 | 1096 | $1,700 | $1.55 | 25d | 1 | 0.89mi |
| 820 S 2nd Ave Barstow, CA | 2.0 | 1.0 | 855 | $1,350 | $1.58 | 44d | 1 | 0.95mi |
| 149 W Buena Vista St Unit 149-C Barstow, CA | 2.0 | 1.0 | 750 | $1,395 | $1.86 | 44d | 1 | 0.96mi |
| 211 W Buena Vista St Barstow, CA | 3.0 | 2.0 | 1434 | $2,000 | $1.39 | 25d | 1 | 1.04mi |
| 720 Mount Vernon Ave Barstow, CA | 2.0 | 1.0 | 1172 | $1,296 | $1.11 | 13d | 1 | 1.06mi |
| 1140 Deseret Ave Unit A Barstow, CA | 3.0 | 2.0 | 1270 | $1,550 | $1.22 | 44d | 1 | 1.10mi |
| 751 Upton Dr Unit 2 Barstow, CA | 2.0 | 1.0 | 800 | $1,295 | $1.62 | 19d | 1 | 1.11mi |
| 761 Upton Dr Unit C Barstow, CA | 2.0 | 1.0 | 800 | $1,199 | $1.50 | 6d | 1 | 1.12mi |
| 1900 Dill Rd Barstow, CA | 1.0–3.0 | 1.0–2.0 | 892 | $1,505 | $1.69 | 0d | 8 | 1.14mi |
| 810 Starlight St Barstow, CA | 3.0 | 2.0 | 1430 | $1,895 | $1.33 | 44d | 1 | 1.17mi |
| 127 May Ave Barstow, CA | 3.0 | 1.0 | 1086 | $1,300 | $1.20 | 25d | 1 | 1.18mi |
| 1061 May Ln Barstow, CA | 2.0 | 1.0 | 900 | $1,295 | $1.44 | 12d | 1 | 1.26mi |
| 1040 May Ln Unit 15 Barstow, CA | 2.0 | 2.0 | 875 | $1,295 | $1.48 | 44d | 1 | 1.29mi |
| 251 Juniper St Unit A Barstow, CA | 2.0 | 1.0 | 1464 | $1,350 | $0.92 | 44d | 1 | 1.31mi |
| 920 Flora St Barstow, CA | 3.0 | 1.0 | 1064 | $1,399 | $1.31 | 44d | 1 | 1.46mi |
| 960 Nancy St Barstow, CA | 3.0 | 1.0 | 1118 | $1,750 | $1.57 | 24d | 1 | 1.50mi |
Listing history 11 events
-
2026-06-21days on market $105,000 Active 17 DOM
-
2026-06-18days on market $105,000 Active 14 DOM
-
2026-06-17days on market $105,000 Active 13 DOM
-
2026-06-16days on market $105,000 Active 12 DOM
-
2026-06-15days on market $105,000 Active 11 DOM
-
2026-06-13days on market $105,000 Active 9 DOM
-
2026-06-13days on market $105,000 Active 8 DOM
-
2026-06-09days on market $105,000 Active 5 DOM
-
2026-06-08days on market $105,000 Active 4 DOM
-
2026-06-07remarks 326-char remark
-
2026-06-07$105,000 Active 3 DOM
ⓘ Source: listings_history table (triggers on properties + properties_extension) + one-shot
backfill from property_details.listing_events for pre-trigger history.
Tax reassessment forecast CA · Resets to sale price
- Current annual tax
- $1,108 · $92/mo
- Projected year-2 tax
- $1,108 · $92/mo
- Expected delta
- $0/yr ($0/mo · 0.0%)
ⓘ Screening estimate from a state-policy table — verify with the county assessor before closing.
Climate risk First Street
- Flood 1/10 Low FEMA zone X (unshaded) · 0% chance over 30 yrs
- Wildfire 3/10 Moderate
- Heat 8/10 Severe 5 d/yr ≥103°F today · 15 d/yr by 30 yrs out
- Wind 1/10 Low
- Air quality 6/10 Major 11 unhealthy d/yr today · 15 by 30 yrs out
Nearby sold comps map
Loading sold comps map…
Walkable amenities ~0.75 mi
Loading nearby amenities…
Taxation est. · year 1
- Rental income
- $18,493
- − Mortgage interest
- −$5,882
- − Property taxes
- −$1,108
- − Insurance
- −$525
- − Repairs & maintenance
- −$1,479
- − Management
- −$1,479
- − Depreciation
- −$3,055
- Taxable income
- $4,964
- Est. tax owed @ 24.0%
- −$1,191
- After-tax cash flow
- $5,177/yr
For passive investors: Depreciation is non-cash, so a rental often shows a tax loss while cash-flowing — sheltering income. Rental losses are passive: they offset passive income freely, and up to $25,000/yr can offset ordinary (W-2) income if you actively participate and your MAGI is under $100k (phasing out to $0 by $150k); unused losses carry forward. On sale, claimed depreciation is recaptured at up to 25%, and gains may owe capital-gains tax (a 1031 exchange can defer both). Figures are a year-1 estimate at your 24.0% rate — not tax advice; consult a CPA.
Schools (NCES district)
- District
- Barstow Unified
- NCES district ID
- 0604020
- Math proficiency
- 11% ▼ -7.00%
- Reading proficiency
- 22% ▼ -7.00%
- Median HH income
- $44,505
- Composite
- 14.44/100
- National rank
- #9430
- State rank
- #482 of 517 in CA
Livability — Barstow
- Score
- 63/100
- State rank
- #444
- US rank
- #15099
Category grades
Schools grade is shown separately in the Schools card above.
Census & demographics
- Census place
- Barstow, CA
- County
- San Bernardino County · 2,030,291 people
- City population
- 33,954
- Metro
- Riverside-San Bernardino-Ontario, CA
- Population (ZIP)
- 33,954
- Household income
- $61,862
- Rent vs Own
- Severe rent burden
- 1305.0
Population outlook (San Bernardino County) Hauer SSP2
- Today (2025)
- 2,300,329 people
- By 2030
- 2,378,907 · +3.4%
- By 2040
- 2,523,137 · +9.7%
- By 2050
- 2,642,388 · +14.9%
- By 2075
- 2,880,769 · +25.2%
- By 2100
- 2,909,436 · +26.5%
Race, ethnicity, and origin ACS 2023
- Neighborhood character
- Diverse neighborhood (Simpson 0.68)
- Race & ethnicity
- Hispanic / Latino 46% White 29% Two or more races 22% Black 15% Native American 3% Asian 2% Pacific Islander 1%
- Hispanic origin (detail)
- Mexican 39% Puerto Rican 2%
- Common ancestry
- Portuguese 1% Lithuanian 1% Italian 1%
- Foreign-born
- 9% · Canada, South Korea
- Languages at home
- 77% English-only · Spanish 20% Tagalog/Filipino 1% Other Indo-European 1%
Political lean MEDSL · San Bernardino
- 2024 margin
- Toss-up / Even · D 47.5% · R 49.7% · Other 2.8%
- 2008→2024 swing
- -8.5pp toward R · 2008: 6.3pp · 2024: -2.1pp
- All cycles
- 2024: R+2.1 2020: D+10.7 2016: D+9.8 2012: D+5.4 2008: D+6.3
Not yet ingested
- Civics
- —
Market trends
- HPI YoY
- ▼ -139.26%
- Current HPI
- 316.4858
- Rent YoY
- ▲ 2.32%
- Metro
- Riverside-San Bernardino-Ontario, CA
- State GDP YoY
- ▲ 3.21%
- F500 in state
- 116
Industry mix (Fortune 500 HQ in CA)
| Industry | F500 HQs | Revenue |
|---|---|---|
| Technology | 27 | $1,492B |
|
||
| Financial Services | 3 | $174B |
|
||
| Retail | 3 | $44B |
|
||
| Insurance | 3 | $26B |
|
||
| Media / Entertainment | 2 | $115B |
|
||
| Pharmaceuticals / Biotech | 2 | $62B |
|
||
Price history
+56.7% since first listed7 events — show timeline
- 2026-06-04 Listed $105,000 CRMLS
- 2025-08-15 Sold (MLS) $80,000 TheMLS
- 2025-07-17 Pending — TheMLS
- 2025-05-28 Listed $75,000 TheMLS
- 2017-09-27 Sold (Public Records) $85,000 Public Records
- 2012-09-13 Sold (MLS) $28,250 CRMLS
- 1996-06-14 Sold (Public Records) $67,000 Public Records
Property tax history
+1.4%/yrLatest (2025): $1,108 · -51.2% YoY. Source: county tax records.
Cash-flow waterfall
monthlySold comps — $/sqft
last 12 mo · ≤1 miLoading sold comps…