556 Bull Lake Cir · Niederwald, TX
Flood risk No data
- FEMA flood zone
- —
- Chance of flooding over 30 yrs
- —
- Est. flood insurance / yr
- —
Fire risk No data
- Est. fire insurance / yr
- —
Heat risk No data
- Hot days now (above threshold)
- —
- Hot days in 30 yrs
- —
Wind risk No data
- Chance of severe wind over 30 yrs
- —
Air-quality risk No data
- Unhealthy air days now
- —
- Unhealthy air days in 30 yrs
- —
Risk factors via First Street. Map © Google.
Why this score? — see what drove the D- grade
The composite is a weighted blend of 9 inputs, each scored 0–100. Each bar is that input's sub-score; the figure is the points it added to the 100-point composite (weight × sub-score).
- Cash flow +13.4/30.0
- ARV discount +7.5/15.0
- DSCR +4.0/10.0
- Schools +3.5/10.0
- 1% rule +3.1/10.0
- Livability +2.9/5.0
- Condition / age +2.5/5.0
- Rent growth +2.1/5.0
- Appreciation +0.0/10.0
$290,990
🖨 Deal sheet (PDF) 📄 Offer letter ✓ Due diligence
Listing remarks
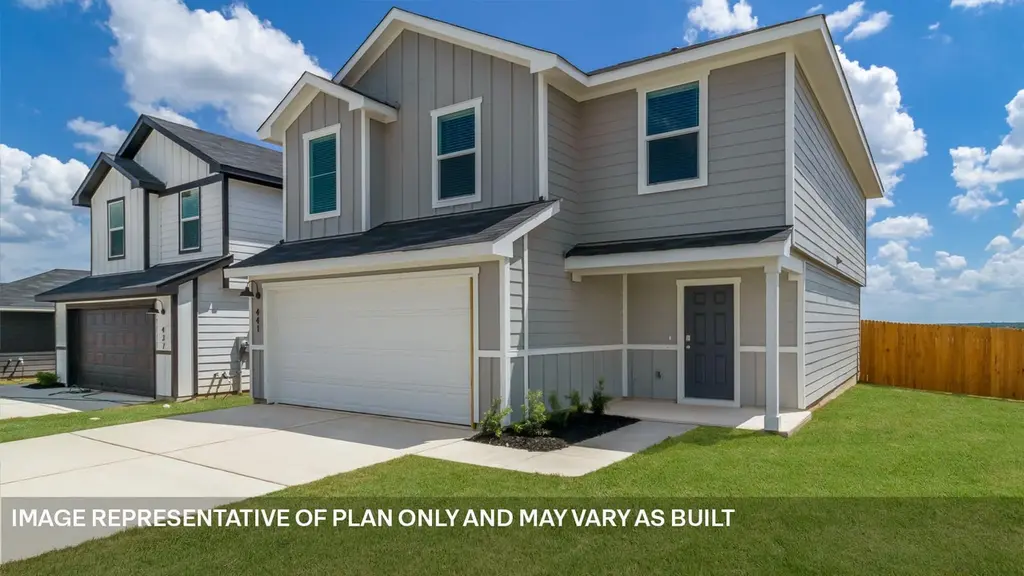
ESTIMATED COMPLETION MAY. Images representative of plan only and may vary when built. The Franklin is a two-story home in our Prairies Lakes community that offers 1,892 square feet of living space, 5 bedrooms with 2.5 bathrooms. As you walk into the home you will find yourself in a spacious foyer leading to the living space. The first floor of the home is an open concept space that includes the kitchen, dining room, and living room. Heading upstairs you’ll find the laundry room along with the 4 secondary bedrooms and full bath. The main bedroom, Bedroom 1, is also on the second story and features a spacious ensuite and a vast walk-in closet that is sure to impress. This home comes inc
Key facts
- Vast walk-in closet
- Open concept space
- Laundry room
Tags
Neighborhood map
What this means for you Summary
Snapshot
- This is a 5-bed/2.5-bath land listed at $291k.
Deal economics
- At list price, monthly cash flow is $7 ($81/yr) — positive.
- The deal already cash-flows at list — no discount required.
- To meet the 1% rule (rent ≥ 1% of price), the offer needs to be $236k (19.0% below list).
- Recommended offer: $236k (19.0% below list) — sets the bar for 1% rule.
- Cap rate 6.3% vs local median 4.5% in Niederwald — top-decile yield for the area; either an underpriced asset or a hidden risk that comps aren't pricing in. Stress-test before assuming the spread holds.
Location & tenants
- Location reads 58/100 on livability (#1,198 in TX) — a working-class tenant base; expect higher turnover. Strengths: cost of living A+, housing A+, employment B; Watch: schools F, crime D-, amenities F.
- Hays CISD (rural): math 35% / reading 41% proficiency, ranked #390 of 826 in TX (top 47%) — families likely to look elsewhere, expect single-tenant / working-renter base with shorter leases.
- Market conditions: Rents soft (-1.8%/yr); 1002 active listings in the ZIP; 1 comparable units currently listed for rent nearby; high-income renter base; 5,270 units permitted in Hays County in 2024 (1,464 in 5+ unit buildings).
Forward outlook
- Local home prices are declining (-3.0%/yr); year-one equity from $2k of loan paydown is wiped out by about $9k of value loss. Plan a longer hold.
- Hays County population projected at +93% by 2050 — long-run rental-demand tailwind backs the buy-and-hold thesis.
Negotiation context
- Only 4 days on market — expect competitive offers; lowballing is unlikely to land.
Questions for the listing agent
- What does the HOA fee cover, when was the last increase, and are there any pending special assessments or reserve-fund shortfalls?
- Is there a deadline driving the sale (1031 exchange, divorce, estate, relocation)? That informs how much negotiation room exists.
- Schools are F-rated, which usually means shorter tenancies and higher turnover. Who's the typical renter profile here, and what's been the actual vacancy rate?
- Crime grade is D in this area — have there been break-ins, vandalism, or insurance claims at this property in the last 3 years? What carrier currently insures it and at what premium?
- The area grade is low — what's the realistic commute time and amenity access for the typical tenant pool here? Any planned neighborhood developments (good or bad) we should know about?
- What's the average days-on-market for RENTAL listings here right now (not sales)? A rising rental-DOM trend means longer vacancies and softer asking-rent achievability than the comps imply.
- What's the recent tenant-quality profile in this submarket — average credit score on applications, eviction rate, late-payment / NSF rate, and stable-employment percentage? A property-management company in the area should have these aggregated.
- How much new for-sale + rental construction is in the pipeline within 1–3 miles? Heavy new supply typically softens prices + rents 12–24 months out; constrained supply supports both.
Investment metrics
- 1% rule
- 0.81% ✗
- Cap rate
- 6.32%
- Cash-on-cash
- 0.10%
- DSCR
- 1.00
- GRM
- 10.3
CMA / ARV
No comps found within radius.
Projected returns pro-forma
-3.0% appreciation · 0.0% rent growth · sell at horizon
- IRR
- -19.3%
- Equity multiple
- 0.34×
- Total profit
- $-53,691
- Equity at exit
- $43,388
- IRR
- -19.2%
- Equity multiple
- 0.10×
- Total profit
- $-73,144
- Equity at exit
- $25,159
Cash invested: $81,477 (down + closing). Projections, not guarantees.
Landlord ↔ Tenant lean methodology
- Overall (STATE)
- 87 Strongly Landlord-Friendly
- State Texas
- 87 Strongly Landlord-Friendly · R+5
- County
- — inherits STATE
- City
- — inherits STATE
ZIP-level market 78610
- Rents YoY
- -1.8%
- Active inventory
- 1002
- Price-to-rent
- 10.3×
Monthly cashflow live
- Estimated rent
- $2,358 medium interval (Pro) →
- Mortgage (P&I)
- −$1,526
- Tax from tax record
- −$129 /mo · $1,543/yr
- Insurance
- −$121
- HOA
- −$80
- Vacancy / Maint / Mgmt
- −$495
- Net cashflow
- $7
Break-even live
Sensitivity live
| Price | -10% $171 | -5% $89 | +0% $7 | +5% $-76 | +10% $-158 |
|---|---|---|---|---|---|
| Rent | -10% $-179 | -5% $-86 | +0% $7 | +5% $100 | +10% $193 |
| Rate | -1.0pp $153 | -0.5pp $81 | base $7 | +0.5pp $-69 | +1.0pp $-145 |
UW: 25.0% down · 7.5% · 30yr · 1.5% tax · 5.0% vac · 8.0% maint · 8.0% mgmt
Financing live
Cash to close
- Down payment
- $72,748
- Closing costs
- $8,730
- Reserves months
- —
- Total cash needed
- —
Loan-product check · same deal, 3 products live
Conventional
25% down · 7.5% · 30yr
- Down + closing
- —
- Monthly P&I
- —
- Monthly cashflow
- —
- DSCR
- —
- Eligible?
- —
Personal DTI + credit; lowest rate.
DSCR
20% down · 8.5% · 30yr
- Down + closing
- —
- Monthly P&I
- —
- Monthly cashflow
- —
- DSCR
- —
- Eligible?
- —
No personal income docs; deal must DSCR.
Hard money
10% down · 12.0% · 12mo
- Down + closing
- —
- Monthly P&I
- —
- Monthly cashflow
- —
- DSCR
- —
- Eligible?
- —
Short-term bridge; refi at stabilization.
Rent comps 1 comps
| Address | Beds | Baths | Sqft | Rent | $/sqft | DOM | Units | Dist |
|---|---|---|---|---|---|---|---|---|
| 143 Santa Teresa Rd Kyle, TX | 4.0 | 2.5 | 2042 | $2,500 | $1.22 | 44d | 1 | 0.38mi |
HOA detail
- Monthly dues
- $80 · $960/yr
Listing history 2 events
-
2026-03-20status Pending
-
2026-03-16$290,990 Active
ⓘ Source: listings_history table (triggers on properties + properties_extension) + one-shot
backfill from property_details.listing_events for pre-trigger history.
Tax reassessment forecast TX · Resets to sale price
- Current annual tax
- $1,543 · $129/mo
- Projected year-2 tax
- $5,325 · $444/mo
- Expected delta
- +$3,782/yr (+$315/mo · 245.1%)
ⓘ Screening estimate from a state-policy table — verify with the county assessor before closing.
Nearby sold comps map
Loading sold comps map…
Walkable amenities ~0.75 mi
Loading nearby amenities…
Taxation est. · year 1
- Rental income
- $28,292
- − Mortgage interest
- −$16,300
- − Property taxes
- −$1,543
- − Insurance
- −$1,455
- − Repairs & maintenance
- −$2,263
- − Management
- −$2,263
- − HOA
- −$960
- − Depreciation
- −$8,465
- Taxable loss
- −$4,958
- Est. tax savings @ 24.0%
- +$1,190
- After-tax cash flow
- $1,271/yr
For passive investors: Depreciation is non-cash, so a rental often shows a tax loss while cash-flowing — sheltering income. Rental losses are passive: they offset passive income freely, and up to $25,000/yr can offset ordinary (W-2) income if you actively participate and your MAGI is under $100k (phasing out to $0 by $150k); unused losses carry forward. On sale, claimed depreciation is recaptured at up to 25%, and gains may owe capital-gains tax (a 1031 exchange can defer both). Figures are a year-1 estimate at your 24.0% rate — not tax advice; consult a CPA.
Schools (NCES district)
- District
- Hays CISD
- NCES district ID
- 4800010
- Math proficiency
- 35% ▼ -15.00%
- Reading proficiency
- 41% ▼ -5.00%
- Median HH income
- $70,570
- Composite
- 34.78/100
- National rank
- #5118
- State rank
- #390 of 826 in TX
Livability — Niederwald
- Score
- 58/100
- State rank
- #1198
- US rank
- #20995
Category grades
Schools grade is shown separately in the Schools card above.
Census & demographics
- County
- Hays County · 280,138 people
- Metro
- Austin-Round Rock-Georgetown, TX
- Population (ZIP)
- 48,319
- Household income
- $119,698
- Rent vs Own
- Severe rent burden
- 611.0
Population outlook (Hays County) Hauer SSP2
- Today (2025)
- 286,948 people
- By 2030
- 336,923 · +17.4%
- By 2040
- 441,894 · +54.0%
- By 2050
- 553,462 · +92.9%
- By 2075
- 838,261 · +192.1%
- By 2100
- 1,063,658 · +270.7%
Race, ethnicity, and origin ACS 2023
- Neighborhood character
- Diverse neighborhood (Simpson 0.58)
- Race & ethnicity
- White 49% Hispanic / Latino 42% Two or more races 17% Black 4% Asian 2%
- Hispanic origin (detail)
- Mexican 35%
- Common ancestry
- Italian 2% Romanian 2% Lithuanian 2%
- Foreign-born
- 10% · Canada, Jamaica, South Korea
- Languages at home
- 76% English-only · Spanish 20% Arabic 2% Other Indo-European 1%
Political lean MEDSL · Hays
- 2024 margin
- Lean D (+5.7) · D 52.1% · R 46.5% · Other 1.4%
- 2008→2024 swing
- +7.7pp toward D · 2008: -2.0pp · 2024: 5.7pp
- All cycles
- 2024: D+5.7 2020: D+10.8 2016: R+0.9 2012: R+10.4 2008: R+2.0
Not yet ingested
- Civics
- —
Market trends
- HPI YoY
- ▼ -161.50%
- Current HPI
- 220.6824
- Rent YoY
- ▼ -1.80%
- Metro
- Austin-Round Rock-Georgetown, TX
- State GDP YoY
- ▲ 3.95%
- F500 in state
- 110
Industry mix (Fortune 500 HQ in TX)
| Industry | F500 HQs | Revenue |
|---|---|---|
| Energy | 16 | $1,198B |
|
||
| Technology | 5 | $198B |
|
||
| Engineering / Construction | 4 | $72B |
|
||
| Energy Services | 3 | $60B |
|
||
| Utilities | 3 | $41B |
|
||
| Healthcare | 2 | $330B |
|
||
Price history
2 events — show timeline
- 2026-03-20 Pending — Unlock MLS
- 2026-03-16 Listed $290,990 Unlock MLS
Property tax history
+61.1%/yrLatest (2025): $1,543 · +61.1% YoY. Source: county tax records.
Cash-flow waterfall
monthlySold comps — $/sqft
last 12 mo · ≤1 miLoading sold comps…