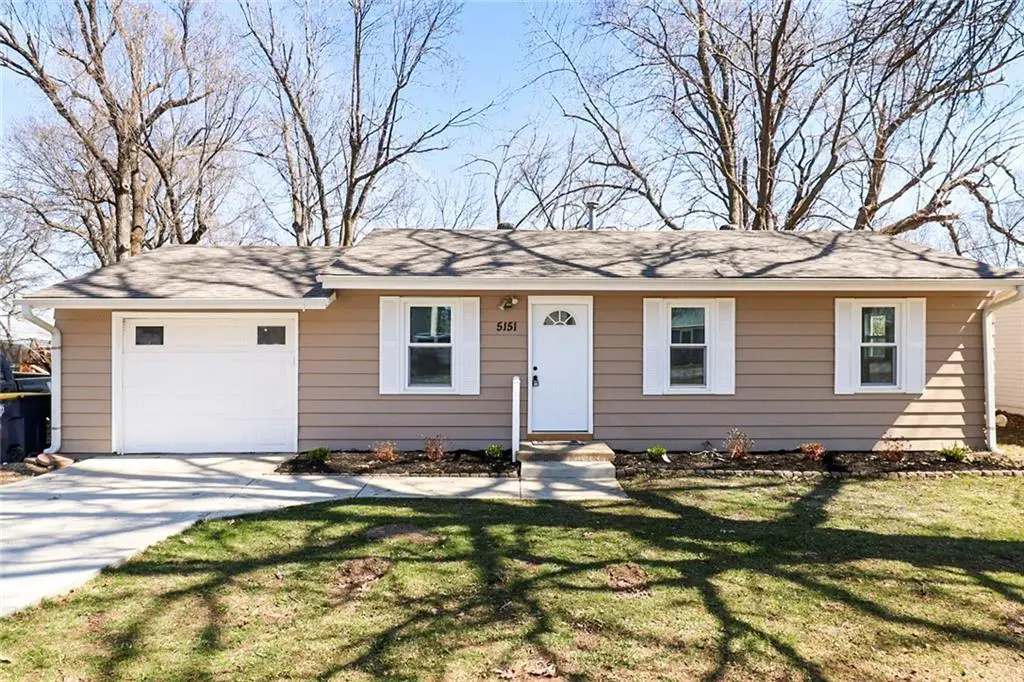
5151 N Winchester Ave · Kansas City, MO
Flood risk 1/10 · Minimal
- FEMA flood zone
- X (unshaded)
- Chance of flooding over 30 yrs
- 0.0%
- Est. flood insurance / yr
- $507 – $1,088
Fire risk 1/10 · Minimal
- Est. fire insurance / yr
- $1,054 – $1,958
Heat risk 4/10 · Minor
- Hot days now (above 107°F)
- 7 days/yr
- Hot days in 30 yrs
- 16 days/yr
Wind risk 2/10 · Minimal
- Chance of severe wind over 30 yrs
- —
Air-quality risk 3/10 · Minor
- Unhealthy air days now
- 2 days/yr
- Unhealthy air days in 30 yrs
- 3 days/yr
Risk factors via First Street. Map © Google.
Why this score? — see what drove the D grade
The composite is a weighted blend of 9 inputs, each scored 0–100. Each bar is that input's sub-score; the figure is the points it added to the 100-point composite (weight × sub-score).
- Cash flow +16.3/30.0
- DSCR +5.0/10.0
- Rent growth +4.0/5.0
- Livability +3.9/5.0
- Schools +3.8/10.0
- 1% rule +3.7/10.0
- ARV discount +2.9/15.0
- Condition / age +2.5/5.0
- Appreciation +0.0/10.0
$199,999
🖨 Deal sheet (PDF) 📄 Offer letter ✓ Due diligence
Listing remarks
Welcome to 5151 N Winchester Ave — where modern updates meet move-in ready convenience! This beautifully remodeled home has been completely updated offering the feel of a brand-new home without the new construction price tag. Step inside to find all-new flooring throughout, stunning granite countertops, updated cabinetry, and countless additional upgrades that make this home truly shine. Outside, enjoy a fully fenced backyard featuring a brand-new concrete patio, perfect for grilling, entertaining guests, or simply relaxing outdoors. Whether you’re a first-time buyer or looking to upgrade, this home delivers style, comfort, and value in one complete package. Don’t miss you
Key facts
- All-new flooring
- Updated cabinetry
- 0.26 acre lot
Tags
Property features AI
Finance
- Other: Living area reported as 816; Estimated age: 51-75 years
- HOA & community: No association fees
Exterior
- Parking: Attached 1-car garage
- Utilities: Public water; Public sewer
- Home design: Single-family residence; Residential property type
- Construction: Vinyl siding; Composition roof
- Exterior features: Lot is approximately 0.26 acres; Not in a flood plain
Interior
- Bedrooms: 3 bedrooms
- Bathrooms: 1 full bathroom
- Heating & cooling: Natural gas heating; Electric air conditioning
- Interior features: Ranch floor plan; Crawl space basement
Neighborhood map
What this means for you Summary
Snapshot
- This is a 3-bed/1.0-bath single-family listed at $200k.
Deal economics
- At list price, monthly cash flow is $108 ($1k/yr) — positive.
- The deal already cash-flows at list — no discount required.
- To meet the 1% rule (rent ≥ 1% of price), the offer needs to be $173k (13.4% below list).
- Recommended offer: $173k (13.4% below list) — sets the bar for 1% rule.
- Cap rate 6.9% vs local median 3.9% in Kansas City — top-decile yield for the area; either an underpriced asset or a hidden risk that comps aren't pricing in. Stress-test before assuming the spread holds.
Location & tenants
- Location reads 78/100 on livability (#28 in MO, #2,671 nationally) — a middle-class / working-renter tenant base. Strengths: amenities A+, commute A+, cost of living A+; Watch: crime F.
- North Kansas City 74 (urban): math 38% / reading 49% proficiency, ranked #98 of 324 in MO (top 30%) — families likely to look elsewhere, expect single-tenant / working-renter base with shorter leases.
- Zoned schools: Maplewood Elementary (math 37% / reading 37%, grade F, #611 of 1,115 statewide, top 59%, 293 students, 72% FRL); Maple Park Middle (math 19% / reading 33%, grade F, #316 of 391 statewide, top 81%, 638 students, 65% FRL); Winnetonka High (math 16% / reading 51%, grade F, #349 of 521 statewide, top 67%, 1,284 students, 60% FRL) — zoned schools average 65% FRL vs 37% district-wide (28 pts higher); higher-poverty schools than district average — tighter screening recommended.
- Market conditions: Rents rising fast (+6.1%/yr); 184 active listings in the ZIP; 4 comparable units currently listed for rent nearby; rentals at typical pace (median 26d on market — plan ~3-4 weeks tenant-placement turnaround); solid renter incomes; 341 units permitted in Clay County in 2024 (40 in 5+ unit buildings).
Forward outlook
- Local home prices are declining (-3.0%/yr); year-one equity from $1k of loan paydown is wiped out by about $6k of value loss. Plan a longer hold.
- Clay County population projected at +24% by 2050 — long-run rental-demand tailwind backs the buy-and-hold thesis.
Negotiation context
- Only 10 days on market — expect competitive offers; lowballing is unlikely to land.
- 4 sale attempts with the ask held roughly flat each time — persistent listings suggest the price (not the market) is what's stuck; bring a comps-based counter.
Risks & watch-outs
- Watch-outs: built in 1959 — expect roof / HVAC / electrical / plumbing capex.
Questions for the listing agent
- Built in 1959 — when were the roof, HVAC, electrical panel, plumbing, and water heater last replaced?
- Is there a deadline driving the sale (1031 exchange, divorce, estate, relocation)? That informs how much negotiation room exists.
- Crime grade is F in this area — have there been break-ins, vandalism, or insurance claims at this property in the last 3 years? What carrier currently insures it and at what premium?
- The area grade is low — what's the realistic commute time and amenity access for the typical tenant pool here? Any planned neighborhood developments (good or bad) we should know about?
- What's the average days-on-market for RENTAL listings here right now (not sales)? A rising rental-DOM trend means longer vacancies and softer asking-rent achievability than the comps imply.
- What's the recent tenant-quality profile in this submarket — average credit score on applications, eviction rate, late-payment / NSF rate, and stable-employment percentage? A property-management company in the area should have these aggregated.
- How much new for-sale + rental construction is in the pipeline within 1–3 miles? Heavy new supply typically softens prices + rents 12–24 months out; constrained supply supports both.
Investment metrics
- 1% rule
- 0.87% ✗
- Cap rate
- 6.94%
- Cash-on-cash
- 2.32%
- DSCR
- 1.10
- GRM
- 9.6
CMA / ARV
- ARV (median comp)
- $181,486
- List price
- $199,999
- Delta
- 10.20%
- Verdict
- OVERPRICED
- Comps
- 11 within 1.0 mi
Show comp detail 12 sales within ~0.75 mi
| Address | Dist | Beds/Ba | Sqft | Sold | Price | $/sf | Match |
|---|---|---|---|---|---|---|---|
| 5174 N Corrington Ave | 0.22mi | 3/1.0 | 840 (+3%) | 8mo | $165,000 | $196 | 78 |
| 5128 N Richmond Ave | 0.36mi | 3/1.0 | 833 (+2%) | 3mo | $199,000 | $239 | 77 |
| 6206 NE 54th St | 0.61mi | 2/1.0 (-1) | 772 (-5%) | 1mo | $140,000 | $181 | 57 |
| 4831 N Manchester Ave | 0.65mi | 3/1.0 | 874 (+7%) | 1mo | $180,000 | $206 | 57 |
| 5525 NE Meadowbrook Rd | 0.49mi | 2/1.0 (-1) | 768 (-6%) | 10mo | $165,000 | $215 | 54 |
| 7928 NE San Rafael Dr | 0.71mi | 3/1.0 | 872 (+7%) | 6mo | $190,000 | $218 | 50 |
| 7821 NE 51st St | 0.59mi | 2/1.5 (-1) | 748 (-8%) | 2mo | $145,000 | $194 | 50 |
| 8032 NE San Rafael Dr | 0.74mi | 3/1.0 | 874 (+7%) | 5mo | $210,000 | $240 | 49 |
| 7112 NE 46th St | 0.67mi | 3/1.0 | 874 (+7%) | 9mo | $185,000 | $212 | 49 |
| 6924 NE 56th St | 0.52mi | 2/1.0 (-1) | 720 (-12%) | 4mo | $149,900 | $208 | 47 |
| 4820 N Manchester Ave | 0.64mi | 3/1.0 | 932 (+14%) | 3mo | $199,000 | $214 | 44 |
| 7722 NE 55th St | 0.68mi | 2/2.0 (-1) | 912 (+12%) | 8mo | $180,000 | $197 | 33 |
Match score weights: distance 35% · size 25% · config 20% · recency 20%. Top-matched comps best support the ARV.
Projected returns pro-forma
-3.0% appreciation · 6.09% rent growth · sell at horizon
- IRR
- -9.5%
- Equity multiple
- 0.64×
- Total profit
- $-20,011
- Equity at exit
- $29,821
- IRR
- 3.4%
- Equity multiple
- 1.28×
- Total profit
- $15,522
- Equity at exit
- $17,292
Cash invested: $56,000 (down + closing). Projections, not guarantees.
Landlord ↔ Tenant lean methodology
- Overall (STATE)
- 81 Strongly Landlord-Friendly
- State Missouri
- 81 Strongly Landlord-Friendly · R+10
- County
- — inherits STATE
- City
- — inherits STATE
ZIP-level market 64119
- Rents YoY
- 6.1%
- Active inventory
- 184
- Price-to-rent
- 9.6×
Monthly cashflow live
- Estimated rent
- $1,731 medium interval (Pro) →
- Mortgage (P&I)
- −$1,049
- Tax from tax record
- −$127 /mo · $1,529/yr
- Insurance
- −$83
- HOA
- −$0
- Vacancy / Maint / Mgmt
- −$364
- Net cashflow
- $108
Break-even live
Sensitivity live
| Price | -10% $222 | -5% $165 | +0% $108 | +5% $52 | +10% $-5 |
|---|---|---|---|---|---|
| Rent | -10% $-28 | -5% $40 | +0% $108 | +5% $177 | +10% $245 |
| Rate | -1.0pp $209 | -0.5pp $159 | base $108 | +0.5pp $56 | +1.0pp $4 |
UW: 25.0% down · 7.5% · 30yr · 1.5% tax · 5.0% vac · 8.0% maint · 8.0% mgmt
Financing live
Cash to close
- Down payment
- $50,000
- Closing costs
- $6,000
- Reserves months
- —
- Total cash needed
- —
Loan-product check · same deal, 3 products live
Conventional
25% down · 7.5% · 30yr
- Down + closing
- —
- Monthly P&I
- —
- Monthly cashflow
- —
- DSCR
- —
- Eligible?
- —
Personal DTI + credit; lowest rate.
DSCR
20% down · 8.5% · 30yr
- Down + closing
- —
- Monthly P&I
- —
- Monthly cashflow
- —
- DSCR
- —
- Eligible?
- —
No personal income docs; deal must DSCR.
Hard money
10% down · 12.0% · 12mo
- Down + closing
- —
- Monthly P&I
- —
- Monthly cashflow
- —
- DSCR
- —
- Eligible?
- —
Short-term bridge; refi at stabilization.
Rent comps 4 comps
| Address | Beds | Baths | Sqft | Rent | $/sqft | DOM | Units | Dist |
|---|---|---|---|---|---|---|---|---|
| 5128 N Palmer Ave Kansas City, MO | 3.0 | 2.0 | 905 | $1,646 | $1.82 | 45d | 1 | 0.42mi |
| 8030 NE 50th St Kansas City, MO | 3.0 | 1.5 | 1047 | $1,595 | $1.52 | 4d | 1 | 0.68mi |
| 5042 N Bellaire Ave Kansas City, MO | 2.0 | 1.0 | 900 | $1,391 | $1.55 | 25d | 1 | 0.71mi |
| 6130 NE Vivion Rd Kansas City, MO | 3.0 | 1.0 | 1056 | $1,675 | $1.59 | 12d | 1 | 0.77mi |
Listing history 13 events
-
2026-05-31status $199,999 Pending 10 DOM
-
2026-05-18historical
-
2026-05-04price $199,999
-
2026-04-27price $207,000
-
2026-04-23status Active
-
2026-04-15status Pending
-
2026-04-10price $213,000
-
2026-03-31status Active
-
2026-03-24historical Active Under Contract
-
2026-03-20$215,000 Active
-
2026-03-15historical
-
2025-10-24soldstatus
-
2022-03-01soldstatus
ⓘ Source: listings_history table (triggers on properties + properties_extension) + one-shot
backfill from property_details.listing_events for pre-trigger history.
Tax reassessment forecast MO · Resets to sale price
- Current annual tax
- $1,529 · $127/mo
- Projected year-2 tax
- $1,940 · $162/mo
- Expected delta
- +$411/yr (+$34/mo · 26.9%)
ⓘ Screening estimate from a state-policy table — verify with the county assessor before closing.
Climate risk First Street
- Flood 1/10 Low FEMA zone X (unshaded) · 0% chance over 30 yrs
- Wildfire 1/10 Low
- Heat 4/10 Moderate 7 d/yr ≥107°F today · 16 d/yr by 30 yrs out
- Wind 2/10 Low
- Air quality 3/10 Moderate 2 unhealthy d/yr today · 3 by 30 yrs out
Nearby sold comps map
Loading sold comps map…
Walkable amenities ~0.75 mi
Loading nearby amenities…
Taxation est. · year 1
- Rental income
- $20,777
- − Mortgage interest
- −$11,203
- − Property taxes
- −$1,529
- − Insurance
- −$1,000
- − Repairs & maintenance
- −$1,662
- − Management
- −$1,662
- − Depreciation
- −$5,818
- Taxable loss
- −$2,097
- Est. tax savings @ 24.0%
- +$503
- After-tax cash flow
- $1,803/yr
For passive investors: Depreciation is non-cash, so a rental often shows a tax loss while cash-flowing — sheltering income. Rental losses are passive: they offset passive income freely, and up to $25,000/yr can offset ordinary (W-2) income if you actively participate and your MAGI is under $100k (phasing out to $0 by $150k); unused losses carry forward. On sale, claimed depreciation is recaptured at up to 25%, and gains may owe capital-gains tax (a 1031 exchange can defer both). Figures are a year-1 estimate at your 24.0% rate — not tax advice; consult a CPA.
Schools (NCES district)
- District
- North Kansas City 74
- NCES district ID
- 2922800
- Math proficiency
- 38% ▼ -11.00%
- Reading proficiency
- 49% ▼ -3.00%
- Median HH income
- $55,444
- Composite
- 37.88/100
- National rank
- #4321
- State rank
- #98 of 324 in MO
Livability — Kansas City
- Score
- 78/100
- State rank
- #28
- US rank
- #2671
Category grades
Schools grade is shown separately in the Schools card above.
Census & demographics
- Census place
- Kansas City, MO
- County
- Clay County · 220,651 people
- City population
- 439,467
- Metro
- Kansas City, MO-KS
- Population (ZIP)
- 33,199
- Household income
- $83,929
- Rent vs Own
- Severe rent burden
- 603.0
Population outlook (Clay County) Hauer SSP2
- Today (2025)
- 266,022 people
- By 2030
- 280,057 · +5.3%
- By 2040
- 306,153 · +15.1%
- By 2050
- 328,630 · +23.5%
- By 2075
- 375,182 · +41.0%
- By 2100
- 392,861 · +47.7%
Race, ethnicity, and origin ACS 2023
- Neighborhood character
- Predominantly White (75%)
- Race & ethnicity
- White 75% Hispanic / Latino 8% Two or more races 8% Black 7% Asian 3% Pacific Islander 1%
- Hispanic origin (detail)
- Mexican 6%
- Common ancestry
- Romanian 2% Italian 2% Slovak 2%
- Foreign-born
- 7% · Canada, Vietnam, Jamaica
- Languages at home
- 90% English-only · Spanish 5% Other Asian/Pacific 1% Other Indo-European 1%
Political lean MEDSL · Clay
- 2024 margin
- Lean R (+5.6) · D 46.4% · R 52.0% · Other 1.6%
- 2008→2024 swing
- -4.9pp toward R · 2008: -0.7pp · 2024: -5.6pp
- All cycles
- 2024: R+5.6 2020: R+4.1 2016: R+11.1 2012: R+8.4 2008: R+0.7
Not yet ingested
- Civics
- —
Market trends
- HPI YoY
- ▼ -253.39%
- Current HPI
- 215.8366
- Rent YoY
- ▲ 6.09%
- Metro
- Kansas City, MO-KS
- State GDP YoY
- ▲ 1.84%
- F500 in state
- 20
Industry mix (Fortune 500 HQ in MO)
| Industry | F500 HQs | Revenue |
|---|---|---|
| Healthcare | 1 | $163B |
|
||
| Insurance | 1 | $21B |
|
||
| Industrial Technology | 1 | $17B |
|
||
| Retail | 1 | $16B |
|
||
| Industrial Distribution | 1 | $10B |
|
||
| Utilities | 1 | $9B |
|
||
Price history
-7.0% since first listed14 events — show timeline
- 2026-05-31 Pending — Heartland MLS as Distributed by MLS Grid
- 2026-05-20 Listed $199,999 Heartland MLS as Distributed by MLS Grid
- 2026-05-18 Listing Removed — Heartland MLS as Distributed by MLS Grid
- 2026-05-04 Price Changed $199,999 Heartland MLS as Distributed by MLS Grid
- 2026-04-27 Price Changed $207,000 Heartland MLS as Distributed by MLS Grid
- 2026-04-23 Relisted — Heartland MLS as Distributed by MLS Grid
- 2026-04-15 Pending — Heartland MLS as Distributed by MLS Grid
- 2026-04-10 Price Changed $213,000 Heartland MLS as Distributed by MLS Grid
- 2026-03-31 Relisted — Heartland MLS as Distributed by MLS Grid
- 2026-03-24 Contingent — Heartland MLS as Distributed by MLS Grid
- 2026-03-20 Listed $215,000 Heartland MLS as Distributed by MLS Grid
- 2026-03-15 Coming Soon — Heartland MLS as Distributed by MLS Grid
- 2025-10-24 Sold (Public Records) — Public Records
- 2022-03-01 Sold (Public Records) — Public Records
Property tax history
+4.0%/yrLatest (2025): $1,529 · +22.1% YoY. Source: county tax records.
Cash-flow waterfall
monthlySold comps — $/sqft
last 12 mo · ≤1 miLoading sold comps…