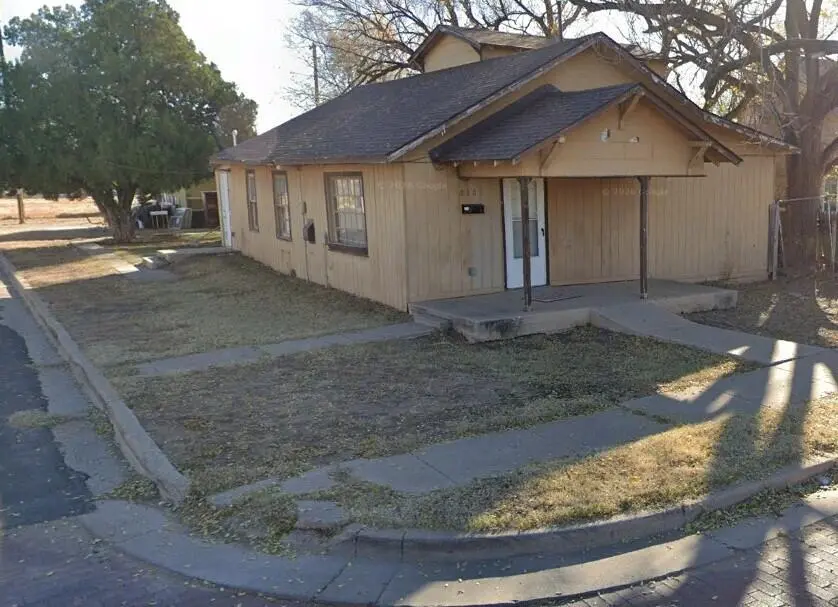
2101 Avenue M · Lubbock, TX
Flood risk 3/10 · Minor
- FEMA flood zone
- X (unshaded)
- Chance of flooding over 30 yrs
- 0.16%
- Est. flood insurance / yr
- $507 – $1,088
Fire risk 1/10 · Minimal
- Est. fire insurance / yr
- $1,222 – $2,270
Heat risk 5/10 · Moderate
- Hot days now (above 100°F)
- 7 days/yr
- Hot days in 30 yrs
- 21 days/yr
Wind risk 2/10 · Minimal
- Chance of severe wind over 30 yrs
- —
Air-quality risk 2/10 · Minimal
- Unhealthy air days now
- 1 days/yr
- Unhealthy air days in 30 yrs
- 1 days/yr
Risk factors via First Street. Map © Google.
Why this score? — see what drove the C+ grade
The composite is a weighted blend of 9 inputs, each scored 0–100. Each bar is that input's sub-score; the figure is the points it added to the 100-point composite (weight × sub-score).
- Cash flow +26.9/30.0
- DSCR +9.3/10.0
- ARV discount +7.5/15.0
- 1% rule +7.0/10.0
- Livability +4.0/5.0
- Schools +3.1/10.0
- Rent growth +3.0/5.0
- Condition / age +2.5/5.0
- Appreciation +0.0/10.0
$109,000
🖨 Deal sheet (PDF) 📄 Offer letter ✓ Due diligence
Listing remarks MLS
Property has 3 units on the same lot. 2101 Ave M ($800 rent), 1307 21st Street ($525 rent) and 1309 21st Street ($525 rent)
Key facts
- 5,600 sq ft lot
- Built 1939
- Listed 121 days
Neighborhood map
What this means for you Summary
Snapshot
- This is a 3-bed/2.0-bath single-family listed at $109k.
Deal economics
- At list price, monthly cash flow is $300 ($4k/yr) — positive.
- The deal already cash-flows at list — no discount required.
- Meets the 1% rule at list price ($1k rent vs $109k).
- Recommended offer: $96k (12.0% below list) — sets the bar for market timing.
Location & tenants
- Location reads 80/100 on livability (#37 in TX, #1,749 nationally) — a professional / high-income tenant draw. Strengths: commute A+, cost of living A+, housing A+; Watch: employment C-, schools D+, crime F.
- Lubbock ISD (urban): math 36% / reading 39% proficiency, ranked #481 of 826 in TX (top 58%) — families likely to look elsewhere, expect single-tenant / working-renter base with shorter leases; 60% free/reduced lunch — lower-income household profile, screen leases tightly.
- Market conditions: Rents rising (+1.9%/yr); 96 active listings in the ZIP; 40 comparable units currently listed for rent nearby; rentals at typical pace (median 23d on market — plan ~3-4 weeks tenant-placement turnaround); 48% of comp listings sitting > 30 days — soft ceiling on asking rent; 2,219 units permitted in Lubbock County in 2024 (252 in 5+ unit buildings).
- This rent runs 33% of the median local income ($48k/yr) — at the standard rent-burdened threshold; future hikes will face affordability resistance.
Forward outlook
- Local home prices are declining (-3.0%/yr); year-one equity from $754 of loan paydown is wiped out by about $3k of value loss. Plan a longer hold.
- Lubbock County population projected at +39% by 2050 — long-run rental-demand tailwind backs the buy-and-hold thesis.
Negotiation context
- It's been on market 121 days — a 12% lower offer ($96k) is reasonable based on typical stale-listing flexibility.
- Current owner paid $65k; list at $109k implies a 68% gain — meaningful room to come down on a strong offer.
Risks & watch-outs
- Watch-outs: built in 1939 — expect roof / HVAC / electrical / plumbing capex.
- Climate carrying-cost: extreme-heat days projected 7→21/yr by 2055 (HVAC capex compounding) — expect insurance premiums to compound above CPI over the hold.
Questions for the listing agent
- It's been on market 121 days. Have you received any prior offers? Is the seller open to a 12% concession, seller financing, or rate buy-down credit?
- Built in 1939 — when were the roof, HVAC, electrical panel, plumbing, and water heater last replaced?
- Why hasn't it sold? Are there any deal-killer items the seller is aware of (foundation, flood, title, zoning, code violations)?
- Is there a deadline driving the sale (1031 exchange, divorce, estate, relocation)? That informs how much negotiation room exists.
- Schools are D-rated, which usually means shorter tenancies and higher turnover. Who's the typical renter profile here, and what's been the actual vacancy rate?
- Crime grade is F in this area — have there been break-ins, vandalism, or insurance claims at this property in the last 3 years? What carrier currently insures it and at what premium?
- What's the average days-on-market for RENTAL listings here right now (not sales)? A rising rental-DOM trend means longer vacancies and softer asking-rent achievability than the comps imply.
- What's the recent tenant-quality profile in this submarket — average credit score on applications, eviction rate, late-payment / NSF rate, and stable-employment percentage? A property-management company in the area should have these aggregated.
- How much new for-sale + rental construction is in the pipeline within 1–3 miles? Heavy new supply typically softens prices + rents 12–24 months out; constrained supply supports both.
Investment metrics
- 1% rule
- 1.20% ✓
- Cap rate
- 9.60%
- Cash-on-cash
- 11.80%
- DSCR
- 1.53
- GRM
- 6.9
CMA / ARV
No comps found within radius.
Projected returns pro-forma
-3.0% appreciation · 1.87% rent growth · sell at horizon
- IRR
- -0.0%
- Equity multiple
- 1.00×
- Total profit
- $-8
- Equity at exit
- $16,252
- IRR
- 8.5%
- Equity multiple
- 1.61×
- Total profit
- $18,736
- Equity at exit
- $9,424
Cash invested: $30,520 (down + closing). Projections, not guarantees.
Landlord ↔ Tenant lean methodology
- Overall (STATE)
- 87 Strongly Landlord-Friendly
- State Texas
- 87 Strongly Landlord-Friendly · R+5
- County
- — inherits STATE
- City
- — inherits STATE
ZIP-level market 79411
- Home prices YoY
- -10.5%
- Rents YoY
- 1.9%
- Active inventory
- 96
- Price-to-rent
- 6.9×
Monthly cashflow live
- Estimated rent
- $1,311 high interval (Pro) →
- Mortgage (P&I)
- −$572
- Tax from tax record
- −$118 /mo · $1,421/yr
- Insurance
- −$45
- HOA
- −$0
- Vacancy / Maint / Mgmt
- −$275
- Net cashflow
- $300
Break-even live
Sensitivity live
| Price | -10% $362 | -5% $331 | +0% $300 | +5% $269 | +10% $238 |
|---|---|---|---|---|---|
| Rent | -10% $197 | -5% $248 | +0% $300 | +5% $352 | +10% $404 |
| Rate | -1.0pp $355 | -0.5pp $328 | base $300 | +0.5pp $272 | +1.0pp $243 |
UW: 25.0% down · 7.5% · 30yr · 1.5% tax · 5.0% vac · 8.0% maint · 8.0% mgmt
Financing live
Cash to close
- Down payment
- $27,250
- Closing costs
- $3,270
- Reserves months
- —
- Total cash needed
- —
Loan-product check · same deal, 3 products live
Conventional
25% down · 7.5% · 30yr
- Down + closing
- —
- Monthly P&I
- —
- Monthly cashflow
- —
- DSCR
- —
- Eligible?
- —
Personal DTI + credit; lowest rate.
DSCR
20% down · 8.5% · 30yr
- Down + closing
- —
- Monthly P&I
- —
- Monthly cashflow
- —
- DSCR
- —
- Eligible?
- —
No personal income docs; deal must DSCR.
Hard money
10% down · 12.0% · 12mo
- Down + closing
- —
- Monthly P&I
- —
- Monthly cashflow
- —
- DSCR
- —
- Eligible?
- —
Short-term bridge; refi at stabilization.
Rent comps 40 comps
| Address | Beds | Baths | Sqft | Rent | $/sqft | DOM | Units | Dist |
|---|---|---|---|---|---|---|---|---|
| 1517 25th St Lubbock, TX | 3.0 | 2.0 | 1514 | $1,095 | $0.72 | 22d | 1 | 0.29mi |
| 1716 24th St Lubbock, TX | 4.0 | 2.0 | 1742 | $1,850 | $1.06 | 45d | 1 | 0.40mi |
| 1912 21st St Lubbock, TX | 3.0 | 2.0 | 1473 | $1,025 | $0.70 | 45d | 1 | 0.50mi |
| 1912 20th St Unit A Lubbock, TX | 3.0 | 2.0 | 1590 | $1,000 | $0.63 | 22d | 1 | 0.51mi |
| 2009 23rd St Lubbock, TX | 3.0 | 1.0 | 1615 | $1,249 | $0.77 | 45d | 1 | 0.61mi |
| 1920 27th St Unit 1 Lubbock, TX | 3.0 | 3.0 | 1366 | $1,500 | $1.10 | 45d | 1 | 0.62mi |
| 1909 16th St Lubbock, TX | 4.0 | 2.0 | 1312 | $1,600 | $1.22 | 22d | 1 | 0.63mi |
| 2104 20th St Lubbock, TX | 4.0 | 2.0 | 1796 | $1,700 | $0.95 | 22d | 1 | 0.66mi |
| 2109 20th St Lubbock, TX | 3.0 | 2.0 | 1391 | $1,200 | $0.86 | 45d | 1 | 0.68mi |
| 2113 22nd St Lubbock, TX | 2.0 | 1.0 | 1404 | $850 | $0.61 | 22d | 1 | 0.69mi |
| 2118 24th St Lubbock, TX | 3.0 | 1.0 | 1435 | $1,000 | $0.70 | 22d | 1 | 0.72mi |
| 2124 20th St Lubbock, TX | 3.0 | 2.0 | 1481 | $1,150 | $0.78 | 15d | 1 | 0.75mi |
| 2123 18th St Lubbock, TX | 3.0 | 2.0 | 1328 | $949 | $0.71 | 15d | 1 | 0.84mi |
| 607 Main St Lubbock, TX | 2.0 | 1.5 | 1500 | $1,049 | $0.70 | 45d | 1 | 0.87mi |
| 2201 28th St Lubbock, TX | 3.0 | 1.0 | 1246 | $995 | $0.80 | 22d | 1 | 0.87mi |
| 2003 32nd St Unit A Lubbock, TX | 2.0 | 2.0 | 1228 | $1,150 | $0.94 | 45d | 1 | 0.90mi |
| 2122 16th St Lubbock, TX | 2.0 | 2.0 | 1295 | $1,025 | $0.79 | 45d | 1 | 0.90mi |
| 2119 15th St Lubbock, TX | 3.0 | 2.0 | 1600 | $1,400 | $0.88 | 45d | 1 | 0.90mi |
| 2106 32nd St Lubbock, TX | 3.0 | 1.0 | 1398 | $925 | $0.66 | 45d | 1 | 0.93mi |
| 2106 32nd St Lubbock, TX | 3.0 | 1.0 | 1398 | $695 | $0.50 | 22d | 1 | 0.93mi |
| 2311 25th St Lubbock, TX | 4.0 | 2.0 | 1400 | $1,400 | $1.00 | 22d | 1 | 0.96mi |
| 2220 29th St Lubbock, TX | 3.0 | 2.0 | 2032 | $1,300 | $0.64 | 45d | 1 | 0.98mi |
| 2220 16th St Lubbock, TX | 3.0 | 2.0 | 1414 | $1,300 | $0.92 | 22d | 1 | 1.00mi |
| 2402 21st St Lubbock, TX | 3.0 | 1.0 | 1453 | $1,500 | $1.03 | 45d | 1 | 1.01mi |
| 1919 34th St Lubbock, TX | 2.0 | 2.0 | 1463 | $1,100 | $0.75 | 15d | 1 | 1.02mi |
| 2404 25th St Lubbock, TX | 3.0 | 2.0 | 1292 | $1,395 | $1.08 | 22d | 1 | 1.04mi |
| 2404 27th St Lubbock, TX | 4.0 | 2.0 | 1250 | $1,349 | $1.08 | 45d | 1 | 1.07mi |
| 2319 28th St Lubbock, TX | 4.0 | 2.0 | 2146 | $1,650 | $0.77 | 22d | 1 | 1.07mi |
| 707 Avenue T Lubbock, TX | 3.0–4.0 | 3.0–4.0 | 1559 | $474 | $0.30 | 45d | 45 | 1.11mi |
| 2211 33rd St Unit A Lubbock, TX | 3.0 | 1.5 | 1293 | $1,200 | $0.93 | 45d | 1 | 1.11mi |
| 1607 Avenue Y Unit Y Lubbock, TX | 4.0 | 2.0 | 1532 | $2,100 | $1.37 | 15d | 1 | 1.15mi |
| 1626 Avenue Y Unit 3 Lubbock, TX | 2.0 | 1.0 | 1280 | $850 | $0.66 | 45d | 1 | 1.16mi |
| 2416 30th St Lubbock, TX | 3.0 | 2.0 | 1746 | $1,425 | $0.82 | 22d | 1 | 1.20mi |
| 2511 23rd St Lubbock, TX | 2.0 | 2.0 | 1428 | $1,500 | $1.05 | 22d | 1 | 1.25mi |
| 2215 36th St Lubbock, TX | 3.0 | 2.0 | 1578 | $1,450 | $0.92 | 45d | 1 | 1.30mi |
| 2430 31st St Lubbock, TX | 3.0 | 2.0 | 1592 | $1,450 | $0.91 | 45d | 1 | 1.31mi |
| 2217 36th St Lubbock, TX | 3.0 | 1.0 | 1284 | $1,109 | $0.86 | 15d | 1 | 1.31mi |
| 2605 22nd St Lubbock, TX | 3.0 | 2.0 | 2260 | $1,960 | $0.87 | 45d | 1 | 1.33mi |
| 2518 30th St Lubbock, TX | 4.0 | 2.0 | 1558 | $1,750 | $1.12 | 22d | 1 | 1.39mi |
| 1718 43rd St Lubbock, TX | 4.0 | 2.0 | 1870 | $1,075 | $0.57 | 22d | 1 | 1.41mi |
Listing history 21 events
-
2026-06-18days on market $109,000 Active 121 DOM
-
2026-06-17days on market $109,000 Active 120 DOM
-
2026-06-16days on market $109,000 Active 119 DOM
-
2026-06-15days on market $109,000 Active 118 DOM
-
2026-06-14days on market $109,000 Active 116 DOM
-
2026-06-13days on market $109,000 Active 115 DOM
-
2026-06-10days on market $109,000 Active 113 DOM
-
2026-06-09days on market $109,000 Active 112 DOM
-
2026-06-08days on market $109,000 Active 111 DOM
-
2026-06-07days on market $109,000 Active 110 DOM
-
2026-06-05days on market $109,000 Active 107 DOM
-
2026-06-03days on market $109,000 Active 106 DOM
-
2026-06-02days on market $109,000 Active 105 DOM
-
2026-06-01days on market $109,000 Active 104 DOM
-
2026-05-31days on market $109,000 Active 103 DOM
-
2026-05-30days on market $109,000 Active 102 DOM
-
2026-02-17$109,000 Active 123-char remark
Show marketing remark (123 chars)
Property has 3 units on the same lot. 2101 Ave M ($800 rent), 1307 21st Street ($525 rent) and 1309 21st Street ($525 rent)
-
2024-04-08soldstatus $65,000
-
2010-04-21soldstatus
-
2005-07-12soldstatus
-
1994-02-01soldstatus
ⓘ Source: listings_history table (triggers on properties + properties_extension) + one-shot
backfill from property_details.listing_events for pre-trigger history.
Tax reassessment forecast TX · Resets to sale price
- Current annual tax
- $1,421 · $118/mo
- Projected year-2 tax
- $1,995 · $166/mo
- Expected delta
- +$574/yr (+$48/mo · 40.4%)
ⓘ Screening estimate from a state-policy table — verify with the county assessor before closing.
Climate risk First Street
- Flood 3/10 Moderate FEMA zone X (unshaded) · 16% chance over 30 yrs
- Wildfire 1/10 Low
- Heat 5/10 Major 7 d/yr ≥100°F today · 21 d/yr by 30 yrs out
- Wind 2/10 Low
- Air quality 2/10 Low 1 unhealthy d/yr today · 1 by 30 yrs out
Nearby sold comps map
Loading sold comps map…
Walkable amenities ~0.75 mi
Loading nearby amenities…
Taxation est. · year 1
- Rental income
- $15,731
- − Mortgage interest
- −$6,106
- − Property taxes
- −$1,421
- − Insurance
- −$545
- − Repairs & maintenance
- −$1,258
- − Management
- −$1,258
- − Depreciation
- −$3,171
- Taxable income
- $1,972
- Est. tax owed @ 24.0%
- −$473
- After-tax cash flow
- $3,129/yr
For passive investors: Depreciation is non-cash, so a rental often shows a tax loss while cash-flowing — sheltering income. Rental losses are passive: they offset passive income freely, and up to $25,000/yr can offset ordinary (W-2) income if you actively participate and your MAGI is under $100k (phasing out to $0 by $150k); unused losses carry forward. On sale, claimed depreciation is recaptured at up to 25%, and gains may owe capital-gains tax (a 1031 exchange can defer both). Figures are a year-1 estimate at your 24.0% rate — not tax advice; consult a CPA.
Schools (NCES district)
- District
- Lubbock ISD
- NCES district ID
- 4828500
- Math proficiency
- 36% ▼ -8.00%
- Reading proficiency
- 39% ▼ -1.00%
- Median HH income
- $39,820
- Composite
- 31.44/100
- National rank
- #5984
- State rank
- #481 of 826 in TX
Livability — Lubbock
- Score
- 80/100
- State rank
- #37
- US rank
- #1749
Category grades
Schools grade is shown separately in the Schools card above.
Census & demographics
- Census place
- Lubbock, TX
- County
- Lubbock County · 293,542 people
- City population
- 283,030
- Metro
- Lubbock, TX
- Population (ZIP)
- 6,865
- Household income
- $47,634
- Rent vs Own
- Severe rent burden
- 777.0
Population outlook (Lubbock County) Hauer SSP2
- Today (2025)
- 345,960 people
- By 2030
- 371,449 · +7.4%
- By 2040
- 424,539 · +22.7%
- By 2050
- 481,150 · +39.1%
- By 2075
- 633,467 · +83.1%
- By 2100
- 746,853 · +115.9%
Race, ethnicity, and origin ACS 2023
- Neighborhood character
- Diverse neighborhood (Simpson 0.59)
- Race & ethnicity
- Hispanic / Latino 50% White 39% Two or more races 10% Black 9% Native American 2%
- Hispanic origin (detail)
- Mexican 37% Cuban 2%
- Common ancestry
- Slovak 3% Italian 2% Portuguese 2%
- Foreign-born
- 8% · Canada
- Languages at home
- 64% English-only · Spanish 35%
Political lean MEDSL · Lubbock
- 2024 margin
- Solid R (+39.5) · D 29.7% · R 69.2% · Other 1.0%
- 2008→2024 swing
- -2.8pp toward R · 2008: -36.7pp · 2024: -39.5pp
- All cycles
- 2024: R+39.5 2020: R+32.2 2016: R+38.4 2012: R+40.9 2008: R+36.7
Not yet ingested
- Civics
- —
Market trends
- HPI YoY
- ▼ -24.58%
- Current HPI
- 210.495
- Rent YoY
- ▲ 1.87%
- Metro
- Lubbock, TX
- State GDP YoY
- ▲ 3.95%
- F500 in state
- 110
Industry mix (Fortune 500 HQ in TX)
| Industry | F500 HQs | Revenue |
|---|---|---|
| Energy | 16 | $1,198B |
|
||
| Technology | 5 | $198B |
|
||
| Engineering / Construction | 4 | $72B |
|
||
| Energy Services | 3 | $60B |
|
||
| Utilities | 3 | $41B |
|
||
| Healthcare | 2 | $330B |
|
||
Price history
+67.7% since first listed5 events — show timeline
- 2026-02-17 Listed $109,000 LARMLS
- 2024-04-08 Sold (Public Records) $65,000 Public Records
- 2010-04-21 Sold (Public Records) — Public Records
- 2005-07-12 Sold (Public Records) — Public Records
- 1994-02-01 Sold (Public Records) — Public Records
Property tax history
+5.7%/yrLatest (2025): $1,421 · +3.3% YoY. Source: county tax records.
Cash-flow waterfall
monthlySold comps — $/sqft
last 12 mo · ≤1 miLoading sold comps…