 🏗️ New Construction
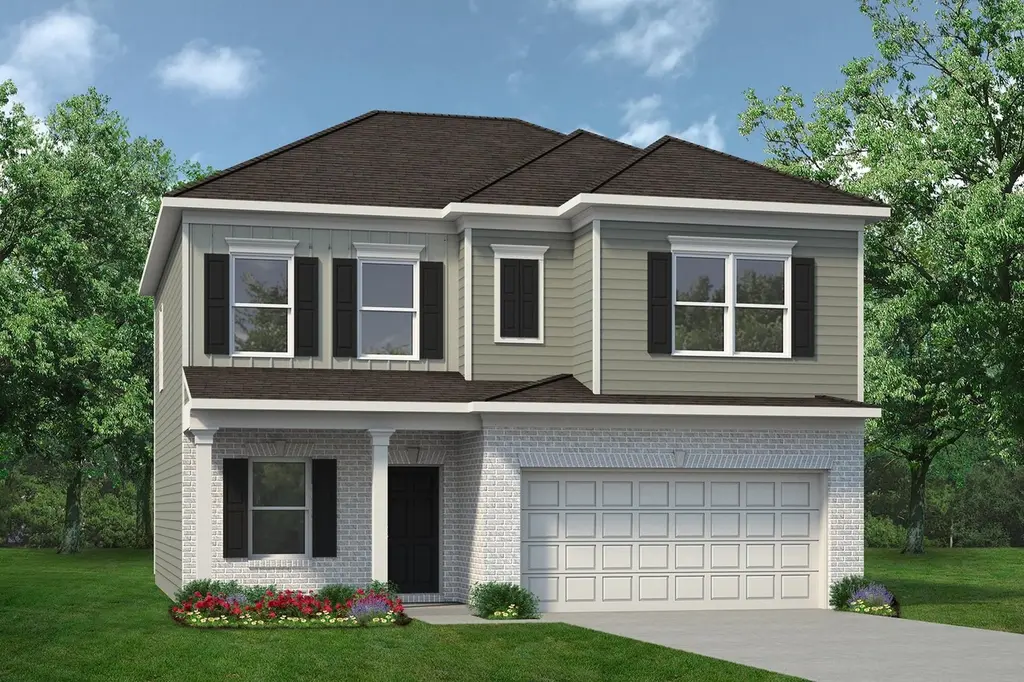
The Coleman Plan · Weston Lakes, TX
Flood risk No data
- FEMA flood zone
- —
- Chance of flooding over 30 yrs
- —
- Est. flood insurance / yr
- —
Fire risk No data
- Est. fire insurance / yr
- —
Heat risk No data
- Hot days now (above threshold)
- —
- Hot days in 30 yrs
- —
Wind risk No data
- Chance of severe wind over 30 yrs
- —
Air-quality risk No data
- Unhealthy air days now
- —
- Unhealthy air days in 30 yrs
- —
Risk factors via First Street. Map © Google.
Why this score? — see what drove the D- grade
The composite is a weighted blend of 9 inputs, each scored 0–100. Each bar is that input's sub-score; the figure is the points it added to the 100-point composite (weight × sub-score).
- Cash flow +10.9/30.0
- ARV discount +7.5/15.0
- Condition / age +4.8/5.0
- Schools +4.6/10.0
- 1% rule +3.2/10.0
- DSCR +3.2/10.0
- Livability +3.0/5.0
- Rent growth +2.1/5.0
- Appreciation +0.0/10.0
$305,990
🖨 Deal sheet (PDF) 📄 Offer letter ✓ Due diligence
Listing remarks MLS
The Coleman greets you with a covered front porch entry that opens to a welcoming dining room, or study if you prefer. Expansive sight lines across the back of the home connect the family room, breakfast nook, and kitchen with an optional center island. Upstairs you'll find four bedrooms including an owner's suite with a large walk-in closet, a secondary bathroom with compartmentalized space that allows for multiple people to use it at the same time, and a convenient, central laundry room.
Key facts
- Large walk-in closet
- Central laundry room
- 2 parking spots
Tags
Neighborhood map
What this means for you Summary
Snapshot
- This is a 4-bed/2.5-bath single-family listed at $306k. Condition is rated excellent.
Deal economics
- At list price, monthly cash flow is $-157 ($-2k/yr) — negative.
- The deal already cash-flows at list — no discount required.
- To meet the 1% rule (rent ≥ 1% of price), the offer needs to be $291k (5.0% below list).
- Recommended offer: $269k (12.0% below list) — sets the bar for market timing.
- Cap rate 5.8% vs local median 1.5% in Weston Lakes — top-decile yield for the area; either an underpriced asset or a hidden risk that comps aren't pricing in. Stress-test before assuming the spread holds.
Location & tenants
- Location reads 59/100 on livability (#1,122 in TX) — a working-class tenant base; expect higher turnover. Strengths: crime A+, employment A+, housing A+; Watch: amenities F, commute F, cost of living F.
- Lamar CISD (suburban): math 50% / reading 53% proficiency, ranked #116 of 826 in TX (top 14%) — acceptable for families but not a draw, mixed tenant base, ~2y average lease.
- Market conditions: Rents soft (-1.6%/yr); 1242 active listings in the ZIP; 3 comparable units currently listed for rent nearby; rentals lingering (median 45d on market — plan ~5-8 weeks vacancy on turnover, expect pricing pressure); 100% of comp listings sitting > 30 days — soft ceiling on asking rent; high-income renter base; 12,093 units permitted in Fort Bend County in 2024 (815 in 5+ unit buildings).
Forward outlook
- Local home prices are declining (-3.0%/yr); year-one equity from $2k of loan paydown is wiped out by about $11k of value loss. Plan a longer hold.
- Fort Bend County population projected at +75% by 2050 — long-run rental-demand tailwind backs the buy-and-hold thesis.
Negotiation context
- It's been on market 747 days — a 12% lower offer ($269k) is reasonable based on typical stale-listing flexibility.
Questions for the listing agent
- What do current leases actually rent for vs. the listed asking? Can we see a recent rent roll and the last 12 months of T-12 income?
- It's been on market 747 days. Have you received any prior offers? Is the seller open to a 12% concession, seller financing, or rate buy-down credit?
- Why hasn't it sold? Are there any deal-killer items the seller is aware of (foundation, flood, title, zoning, code violations)?
- Is there a deadline driving the sale (1031 exchange, divorce, estate, relocation)? That informs how much negotiation room exists.
- The area grade is low — what's the realistic commute time and amenity access for the typical tenant pool here? Any planned neighborhood developments (good or bad) we should know about?
- What's the average days-on-market for RENTAL listings here right now (not sales)? A rising rental-DOM trend means longer vacancies and softer asking-rent achievability than the comps imply.
- What's the recent tenant-quality profile in this submarket — average credit score on applications, eviction rate, late-payment / NSF rate, and stable-employment percentage? A property-management company in the area should have these aggregated.
- How much new for-sale + rental construction is in the pipeline within 1–3 miles? Heavy new supply typically softens prices + rents 12–24 months out; constrained supply supports both.
Investment metrics
- 1% rule
- 0.82% ✗
- Cap rate
- 5.76%
- Cash-on-cash
- -1.90%
- DSCR
- 0.92
- GRM
- 10.2
CMA / ARV
- ARV (median comp)
- $355,004
- List price
- $305,990
- Delta
- -13.81%
- Verdict
- UNDERPRICED
- Comps
- 20 within 1.0 mi
Show comp detail 12 sales within ~0.75 mi
| Address | Dist | Beds/Ba | Sqft | Sold | Price | $/sf | Match |
|---|---|---|---|---|---|---|---|
| 8207 Red Shiner Way | 0.19mi | 3/2.5 (-1) | 2,122 (+1%) | 9mo | $394,990 | $186 | 77 |
| 8135 Red Shiner Way | 0.18mi | 4/2.0 | 1,897 (-10%) | 3mo | $359,895 | $190 | 71 |
| 8130 Red Shiner Way | 0.16mi | 3/2.0 (-1) | 1,924 (-8%) | 2mo | $285,000 | $148 | 69 |
| 32303 Comet Darner Way | 0.24mi | 4/2.0 | 1,925 (-8%) | 7mo | $300,000 | $156 | 67 |
| 32438 Slender Spreadwing Dr | 0.30mi | 4/2.0 | 1,897 (-10%) | 2mo | $348,275 | $184 | 66 |
| 7902 Wandering Glider Dr | 0.31mi | 4/2.0 | 1,897 (-10%) | 4mo | $354,760 | $187 | 64 |
| 8126 Red Shiner Way | 0.16mi | 3/2.0 (-1) | 1,826 (-13%) | 4mo | $340,670 | $187 | 60 |
| 8315 Red Shiner Way | 0.22mi | 3/2.0 (-1) | 1,826 (-13%) | 1mo | $318,990 | $175 | 60 |
| 8322 Red Shiner Way | 0.19mi | 3/2.0 (-1) | 1,878 (-11%) | 9mo | $342,595 | $182 | 59 |
| 32210 Slender Spreadwing Dr | 0.48mi | 4/2.5 | 2,276 (+8%) | 9mo | $351,265 | $154 | 56 |
| 8042 Wandering Glider Dr | 0.44mi | 4/2.0 | 1,897 (-10%) | 9mo | $342,145 | $180 | 54 |
| 33026 School Hill Rd | 0.58mi | 4/3.5 | 2,399 (+14%) | 0mo | $339,990 | $142 | 45 |
Match score weights: distance 35% · size 25% · config 20% · recency 20%. Top-matched comps best support the ARV.
Projected returns pro-forma
-3.0% appreciation · 0.0% rent growth · sell at horizon
- IRR
- -22.8%
- Equity multiple
- 0.24×
- Total profit
- $-76,016
- Equity at exit
- $52,932
- IRR
- -27.7%
- Equity multiple
- -0.13×
- Total profit
- $-111,830
- Equity at exit
- $30,694
Cash invested: $99,401 (down + closing). Projections, not guarantees.
Landlord ↔ Tenant lean methodology
- Overall (STATE)
- 87 Strongly Landlord-Friendly
- State Texas
- 87 Strongly Landlord-Friendly · R+5
- County
- — inherits STATE
- City
- — inherits STATE
ZIP-level market 77441
- Rents YoY
- -1.6%
- Active inventory
- 1242
- Price-to-rent
- 8.8×
Monthly cashflow live
- Estimated rent
- $2,906 medium interval (Pro) →
- Mortgage (P&I)
- −$1,862
- Tax est. 1.5%
- −$444 /mo · $5,325/yr
- Insurance
- −$148
- HOA
- −$0
- Vacancy / Maint / Mgmt
- −$610
- Net cashflow
- $-157
Break-even live
Sensitivity live
| Price | -10% $88 | -5% $-35 | +0% $-157 | +5% $-280 | +10% $-403 |
|---|---|---|---|---|---|
| Rent | -10% $-387 | -5% $-272 | +0% $-157 | +5% $-42 | +10% $72 |
| Rate | -1.0pp $22 | -0.5pp $-67 | base $-157 | +0.5pp $-249 | +1.0pp $-343 |
UW: 25.0% down · 7.5% · 30yr · 1.5% tax · 5.0% vac · 8.0% maint · 8.0% mgmt
Financing live
Cash to close
- Down payment
- $88,751
- Closing costs
- $10,650
- Reserves months
- —
- Total cash needed
- —
Loan-product check · same deal, 3 products live
Conventional
25% down · 7.5% · 30yr
- Down + closing
- —
- Monthly P&I
- —
- Monthly cashflow
- —
- DSCR
- —
- Eligible?
- —
Personal DTI + credit; lowest rate.
DSCR
20% down · 8.5% · 30yr
- Down + closing
- —
- Monthly P&I
- —
- Monthly cashflow
- —
- DSCR
- —
- Eligible?
- —
No personal income docs; deal must DSCR.
Hard money
10% down · 12.0% · 12mo
- Down + closing
- —
- Monthly P&I
- —
- Monthly cashflow
- —
- DSCR
- —
- Eligible?
- —
Short-term bridge; refi at stabilization.
Rent comps 3 comps
| Address | Beds | Baths | Sqft | Rent | $/sqft | DOM | Units | Dist |
|---|---|---|---|---|---|---|---|---|
| 8106 Royal Palm Ct Fulshear, TX | 5.0 | 4.0 | 2946 | $2,950 | $1.00 | 45d | 1 | 1.33mi |
| 8114 Royal Palm Ct Fulshear, TX | 5.0 | 4.0 | 2960 | $3,295 | $1.11 | 45d | 1 | 1.35mi |
| 31419 Horseshoe Meadow Bend Ln Fulshear, TX | 3.0 | 2.0 | 1588 | $2,100 | $1.32 | 45d | 1 | 1.39mi |
Listing history 19 events
-
2026-06-21days on market $305,990 Active 747 DOM
-
2026-06-18days on market $305,990 Active 744 DOM
-
2026-06-17days on market $305,990 Active 743 DOM
-
2026-06-16days on market $305,990 Active 742 DOM
-
2026-06-15days on market $305,990 Active 741 DOM
-
2026-06-13days on market $305,990 Active 739 DOM
-
2026-06-10days on market $305,990 Active 735 DOM
-
2026-06-08days on market $305,990 Active 734 DOM
-
2026-06-07days on market $305,990 Active 733 DOM
-
2026-06-04days on market $305,990 Active 730 DOM
-
2026-06-03days on market $305,990 Active 729 DOM
-
2026-06-02days on market $305,990 Active 728 DOM
-
2026-06-01days on market $305,990 Active 727 DOM
-
2026-05-31days on market $305,990 Active 726 DOM
-
2026-01-16price $305,990 494-char remark
Show marketing remark (494 chars)
The Coleman greets you with a covered front porch entry that opens to a welcoming dining room, or study if you prefer. Expansive sight lines across the back of the home connect the family room, breakfast nook, and kitchen with an optional center island. Upstairs you'll find four bedrooms including an owner's suite with a large walk-in closet, a secondary bathroom with compartmentalized space that allows for multiple people to use it at the same time, and a convenient, central laundry room.
-
2025-08-01price $303,990 494-char remark
Show marketing remark (494 chars)
The Coleman greets you with a covered front porch entry that opens to a welcoming dining room, or study if you prefer. Expansive sight lines across the back of the home connect the family room, breakfast nook, and kitchen with an optional center island. Upstairs you'll find four bedrooms including an owner's suite with a large walk-in closet, a secondary bathroom with compartmentalized space that allows for multiple people to use it at the same time, and a convenient, central laundry room.
-
2024-12-11price $310,990 494-char remark
Show marketing remark (494 chars)
The Coleman greets you with a covered front porch entry that opens to a welcoming dining room, or study if you prefer. Expansive sight lines across the back of the home connect the family room, breakfast nook, and kitchen with an optional center island. Upstairs you'll find four bedrooms including an owner's suite with a large walk-in closet, a secondary bathroom with compartmentalized space that allows for multiple people to use it at the same time, and a convenient, central laundry room.
-
2024-07-03price $320,990 494-char remark
Show marketing remark (494 chars)
The Coleman greets you with a covered front porch entry that opens to a welcoming dining room, or study if you prefer. Expansive sight lines across the back of the home connect the family room, breakfast nook, and kitchen with an optional center island. Upstairs you'll find four bedrooms including an owner's suite with a large walk-in closet, a secondary bathroom with compartmentalized space that allows for multiple people to use it at the same time, and a convenient, central laundry room.
-
2024-06-04$315,990 Active 494-char remark
Show marketing remark (494 chars)
The Coleman greets you with a covered front porch entry that opens to a welcoming dining room, or study if you prefer. Expansive sight lines across the back of the home connect the family room, breakfast nook, and kitchen with an optional center island. Upstairs you'll find four bedrooms including an owner's suite with a large walk-in closet, a secondary bathroom with compartmentalized space that allows for multiple people to use it at the same time, and a convenient, central laundry room.
ⓘ Source: listings_history table (triggers on properties + properties_extension) + one-shot
backfill from property_details.listing_events for pre-trigger history.
Nearby sold comps map
Loading sold comps map…
Walkable amenities ~0.75 mi
Loading nearby amenities…
Taxation est. · year 1
- Rental income
- $34,877
- − Mortgage interest
- −$19,886
- − Property taxes
- −$5,325
- − Insurance
- −$1,775
- − Repairs & maintenance
- −$2,790
- − Management
- −$2,790
- − Depreciation
- −$10,327
- Taxable loss
- −$8,016
- Est. tax savings @ 24.0%
- +$1,924
- After-tax cash flow
- $37/yr
For passive investors: Depreciation is non-cash, so a rental often shows a tax loss while cash-flowing — sheltering income. Rental losses are passive: they offset passive income freely, and up to $25,000/yr can offset ordinary (W-2) income if you actively participate and your MAGI is under $100k (phasing out to $0 by $150k); unused losses carry forward. On sale, claimed depreciation is recaptured at up to 25%, and gains may owe capital-gains tax (a 1031 exchange can defer both). Figures are a year-1 estimate at your 24.0% rate — not tax advice; consult a CPA.
Condition & rehab AI · 3 photos
This single-family home is in excellent condition with no visible repairs or maintenance needed. It offers a great opportunity for an investor to make minor updates that will significantly enhance its resale and rental value.
Value-add opportunities
- Both Painting the interior walls — Fresh paint enhances curb appeal and interior aesthetics
- Both Landscaping improvements — Enhances curb appeal and adds value
- Both New flooring in bathrooms — Improves aesthetics and functionality
- Both New kitchen appliances — Enhances functionality and appeal
Renovation cost estimate screening
Value-add ROI direction
- Both Painting the interior walls — Fresh paint enhances curb appeal and interior aesthetics ↑
- Both Landscaping improvements — Enhances curb appeal and adds value ↑
- Both New flooring in bathrooms — Improves aesthetics and functionality ↑
- Both New kitchen appliances — Enhances functionality and appeal ↑
ⓘ Cost ranges are severity-bucket heuristics (US national rule-of-thumb). Get contractor quotes + a written scope before underwriting a rehab budget.
Schools (NCES district)
- District
- Lamar CISD
- NCES district ID
- 4826580
- Math proficiency
- 50% ▼ -12.00%
- Reading proficiency
- 53% ▼ -4.00%
- Median HH income
- $75,213
- Composite
- 46.43/100
- National rank
- #2452
- State rank
- #116 of 826 in TX
Livability — Weston Lakes
- Score
- 59/100
- State rank
- #1122
- US rank
- #19641
Category grades
Schools grade is shown separately in the Schools card above.
Census & demographics
- County
- Fort Bend County · 836,777 people
- Metro
- Houston-The Woodlands-Sugar Land, TX
- Population (ZIP)
- 41,324
- Household income
- $184,390
- Rent vs Own
- Severe rent burden
- 301.0
Population outlook (Fort Bend County) Hauer SSP2
- Today (2025)
- 1,004,526 people
- By 2030
- 1,153,104 · +14.8%
- By 2040
- 1,453,718 · +44.7%
- By 2050
- 1,753,781 · +74.6%
- By 2075
- 2,455,772 · +144.5%
- By 2100
- 2,930,528 · +191.7%
Race, ethnicity, and origin ACS 2023
- Neighborhood character
- Diverse neighborhood (Simpson 0.62)
- Race & ethnicity
- White 57% Hispanic / Latino 20% Two or more races 15% Asian 12% Black 6%
- Hispanic origin (detail)
- Mexican 10%
- Common ancestry
- Lithuanian 5% Romanian 2% Italian 1%
- Foreign-born
- 26% · Canada, China, Jamaica
- Languages at home
- 68% English-only · Spanish 17% German/W. Germanic 4% Chinese 4%
Political lean MEDSL · Fort Bend
- 2024 margin
- Toss-up / Even · D 49.5% · R 47.9% · Other 2.6%
- 2008→2024 swing
- +4.0pp toward D · 2008: -2.4pp · 2024: 1.6pp
- All cycles
- 2024: D+1.6 2020: D+10.6 2016: D+6.6 2012: R+6.8 2008: R+2.4
Not yet ingested
- Civics
- —
Market trends
- HPI YoY
- ▼ -154.74%
- Current HPI
- 275.8798
- Rent YoY
- ▼ -1.63%
- Metro
- Houston-The Woodlands-Sugar Land, TX
- State GDP YoY
- ▲ 3.95%
- F500 in state
- 110
Industry mix (Fortune 500 HQ in TX)
| Industry | F500 HQs | Revenue |
|---|---|---|
| Energy | 16 | $1,198B |
|
||
| Technology | 5 | $198B |
|
||
| Engineering / Construction | 4 | $72B |
|
||
| Energy Services | 3 | $60B |
|
||
| Utilities | 3 | $41B |
|
||
| Healthcare | 2 | $330B |
|
||
Price history
-3.2% since first listed5 events — show timeline
- 2026-01-16 Price Changed $305,990 Zillow
- 2025-08-01 Price Changed $303,990 Zillow
- 2024-12-11 Price Changed $310,990 Zillow
- 2024-07-03 Price Changed $320,990 Zillow
- 2024-06-04 Listed $315,990 Zillow
Cash-flow waterfall
monthlySold comps — $/sqft
last 12 mo · ≤1 miLoading sold comps…