9320 Collinsville Martin Rd · Collinsville, MS
Flood risk 1/10 · Minimal
- FEMA flood zone
- X (unshaded)
- Chance of flooding over 30 yrs
- 0.0%
- Est. flood insurance / yr
- $507 – $1,088
Fire risk 3/10 · Minor
- Est. fire insurance / yr
- $1,241 – $2,305
Heat risk 6/10 · Moderate
- Hot days now (above 108°F)
- 7 days/yr
- Hot days in 30 yrs
- 21 days/yr
Wind risk 8/10 · Major
- Chance of severe wind over 30 yrs
- 80.0%
Air-quality risk 1/10 · Minimal
- Unhealthy air days now
- 0 days/yr
- Unhealthy air days in 30 yrs
- 0 days/yr
Risk factors via First Street. Map © Google.
Why this score? — see what drove the D grade
The composite is a weighted blend of 9 inputs, each scored 0–100. Each bar is that input's sub-score; the figure is the points it added to the 100-point composite (weight × sub-score).
- Cash flow +15.0/30.0
- ARV discount +7.5/15.0
- 1% rule +5.0/10.0
- DSCR +5.0/10.0
- Livability +3.6/5.0
- Schools +3.3/10.0
- Rent growth +2.5/5.0
- Condition / age +2.5/5.0
- Appreciation +0.0/10.0
$75,000
🖨 Deal sheet 📄 Offer letter ✓ Due diligence
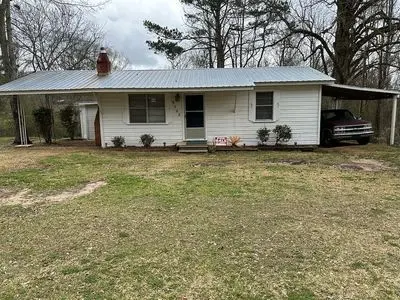
Listing remarks
Jim Walter home. This is a 2 bed 1 bath cosy home with many bonuses. It includes a spacious shop and deck. There is an hand dug well in the back yard. The inside features hard wood floors, and an Ashley insert fireplace. The house has a built in carport and a bonus carport that leans on the other side of the house. The shop has a washer and dryer set hooked up and included. This home features a tin roof around 10 years old. No central heat and air. Gas heating available in bathroom. Call for inquiries at 6014901230
Key facts
- Hard wood floors
- Hand dug well
- Built in carport
Tags
Neighborhood map
What this means for you Summary
Snapshot
- This is a 2-bed/1.0-bath single-family listed at $75k.
Deal economics
- At list price, monthly cash flow is $59k ($706k/yr) — positive.
- The deal already cash-flows at list — no discount required.
- Meets the 1% rule at list price ($75k rent vs $75k).
- Recommended offer: $74k (1.5% below list) — sets the bar for market timing.
Location & tenants
- Location reads 72/100 on livability (#25 in MS) — a middle-class / working-renter tenant base. Strengths: crime A+, cost of living A+, housing A+; Watch: amenities F, commute F, health & safety D-.
- Lauderdale County School District (rural): math 37% / reading 41% proficiency, ranked #39 of 130 in MS (top 30%) — families likely to look elsewhere, expect single-tenant / working-renter base with shorter leases.
- Market conditions: 27 active listings in the ZIP; 1 comparable units currently listed for rent nearby; 18 units permitted in Lauderdale County in 2024 (0 in 5+ unit buildings).
Forward outlook
- Local home prices are declining (-3.0%/yr); year-one equity from $519 of loan paydown is wiped out by about $2k of value loss. Plan a longer hold.
- Lauderdale County population projected at -18% by 2050 — secular population decline; favor cash flow + early exit over multi-decade hold.
- At projected returns (-3.0% appreciation + 3.0% rent growth), your $21k cash investment doubles in ~1 year — after that, you're playing with house money.
Negotiation context
- It's been on market 24 days — a 2% lower offer ($74k) is reasonable based on typical stale-listing flexibility.
Risks & watch-outs
- Climate carrying-cost: severe wind risk, 80% chance of damaging wind over 30y; extreme-heat days projected 7→21/yr by 2055 (HVAC capex compounding) — expect insurance premiums to compound above CPI over the hold.
Questions for the listing agent
- Built in 1962 — when were the roof, HVAC, electrical panel, plumbing, and water heater last replaced?
- Is there a deadline driving the sale (1031 exchange, divorce, estate, relocation)? That informs how much negotiation room exists.
- The area grade is low — what's the realistic commute time and amenity access for the typical tenant pool here? Any planned neighborhood developments (good or bad) we should know about?
- What's the average days-on-market for RENTAL listings here right now (not sales)? A rising rental-DOM trend means longer vacancies and softer asking-rent achievability than the comps imply.
- What's the recent tenant-quality profile in this submarket — average credit score on applications, eviction rate, late-payment / NSF rate, and stable-employment percentage? A property-management company in the area should have these aggregated.
- How much new for-sale + rental construction is in the pipeline within 1–3 miles? Heavy new supply typically softens prices + rents 12–24 months out; constrained supply supports both.
Investment metrics
- 1% rule
- 100.00% ✓
- Cap rate
- 947.20%
- Cash-on-cash
- 3360.40%
- DSCR
- 150.52
- GRM
- 0.1
CMA / ARV
No comps found within radius.
Projected returns pro-forma
-3.0% appreciation · 3.0% rent growth · sell at horizon
- IRR
- —
- Equity multiple
- 178.83×
- Total profit
- $3,734,381
- Equity at exit
- $11,183
- IRR
- —
- Equity multiple
- 385.72×
- Total profit
- $8,079,106
- Equity at exit
- $6,485
Cash invested: $21,000 (down + closing). Projections, not guarantees.
Landlord ↔ Tenant lean methodology
- Overall (STATE)
- 90 Strongly Landlord-Friendly
- State Mississippi
- 90 Strongly Landlord-Friendly · R+11
- County
- — inherits STATE
- City
- — inherits STATE
ZIP-level market 39325
- Home prices YoY
- -16.7%
- Active inventory
- 27
- Price-to-rent
- 0.1×
Monthly cashflow live
- Estimated rent
- $75,000 medium interval (Pro) →
- Mortgage (P&I)
- −$393
- Tax from tax record
- −$18 /mo · $221/yr
- Insurance
- −$31
- HOA
- −$0
- Vacancy / Maint / Mgmt
- −$15,750
- Net cashflow
- $58,807
Break-even live
UW: 25.0% down · 7.5% · 30yr · 1.5% tax · 5.0% vac · 8.0% maint · 8.0% mgmt
Financing live
Cash to close
- Down payment
- $18,750
- Closing costs
- $2,250
- Reserves months
- —
- Total cash needed
- —
Loan-product check · same deal, 3 products live
Conventional
25% down · 7.5% · 30yr
- Down + closing
- —
- Monthly P&I
- —
- Monthly cashflow
- —
- DSCR
- —
- Eligible?
- —
Personal DTI + credit; lowest rate.
DSCR
20% down · 8.5% · 30yr
- Down + closing
- —
- Monthly P&I
- —
- Monthly cashflow
- —
- DSCR
- —
- Eligible?
- —
No personal income docs; deal must DSCR.
Hard money
10% down · 12.0% · 12mo
- Down + closing
- —
- Monthly P&I
- —
- Monthly cashflow
- —
- DSCR
- —
- Eligible?
- —
Short-term bridge; refi at stabilization.
Rent comps 1 comps
| Address | Beds | Baths | Sqft | Rent | $/sqft | DOM | Units | Dist |
|---|---|---|---|---|---|---|---|---|
| 9507 Highway 19 N Collinsville, MS | 2.0 | 1.0 | 720 | $75,000 | $104.17 | 43d | 1 | 1.01mi |
Listing history 17 events
-
2026-06-19days on market $75,000 Active 24 DOM
-
2026-06-18days on market $75,000 Active 23 DOM
-
2026-06-17days on market $75,000 Active 22 DOM
-
2026-06-16days on market $75,000 Active 21 DOM
-
2026-06-15days on market $75,000 Active 20 DOM
-
2026-06-14days on market $75,000 Active 18 DOM
-
2026-06-12days on market $75,000 Active 17 DOM
-
2026-06-09days on market $75,000 Active 14 DOM
-
2026-06-08days on market $75,000 Active 13 DOM
-
2026-06-07days on market $75,000 Active 12 DOM
-
2026-06-05days on market $75,000 Active 9 DOM
-
2026-06-03days on market $75,000 Active 8 DOM
-
2026-06-02days on market $75,000 Active 7 DOM
-
2026-06-01days on market $75,000 Active 6 DOM
-
2026-05-31days on market $75,000 Active 5 DOM
-
2026-05-30days on market $75,000 Active 4 DOM
-
2026-05-26$75,000 Active
ⓘ Source: listings_history table (triggers on properties + properties_extension) + one-shot
backfill from property_details.listing_events for pre-trigger history.
Tax reassessment forecast MS · Resets to sale price
- Current annual tax
- $221 · $18/mo
- Projected year-2 tax
- $593 · $49/mo
- Expected delta
- +$371/yr (+$31/mo · 167.6%)
ⓘ Screening estimate from a state-policy table — verify with the county assessor before closing.
Climate risk First Street
- Flood 1/10 Low FEMA zone X (unshaded) · 0% chance over 30 yrs
- Wildfire 3/10 Moderate
- Heat 6/10 Major 7 d/yr ≥108°F today · 21 d/yr by 30 yrs out
- Wind 8/10 Severe 80% chance of damaging wind over 30 yrs
- Air quality 1/10 Low 0 unhealthy d/yr today · 0 by 30 yrs out
Nearby sold comps map
Loading sold comps map…
Walkable amenities ~0.75 mi
Loading nearby amenities…
Taxation est. · year 1
- Rental income
- $900,000
- − Mortgage interest
- −$4,201
- − Property taxes
- −$221
- − Insurance
- −$375
- − Repairs & maintenance
- −$72,000
- − Management
- −$72,000
- − Depreciation
- −$2,182
- Taxable income
- $749,021
- Est. tax owed @ 24.0%
- −$179,765
- After-tax cash flow
- $525,919/yr
For passive investors: Depreciation is non-cash, so a rental often shows a tax loss while cash-flowing — sheltering income. Rental losses are passive: they offset passive income freely, and up to $25,000/yr can offset ordinary (W-2) income if you actively participate and your MAGI is under $100k (phasing out to $0 by $150k); unused losses carry forward. On sale, claimed depreciation is recaptured at up to 25%, and gains may owe capital-gains tax (a 1031 exchange can defer both). Figures are a year-1 estimate at your 24.0% rate — not tax advice; consult a CPA.
Schools (NCES district)
- District
- Lauderdale County School District
- NCES district ID
- 2802430
- Math proficiency
- 37% ▼ -11.00%
- Reading proficiency
- 41% ▼ -4.00%
- Median HH income
- $45,778
- Composite
- 33.25/100
- National rank
- #5517
- State rank
- #39 of 130 in MS
Livability — Collinsville
- Score
- 72/100
- State rank
- #25
- US rank
- #6359
Category grades
Schools grade is shown separately in the Schools card above.
Census & demographics
- Census place
- Collinsville, MS
- Population (ZIP)
- 6,064
Population outlook (Lauderdale County) Hauer SSP2
- Today (2025)
- 75,158 people
- By 2030
- 72,770 · -3.2%
- By 2040
- 67,309 · -10.4%
- By 2050
- 61,797 · -17.8%
- By 2075
- 49,790 · -33.8%
- By 2100
- 39,797 · -47.0%
Race, ethnicity, and origin ACS 2023
- Neighborhood character
- Predominantly White (86%)
- Race & ethnicity
- White 86% Black 12%
- Common ancestry
- Lithuanian 1% Serbian 1%
- Foreign-born
- 1% · Vietnam
- Languages at home
- 98% English-only · Chinese 1% Spanish 1%
Political lean MEDSL · Lauderdale
- 2024 margin
- Strong R (+21.2) · D 39.0% · R 60.2%
- 2008→2024 swing
- -2.3pp toward R · 2008: -18.9pp · 2024: -21.2pp
- All cycles
- 2024: R+21.2 2020: R+16.0 2016: R+23.0 2012: R+15.5 2008: R+18.9
Not yet ingested
- Civics
- —
Market trends
- HPI YoY
- ▼ -27.84%
- Current HPI
- 138.6021
- Rent YoY
- —
- Metro
- —
- State GDP YoY
- —
- F500 in state
- 0
Price history
1 event — show timeline
- 2026-05-26 Listed $75,000 FSBO.com
Property tax history
+2.1%/yrLatest (2025): $221 · +0.0% YoY. Source: county tax records.
Cash-flow waterfall
monthlySold comps — $/sqft
last 12 mo · ≤1 miLoading sold comps…