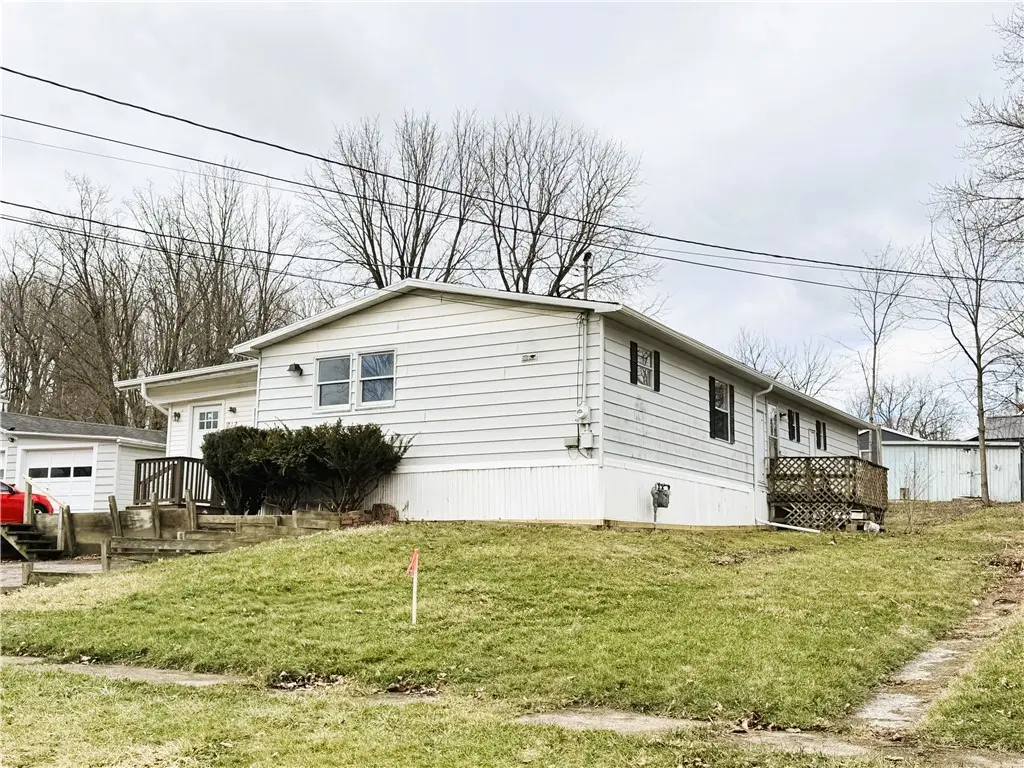
13 1/2 Walnut St · Mount Morris, NY
Flood risk 1/10 · Minimal
- FEMA flood zone
- X
- Chance of flooding over 30 yrs
- 0.0%
- Est. flood insurance / yr
- $473 – $860
Fire risk 2/10 · Minimal
- Est. fire insurance / yr
- $691 – $1,283
Heat risk 2/10 · Minimal
- Hot days now (above 97°F)
- 7 days/yr
- Hot days in 30 yrs
- 16 days/yr
Wind risk 1/10 · Minimal
- Chance of severe wind over 30 yrs
- —
Air-quality risk 1/10 · Minimal
- Unhealthy air days now
- 0 days/yr
- Unhealthy air days in 30 yrs
- 0 days/yr
Risk factors via First Street. Map © Google.
Why this score? — see what drove the D grade
The composite is a weighted blend of 9 inputs, each scored 0–100. Each bar is that input's sub-score; the figure is the points it added to the 100-point composite (weight × sub-score).
- Cash flow +10.7/30.0
- ARV discount +7.7/15.0
- Appreciation +4.6/10.0
- Schools +3.3/10.0
- 1% rule +3.1/10.0
- DSCR +3.1/10.0
- Livability +3.0/5.0
- Rent growth +2.5/5.0
- Condition / age +2.5/5.0
$149,900
🖨 Deal sheet 📄 Offer letter ✓ Due diligence
Listing remarks
Welcome to village living! This could be your new home nothing to do but move in!!! So many Renovations, this home has gone through so many upgrades. Very spacious, Very nice back yard for those warm days ahead. Extra room for office, play room you decide
Key facts
- Extra room
- Many renovations
- Nice back yard
Tags
Neighborhood map
What this means for you Summary
Snapshot
- This is a 3-bed/2.0-bath single-family listed at $150k.
Deal economics
- At list price, monthly cash flow is $-72 ($-859/yr) — negative.
- To cash-flow at today's rent, offer at most $140k (6.9% below list).
- To meet the 1% rule (rent ≥ 1% of price), the offer needs to be $122k (18.6% below list).
- Recommended offer: $122k (18.6% below list) — sets the bar for 1% rule.
Location & tenants
- Location reads 59/100 on livability (#1,027 in NY) — a working-class tenant base; expect higher turnover. Strengths: cost of living A+, housing A+, crime B; Watch: schools F, amenities F, commute F.
- Mount Morris Central School District (town): math 31% / reading 47% proficiency, ranked #537 of 590 in NY (top 91%) — families likely to look elsewhere, expect single-tenant / working-renter base with shorter leases.
- Market conditions: 27 active listings in the ZIP; 86 units permitted in Livingston County in 2024 (0 in 5+ unit buildings).
Forward outlook
- Local home prices are declining (-0.8%/yr); year-one equity from $1k of loan paydown is wiped out by about $1k of value loss. Plan a longer hold.
- Livingston County population projected at -13% by 2050 — secular population decline; favor cash flow + early exit over multi-decade hold.
Negotiation context
- It's been on market 27 days — a 2% lower offer ($148k) is reasonable based on typical stale-listing flexibility.
Questions for the listing agent
- What do current leases actually rent for vs. the listed asking? Can we see a recent rent roll and the last 12 months of T-12 income?
- Built in 1977 — when were the roof, HVAC, electrical panel, plumbing, and water heater last replaced?
- Is there a deadline driving the sale (1031 exchange, divorce, estate, relocation)? That informs how much negotiation room exists.
- Schools are F-rated, which usually means shorter tenancies and higher turnover. Who's the typical renter profile here, and what's been the actual vacancy rate?
- The area grade is low — what's the realistic commute time and amenity access for the typical tenant pool here? Any planned neighborhood developments (good or bad) we should know about?
- What's the average days-on-market for RENTAL listings here right now (not sales)? A rising rental-DOM trend means longer vacancies and softer asking-rent achievability than the comps imply.
- What's the recent tenant-quality profile in this submarket — average credit score on applications, eviction rate, late-payment / NSF rate, and stable-employment percentage? A property-management company in the area should have these aggregated.
- How much new for-sale + rental construction is in the pipeline within 1–3 miles? Heavy new supply typically softens prices + rents 12–24 months out; constrained supply supports both.
Investment metrics
- 1% rule
- 0.81% ✗
- Cap rate
- 5.72%
- Cash-on-cash
- -2.05%
- DSCR
- 0.91
- GRM
- 10.2
CMA / ARV
- ARV (on-the-fly)
- $150,528
- Comps found
- 12
Show comp detail 12 sales within ~0.75 mi
| Address | Dist | Beds/Ba | Sqft | Sold | Price | $/sf | Match |
|---|---|---|---|---|---|---|---|
| 13 1/2 Walnut St | 0.00mi | 3/2.0 | 1,344 (0%) | 1mo | $150,150 | $112 | 99 |
| 120 Chapel St | 0.10mi | 3/2.0 | 1,404 (+4%) | 2mo | $185,000 | $132 | 86 |
| 70 Murray St | 0.18mi | 3/1.0 | 1,346 (+0%) | 7mo | $152,600 | $113 | 82 |
| 57 Chapel St | 0.35mi | 3/1.0 | 1,423 (+6%) | 14mo | $115,000 | $81 | 58 |
| 34 Damonsville St | 0.40mi | 4/1.5 (+1) | 1,440 (+7%) | 5mo | $175,000 | $122 | 58 |
| 52 Eagle St | 0.37mi | 4/2.0 (+1) | 1,522 (+13%) | 4mo | $65,000 | $43 | 52 |
| 11 Spring St | 0.68mi | 4/1.0 (+1) | 1,380 (+3%) | 5mo | $150,000 | $109 | 51 |
| 71 Hopkins St | 0.26mi | 2/1.0 (-1) | 1,168 (-13%) | 8mo | $118,000 | $101 | 51 |
| 17 Lake St | 0.61mi | 3/1.0 | 1,224 (-9%) | 5mo | $95,000 | $78 | 48 |
| 178 Main St | 0.69mi | 3/1.0 | 1,457 (+8%) | 6mo | $164,900 | $113 | 45 |
| 120 Stanley St | 0.64mi | 3/1.5 | 1,152 (-14%) | 2mo | $193,000 | $168 | 43 |
| 43 Genesee St | 0.66mi | 2/2.0 (-1) | 1,242 (-8%) | 14mo | $72,900 | $59 | 40 |
Match score weights: distance 35% · size 25% · config 20% · recency 20%. Top-matched comps best support the ARV.
Projected returns pro-forma
-0.82% appreciation · 3.0% rent growth · sell at horizon
- IRR
- -7.9%
- Equity multiple
- 0.65×
- Total profit
- $-14,581
- Equity at exit
- $37,509
- IRR
- -1.2%
- Equity multiple
- 0.88×
- Total profit
- $-4,985
- Equity at exit
- $40,527
Cash invested: $41,972 (down + closing). Projections, not guarantees.
Landlord ↔ Tenant lean methodology
- Overall (STATE)
- 15 Strongly Tenant-Friendly
- State New York
- 15 Strongly Tenant-Friendly · D+10
- County
- — inherits STATE
- City
- — inherits STATE
ZIP-level market 14510
- Home prices YoY
- -0.3%
- Active inventory
- 27
- Price-to-rent
- 10.2×
Monthly cashflow live
- Estimated rent
- $1,221 medium interval (Pro) →
- Mortgage (P&I)
- −$786
- Tax est. 1.5%
- −$187 /mo · $2,248/yr
- Insurance
- −$62
- HOA
- −$0
- Vacancy / Maint / Mgmt
- −$256
- Net cashflow
- $-72
Break-even live
UW: 25.0% down · 7.5% · 30yr · 1.5% tax · 5.0% vac · 8.0% maint · 8.0% mgmt
Financing live
Cash to close
- Down payment
- $37,475
- Closing costs
- $4,497
- Reserves months
- —
- Total cash needed
- —
Loan-product check · same deal, 3 products live
Conventional
25% down · 7.5% · 30yr
- Down + closing
- —
- Monthly P&I
- —
- Monthly cashflow
- —
- DSCR
- —
- Eligible?
- —
Personal DTI + credit; lowest rate.
DSCR
20% down · 8.5% · 30yr
- Down + closing
- —
- Monthly P&I
- —
- Monthly cashflow
- —
- DSCR
- —
- Eligible?
- —
No personal income docs; deal must DSCR.
Hard money
10% down · 12.0% · 12mo
- Down + closing
- —
- Monthly P&I
- —
- Monthly cashflow
- —
- DSCR
- —
- Eligible?
- —
Short-term bridge; refi at stabilization.
Listing history 2 events
-
2026-04-04status Pending
-
2026-03-08$149,900 Active
ⓘ Source: listings_history table (triggers on properties + properties_extension) + one-shot
backfill from property_details.listing_events for pre-trigger history.
Climate risk First Street
- Flood 1/10 Low FEMA zone X · 0% chance over 30 yrs
- Wildfire 2/10 Low
- Heat 2/10 Low 7 d/yr ≥97°F today · 16 d/yr by 30 yrs out
- Wind 1/10 Low
- Air quality 1/10 Low 0 unhealthy d/yr today · 0 by 30 yrs out
Nearby sold comps map
Loading sold comps map…
Walkable amenities ~0.75 mi
Loading nearby amenities…
Taxation est. · year 1
- Rental income
- $14,649
- − Mortgage interest
- −$8,397
- − Property taxes
- −$2,248
- − Insurance
- −$750
- − Repairs & maintenance
- −$1,172
- − Management
- −$1,172
- − Depreciation
- −$4,361
- Taxable loss
- −$3,451
- Est. tax savings @ 24.0%
- +$828
- After-tax cash flow
- $-31/yr
For passive investors: Depreciation is non-cash, so a rental often shows a tax loss while cash-flowing — sheltering income. Rental losses are passive: they offset passive income freely, and up to $25,000/yr can offset ordinary (W-2) income if you actively participate and your MAGI is under $100k (phasing out to $0 by $150k); unused losses carry forward. On sale, claimed depreciation is recaptured at up to 25%, and gains may owe capital-gains tax (a 1031 exchange can defer both). Figures are a year-1 estimate at your 24.0% rate — not tax advice; consult a CPA.
Schools (NCES district)
- District
- Mount Morris Central School District
- NCES district ID
- 3620010
- Math proficiency
- 31% ▼ -3.00%
- Reading proficiency
- 47% ▲ 10.00%
- Median HH income
- $42,913
- Composite
- 32.93/100
- National rank
- #5596
- State rank
- #537 of 590 in NY
Livability — Mount Morris
- Score
- 59/100
- State rank
- #1027
- US rank
- #20058
Category grades
Schools grade is shown separately in the Schools card above.
Census & demographics
- Census place
- Mount Morris, NY
- Population (ZIP)
- 4,781
Population outlook (Livingston County) Hauer SSP2
- Today (2025)
- 63,466 people
- By 2030
- 61,966 · -2.4%
- By 2040
- 58,398 · -8.0%
- By 2050
- 54,955 · -13.4%
- By 2075
- 49,958 · -21.3%
- By 2100
- 43,944 · -30.8%
Race, ethnicity, and origin ACS 2023
- Neighborhood character
- Predominantly White (89%)
- Race & ethnicity
- White 89% Hispanic / Latino 6% Two or more races 6%
- Hispanic origin (detail)
- Puerto Rican 5%
- Common ancestry
- Portuguese 4% Lithuanian 2% Serbian 2%
- Foreign-born
- 1%
- Languages at home
- 94% English-only · Spanish 3% German/W. Germanic 2% French/Haitian/Cajun 1%
Political lean MEDSL · Livingston
- 2024 margin
- Strong R (+21.4) · D 39.3% · R 60.7%
- 2008→2024 swing
- -13.6pp toward R · 2008: -7.9pp · 2024: -21.4pp
- All cycles
- 2024: R+21.4 2020: R+18.2 2016: R+27.8 2012: R+9.4 2008: R+7.9
Not yet ingested
- Civics
- —
Market trends
- HPI YoY
- ▼ -0.82%
- Current HPI
- 250.0593
- Rent YoY
- —
- Metro
- —
- State GDP YoY
- ▲ 2.60%
- F500 in state
- 92
Industry mix (Fortune 500 HQ in NY)
| Industry | F500 HQs | Revenue |
|---|---|---|
| Financial Services | 10 | $950B |
|
||
| Consumer Goods | 9 | $162B |
|
||
| Insurance | 4 | $225B |
|
||
| Telecommunications | 2 | $144B |
|
||
| Pharmaceuticals | 2 | $112B |
|
||
| Media / Entertainment | 2 | $69B |
|
||
Price history
2 events — show timeline
- 2026-04-04 Pending — UNYREIS
- 2026-03-08 Listed $149,900 UNYREIS
Cash-flow waterfall
monthlySold comps — $/sqft
last 12 mo · ≤1 miLoading sold comps…