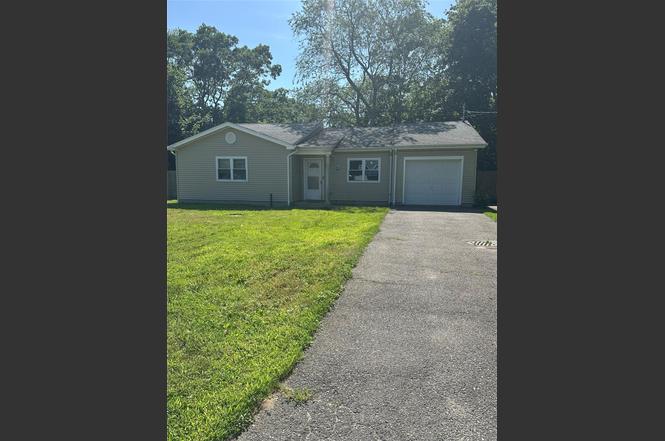
752 Bayview Ave · North Bellport, NY
Flood risk 1/10 · Minimal
- FEMA flood zone
- X (unshaded)
- Chance of flooding over 30 yrs
- 0.0%
- Est. flood insurance / yr
- $507 – $1,088
Fire risk 2/10 · Minimal
- Est. fire insurance / yr
- $691 – $1,283
Heat risk 4/10 · Minor
- Hot days now (above 93°F)
- 7 days/yr
- Hot days in 30 yrs
- 18 days/yr
Wind risk 8/10 · Major
- Chance of severe wind over 30 yrs
- 80.0%
Air-quality risk 4/10 · Minor
- Unhealthy air days now
- 3 days/yr
- Unhealthy air days in 30 yrs
- 5 days/yr
Risk factors via First Street. Map © Google.
Why this score? — see what drove the C grade
The composite is a weighted blend of 9 inputs, each scored 0–100. Each bar is that input's sub-score; the figure is the points it added to the 100-point composite (weight × sub-score).
- Cash flow +17.0/30.0
- ARV discount +15.0/15.0
- DSCR +5.3/10.0
- 1% rule +5.2/10.0
- Schools +4.5/10.0
- Livability +3.1/5.0
- Rent growth +2.5/5.0
- Condition / age +2.5/5.0
- Appreciation +0.0/10.0
$355,000
🖨 Deal sheet (PDF) 📄 Offer letter ✓ Due diligence
Listing remarks
HUGE PRICE REDUCTION! Great Starter Ranch House for 1st Time Buyer with 1,308 Square Feet in Excellent Condition. Walk into Living Room Open to Large Kitchen / Dining Room with Door into Backyard and Attached 220 Square Foot Garage with Boiler Room. Half Bath and Bedroom Off of Living Room, Stackable Washer and Dryer in Hallway Next to Primary Bedroom, 3rd Bedroom and Full Bath with Tub. Fenced Property Size of 80' x 100'. Low Taxes of $7,406. Gas Hot Air Heat. Buyer Must Comply with the Following Conditions: * Buyer's GROSS Income Must be Below 80% of the Established Suffolk County Income Based on Family Size per this Chart: Income Range % of Median: 80% 1 Person: $92,230 2 Persons: $10
Key facts
- 0.23 acre lot
- Garage
- Built 2014
Neighborhood map
What this means for you Summary
Snapshot
- This is a 3-bed/1.5-bath single-family listed at $355k.
Deal economics
- At list price, monthly cash flow is $238 ($3k/yr) — positive.
- The deal already cash-flows at list — no discount required.
- Meets the 1% rule at list price ($4k rent vs $355k).
- Recommended offer: $344k (3.0% below list) — sets the bar for market timing.
- Cap rate 7.1% vs local median 4.9% in North Bellport — top-decile yield for the area; either an underpriced asset or a hidden risk that comps aren't pricing in. Stress-test before assuming the spread holds.
Location & tenants
- Location reads 62/100 on livability (#842 in NY) — a middle-class / working-renter tenant base. Strengths: employment A+, housing A+; Watch: crime C-, amenities F, commute F.
- South Country Central School District (suburban): math 50% / reading 44% proficiency, ranked #460 of 755 in NY (top 61%) — families likely to look elsewhere, expect single-tenant / working-renter base with shorter leases.
- Zoned schools: Brookhaven Elementary School (506 students, 41% FRL); Bellport Middle School (math 64% / reading 54%, grade B, #161 of 729 statewide, top 24%, 838 students, 56% FRL); Bellport Senior High School (math 86% / reading 64%, grade A-, #630 of 1,100 statewide, top 57%, 1,392 students, 52% FRL).
- Zoned-school proficiency averages 67% at this address vs 47% district-wide (+20 pts) — the actual schools serving this property are materially stronger than the South Country Central School District average implies; a family-tenant draw the district grade alone would hide.
- Market conditions: 57 active listings in the ZIP; 8 comparable units currently listed for rent nearby; rentals at typical pace (median 20d on market — plan ~3-4 weeks tenant-placement turnaround); 1,366 units permitted in Suffolk County in 2024 (216 in 5+ unit buildings).
Forward outlook
- Local home prices are declining (-3.0%/yr); year-one equity from $2k of loan paydown is wiped out by about $11k of value loss. Plan a longer hold.
- Suffolk County population projected to shrink 5% by 2050 — rents likely to lag national; underwrite the cash flow, not the appreciation.
Negotiation context
- It's been on market 38 days — a 3% lower offer ($344k) is reasonable based on typical stale-listing flexibility.
Risks & watch-outs
- Climate carrying-cost: severe wind risk, 80% chance of damaging wind over 30y — expect insurance premiums to compound above CPI over the hold.
Questions for the listing agent
- It's been on market 38 days. Have you received any prior offers? Is the seller open to a 3% concession, seller financing, or rate buy-down credit?
- Is there a deadline driving the sale (1031 exchange, divorce, estate, relocation)? That informs how much negotiation room exists.
- Schools are F-rated, which usually means shorter tenancies and higher turnover. Who's the typical renter profile here, and what's been the actual vacancy rate?
- What's the average days-on-market for RENTAL listings here right now (not sales)? A rising rental-DOM trend means longer vacancies and softer asking-rent achievability than the comps imply.
- What's the recent tenant-quality profile in this submarket — average credit score on applications, eviction rate, late-payment / NSF rate, and stable-employment percentage? A property-management company in the area should have these aggregated.
- How much new for-sale + rental construction is in the pipeline within 1–3 miles? Heavy new supply typically softens prices + rents 12–24 months out; constrained supply supports both.
Investment metrics
- 1% rule
- 1.02% ✓
- Cap rate
- 7.10%
- Cash-on-cash
- 2.88%
- DSCR
- 1.13
- GRM
- 8.1
CMA / ARV
- ARV (on-the-fly)
- $486,576
- Comps found
- 12
Show comp detail 12 sales within ~0.75 mi
| Address | Dist | Beds/Ba | Sqft | Sold | Price | $/sf | Match |
|---|---|---|---|---|---|---|---|
| 534 Meade Ave | 0.59mi | 3/1.5 | 1,308 (0%) | 8mo | $350,000 | $268 | 65 |
| 716 Narragansett Ave | 0.72mi | 4/2.0 (+1) | 1,291 (-1%) | 0mo | $435,000 | $337 | 57 |
| 556 Macdonald Ave | 0.48mi | 4/2.0 (+1) | 1,329 (+2%) | 15mo | $470,000 | $354 | 56 |
| 761 Provost Ave | 0.38mi | 3/1.0 | 1,200 (-8%) | 14mo | $440,000 | $367 | 55 |
| 649 Bourdois Ave | 0.32mi | 4/2.0 (+1) | 1,204 (-8%) | 13mo | $515,000 | $428 | 54 |
| 825 Doane Ave | 0.10mi | 4/1.0 (+1) | 1,112 (-15%) | 11mo | $505,000 | $454 | 54 |
| 718 Taylor Ave | 0.52mi | 4/2.0 (+1) | 1,224 (-6%) | 8mo | $580,000 | $474 | 51 |
| 425 Macdonald Ave | 0.61mi | 3/1.5 | 1,140 (-13%) | 0mo | $579,000 | $508 | 50 |
| 507 Scherger Ave | 0.68mi | 3/1.0 | 1,386 (+6%) | 9mo | $516,000 | $372 | 49 |
| 562 Provost Ave | 0.51mi | 3/1.0 | 1,200 (-8%) | 18mo | $409,000 | $341 | 46 |
| 834 Bellport Ave #834 | 0.33mi | 4/1.0 (+1) | 1,500 (+15%) | 17mo | $495,000 | $330 | 39 |
| 62 Beaver Dam Rd | 0.70mi | 3/2.5 | 1,140 (-13%) | 12mo | $560,000 | $491 | 32 |
Match score weights: distance 35% · size 25% · config 20% · recency 20%. Top-matched comps best support the ARV.
Projected returns pro-forma
-3.0% appreciation · 3.0% rent growth · sell at horizon
- IRR
- -11.7%
- Equity multiple
- 0.58×
- Total profit
- $-42,174
- Equity at exit
- $52,932
- IRR
- -2.5%
- Equity multiple
- 0.83×
- Total profit
- $-16,496
- Equity at exit
- $30,694
Cash invested: $99,400 (down + closing). Projections, not guarantees.
Landlord ↔ Tenant lean methodology
- Overall (STATE)
- 15 Strongly Tenant-Friendly
- State New York
- 15 Strongly Tenant-Friendly · D+10
- County
- — inherits STATE
- City
- — inherits STATE
ZIP-level market 11713
- Home prices YoY
- -26.0%
- Active inventory
- 57
- Price-to-rent
- 8.1×
Monthly cashflow live
- Estimated rent
- $3,636 high interval (Pro) →
- Mortgage (P&I)
- −$1,862
- Tax from tax record
- −$624 /mo · $7,491/yr
- Insurance
- −$148
- HOA
- −$0
- Vacancy / Maint / Mgmt
- −$764
- Net cashflow
- $238
Break-even live
Sensitivity live
| Price | -10% $439 | -5% $339 | +0% $238 | +5% $138 | +10% $37 |
|---|---|---|---|---|---|
| Rent | -10% $-49 | -5% $95 | +0% $238 | +5% $382 | +10% $526 |
| Rate | -1.0pp $417 | -0.5pp $329 | base $238 | +0.5pp $146 | +1.0pp $53 |
UW: 25.0% down · 7.5% · 30yr · 1.5% tax · 5.0% vac · 8.0% maint · 8.0% mgmt
Financing live
Cash to close
- Down payment
- $88,750
- Closing costs
- $10,650
- Reserves months
- —
- Total cash needed
- —
Loan-product check · same deal, 3 products live
Conventional
25% down · 7.5% · 30yr
- Down + closing
- —
- Monthly P&I
- —
- Monthly cashflow
- —
- DSCR
- —
- Eligible?
- —
Personal DTI + credit; lowest rate.
DSCR
20% down · 8.5% · 30yr
- Down + closing
- —
- Monthly P&I
- —
- Monthly cashflow
- —
- DSCR
- —
- Eligible?
- —
No personal income docs; deal must DSCR.
Hard money
10% down · 12.0% · 12mo
- Down + closing
- —
- Monthly P&I
- —
- Monthly cashflow
- —
- DSCR
- —
- Eligible?
- —
Short-term bridge; refi at stabilization.
Rent comps 8 comps
| Address | Beds | Baths | Sqft | Rent | $/sqft | DOM | Units | Dist |
|---|---|---|---|---|---|---|---|---|
| 655 Post Ave Bellport, NY | 3.0 | 1.0 | 1008 | $3,350 | $3.32 | 11d | 1 | 0.21mi |
| 640 Post Ave Bellport, NY | 3.0 | 1.0 | 1024 | $3,600 | $3.52 | 11d | 1 | 0.22mi |
| 849 Walker Ave Bellport, NY | 3.0 | 1.0 | 884 | $3,500 | $3.96 | 5d | 1 | 0.29mi |
| 718 Provost Ave Bellport, NY | 4.0 | 1.0 | 1100 | $4,000 | $3.64 | 44d | 1 | 0.40mi |
| 91 Circuit Rd Bellport, NY | 3.0 | 1.5 | 1154 | $4,500 | $3.90 | 25d | 1 | 1.12mi |
| 262 N Dunton Ave East Patchogue, NY | 3.0 | 1.0 | 1778 | $3,900 | $2.19 | 14d | 1 | 1.36mi |
| 58 N Howells Point Rd Bellport, NY | 3.0 | 2.0 | 1404 | $15,000 | $10.68 | 19d | 1 | 1.40mi |
| 47 Station Rd Bellport, NY | 2.0 | 1.0 | 1104 | $3,500 | $3.17 | 44d | 1 | 1.43mi |
Listing history 5 events
-
2025-09-25status Pending
-
2025-07-31price $355,000
-
2025-07-10price $375,000
-
2025-07-03price $394,990
-
2025-06-25$399,990 Active
ⓘ Source: listings_history table (triggers on properties + properties_extension) + one-shot
backfill from property_details.listing_events for pre-trigger history.
Tax reassessment forecast NY · Partial reset (capped growth)
- Current annual tax
- $7,491 · $624/mo
- Projected year-2 tax
- $7,491 · $624/mo
- Expected delta
- $0/yr ($0/mo · 0.0%)
ⓘ Screening estimate from a state-policy table — verify with the county assessor before closing.
Climate risk First Street
- Flood 1/10 Low FEMA zone X (unshaded) · 0% chance over 30 yrs
- Wildfire 2/10 Low
- Heat 4/10 Moderate 7 d/yr ≥93°F today · 18 d/yr by 30 yrs out
- Wind 8/10 Severe 80% chance of damaging wind over 30 yrs
- Air quality 4/10 Moderate 3 unhealthy d/yr today · 5 by 30 yrs out
Nearby sold comps map
Loading sold comps map…
Walkable amenities ~0.75 mi
Loading nearby amenities…
Taxation est. · year 1
- Rental income
- $43,629
- − Mortgage interest
- −$19,886
- − Property taxes
- −$7,491
- − Insurance
- −$1,775
- − Repairs & maintenance
- −$3,490
- − Management
- −$3,490
- − Depreciation
- −$10,327
- Taxable loss
- −$2,830
- Est. tax savings @ 24.0%
- +$679
- After-tax cash flow
- $3,540/yr
For passive investors: Depreciation is non-cash, so a rental often shows a tax loss while cash-flowing — sheltering income. Rental losses are passive: they offset passive income freely, and up to $25,000/yr can offset ordinary (W-2) income if you actively participate and your MAGI is under $100k (phasing out to $0 by $150k); unused losses carry forward. On sale, claimed depreciation is recaptured at up to 25%, and gains may owe capital-gains tax (a 1031 exchange can defer both). Figures are a year-1 estimate at your 24.0% rate — not tax advice; consult a CPA.
Schools (NCES district)
- District
- South Country Central School District
- NCES district ID
- 3600008
- Math proficiency
- 50% ▲ 4.00%
- Reading proficiency
- 44% ▲ 4.00%
- Median HH income
- $74,049
- Composite
- 44.75/100
- National rank
- #5960
- State rank
- #460 of 755 in NY
Livability — North Bellport
- Score
- 62/100
- State rank
- #842
- US rank
- #16345
Category grades
Schools grade is shown separately in the Schools card above.
Census & demographics
- Census place
- North Bellport, NY
- City population
- 9,236
- Population (ZIP)
- 9,236
Population outlook (Suffolk County) Hauer SSP2
- Today (2025)
- 1,505,262 people
- By 2030
- 1,498,318 · -0.5%
- By 2040
- 1,471,101 · -2.3%
- By 2050
- 1,424,848 · -5.3%
- By 2075
- 1,337,157 · -11.2%
- By 2100
- 1,217,720 · -19.1%
Race, ethnicity, and origin ACS 2023
- Neighborhood character
- Diverse neighborhood (Simpson 0.64)
- Race & ethnicity
- White 50% Hispanic / Latino 30% Black 14% Two or more races 10% Asian 2%
- Hispanic origin (detail)
- Mexican 2% Puerto Rican 3% Dominican 1%
- Common ancestry
- Romanian 4% Italian 1% Lithuanian 1%
- Foreign-born
- 23% · Canada, Jamaica, China
- Languages at home
- 72% English-only · Spanish 23% Other Indo-European 3%
Political lean MEDSL · Suffolk
- 2024 margin
- Lean R (+10.0) · D 45.0% · R 55.0%
- 2008→2024 swing
- -16.0pp toward R · 2008: 6.0pp · 2024: -10.0pp
- All cycles
- 2024: R+10.0 2020: R+0.0 2016: R+8.2 2012: D+2.9 2008: D+6.0
Not yet ingested
- Civics
- —
Market trends
- HPI YoY
- ▼ -148.23%
- Current HPI
- 421.2165
- Rent YoY
- —
- Metro
- —
- State GDP YoY
- ▲ 2.60%
- F500 in state
- 92
Industry mix (Fortune 500 HQ in NY)
| Industry | F500 HQs | Revenue |
|---|---|---|
| Financial Services | 10 | $950B |
|
||
| Consumer Goods | 9 | $162B |
|
||
| Insurance | 4 | $225B |
|
||
| Telecommunications | 2 | $144B |
|
||
| Pharmaceuticals | 2 | $112B |
|
||
| Media / Entertainment | 2 | $69B |
|
||
Price history
-11.2% since first listed5 events — show timeline
- 2025-09-25 Pending — OneKey® MLS as Distributed by MLS Grid
- 2025-07-31 Price Changed $355,000 OneKey® MLS as Distributed by MLS Grid
- 2025-07-10 Price Changed $375,000 OneKey® MLS as Distributed by MLS Grid
- 2025-07-03 Price Changed $394,990 OneKey® MLS as Distributed by MLS Grid
- 2025-06-25 Listed $399,990 OneKey® MLS as Distributed by MLS Grid
Property tax history
+27.8%/yrLatest (2025): $7,491 · +0.0% YoY. Source: county tax records.
Cash-flow waterfall
monthlySold comps — $/sqft
last 12 mo · ≤1 miLoading sold comps…