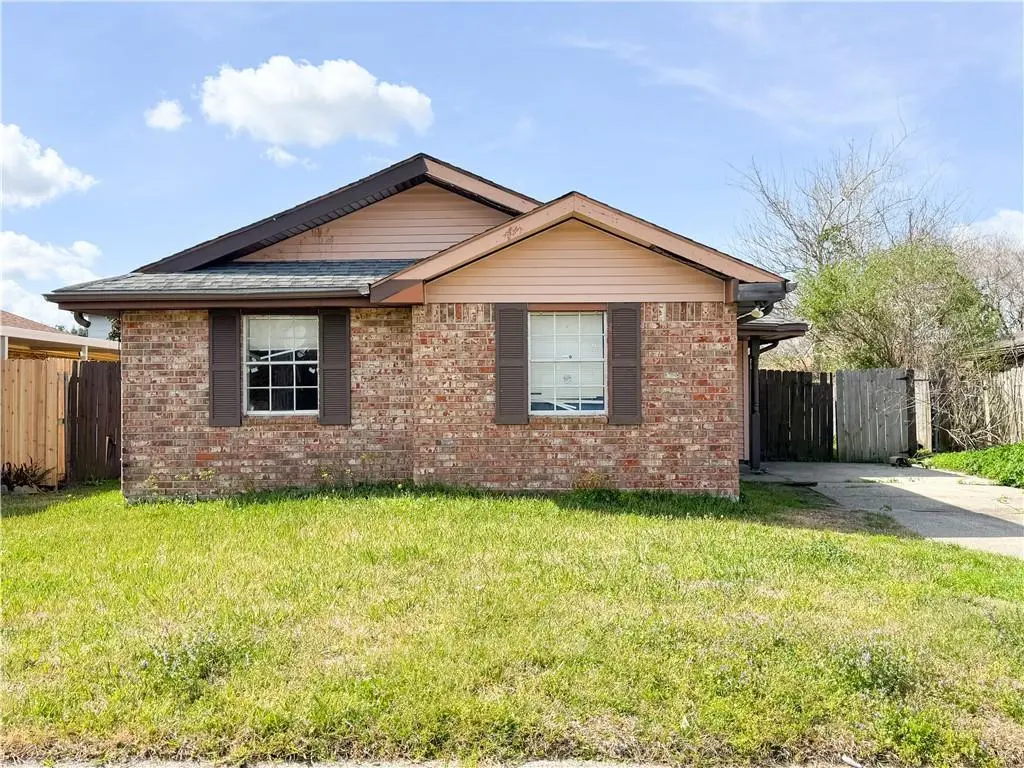
7596 Morel St · New Orleans, LA
Flood risk 8/10 · Major
- FEMA flood zone
- X (shaded)
- Chance of flooding over 30 yrs
- 0.6%
- Est. flood insurance / yr
- $507 – $1,088
Fire risk 3/10 · Minor
- Est. fire insurance / yr
- $1,269 – $2,357
Heat risk 10/10 · Severe
- Hot days now (above 107°F)
- 7 days/yr
- Hot days in 30 yrs
- 22 days/yr
Wind risk 10/10 · Severe
- Chance of severe wind over 30 yrs
- 99.0%
Air-quality risk 3/10 · Minor
- Unhealthy air days now
- 2 days/yr
- Unhealthy air days in 30 yrs
- 3 days/yr
Risk factors via First Street. Map © Google.
Why this score? — see what drove the C grade
The composite is a weighted blend of 9 inputs, each scored 0–100. Each bar is that input's sub-score; the figure is the points it added to the 100-point composite (weight × sub-score).
- Cash flow +23.4/30.0
- ARV discount +12.0/15.0
- DSCR +7.5/10.0
- 1% rule +5.4/10.0
- Livability +4.0/5.0
- Rent growth +2.5/5.0
- Condition / age +2.5/5.0
- Schools +1.6/10.0
- Appreciation +0.0/10.0
$139,000
🖨 Deal sheet 📄 Offer letter ✓ Due diligence
Listing remarks MLS
Beautiful 3-bedroom, 2-bath single-family home featuring central A/C and desirable interior upgrades. The living room offers vaulted ceilings for an open feel and is wired for surround sound, as is the spacious primary bedroom. Kitchen includes granite countertops and ample cabinet storage. The primary suite features a walk-in closet for added convenience. It includes a large, fenced backyard great for outdoor enjoyment. Property is well-suited as a starter home or investment property.
Key facts
- Interior upgrades
- Central a/c
- Vaulted ceilings
Tags
Neighborhood map
What this means for you Summary
Snapshot
- This is a 3-bed/2.0-bath single-family listed at $139k.
Deal economics
- At list price, monthly cash flow is $189 ($2k/yr) — positive.
- The deal already cash-flows at list — no discount required.
- Meets the 1% rule at list price ($1k rent vs $139k).
- Recommended offer: $126k (9.0% below list) — sets the bar for market timing.
- Cap rate 8.5% vs local median 4.4% in New Orleans — top-decile yield for the area; either an underpriced asset or a hidden risk that comps aren't pricing in. Stress-test before assuming the spread holds.
Location & tenants
- Location reads 81/100 on livability (#3 in LA, #1,383 nationally) — a professional / high-income tenant draw. Strengths: amenities A+, commute A+, health & safety A+; Watch: crime C-, employment D.
- Orleans Parish (urban): math 11% / reading 27% proficiency, ranked #69 of 98 in LA (top 70%) — low school quality limits family demand, transient renter base, plan for 1-2y turnover; 68% free/reduced lunch — lower-income household profile, screen leases tightly.
- Market conditions: 105 active listings in the ZIP; 15 comparable units currently listed for rent nearby; rentals at typical pace (median 24d on market — plan ~3-4 weeks tenant-placement turnaround); 710 units permitted in Orleans Parish in 2024 (244 in 5+ unit buildings).
Forward outlook
- Local home prices are declining (-3.0%/yr); year-one equity from $961 of loan paydown is wiped out by about $4k of value loss. Plan a longer hold.
- Orleans County population projected at +61% by 2050 — long-run rental-demand tailwind backs the buy-and-hold thesis.
Negotiation context
- It's been on market 111 days — a 9% lower offer ($126k) is reasonable based on typical stale-listing flexibility.
- 8 sale attempts since 22y ago with the ask held roughly flat each time — persistent listings suggest the price (not the market) is what's stuck; bring a comps-based counter.
- Current owner paid $69k; list at $139k implies a 101% gain — meaningful room to come down on a strong offer.
Risks & watch-outs
- Watch-outs: flood insurance adds $66/mo.
- Climate carrying-cost: severe flood risk; severe wind risk, 99% chance of damaging wind over 30y; extreme-heat days projected 7→22/yr by 2055 (HVAC capex compounding) — expect insurance premiums to compound above CPI over the hold.
Questions for the listing agent
- It's been on market 111 days. Have you received any prior offers? Is the seller open to a 9% concession, seller financing, or rate buy-down credit?
- What's the actual annual flood-insurance premium (NFIP or private), and is the property in a SFHA with mandatory coverage?
- Why hasn't it sold? Are there any deal-killer items the seller is aware of (foundation, flood, title, zoning, code violations)?
- Is there a deadline driving the sale (1031 exchange, divorce, estate, relocation)? That informs how much negotiation room exists.
- What's the average days-on-market for RENTAL listings here right now (not sales)? A rising rental-DOM trend means longer vacancies and softer asking-rent achievability than the comps imply.
- What's the recent tenant-quality profile in this submarket — average credit score on applications, eviction rate, late-payment / NSF rate, and stable-employment percentage? A property-management company in the area should have these aggregated.
- How much new for-sale + rental construction is in the pipeline within 1–3 miles? Heavy new supply typically softens prices + rents 12–24 months out; constrained supply supports both.
Investment metrics
- 1% rule
- 1.04% ✓
- Cap rate
- 8.50%
- Cash-on-cash
- 7.89%
- DSCR
- 1.35
- GRM
- 8.0
CMA / ARV
- ARV (median comp)
- $154,260
- List price
- $139,000
- Delta
- -9.89%
- Verdict
- FAIR
- Comps
- 20 within 1.0 mi
Show comp detail 10 sales within ~0.75 mi
| Address | Dist | Beds/Ba | Sqft | Sold | Price | $/sf | Match |
|---|---|---|---|---|---|---|---|
| 7633 Stonewood St | 0.18mi | 3/2.0 | 1,267 (+4%) | 2mo | $125,000 | $99 | 83 |
| 7500 Avon Park Blvd | 0.27mi | 3/2.0 | 1,238 (+2%) | 15mo | $80,000 | $65 | 72 |
| 7663 Stonewood St | 0.19mi | 3/2.0 | 1,375 (+13%) | 7mo | $90,000 | $65 | 64 |
| 7631 Avon Park Blvd | 0.23mi | 2/2.0 (-1) | 1,041 (-14%) | 2mo | $85,000 | $82 | 59 |
| 7562 Forum Blvd | 0.38mi | 4/2.0 (+1) | 1,380 (+13%) | 1mo | $98,000 | $71 | 55 |
| 14737 Emory Rd | 0.48mi | 3/2.0 | 1,344 (+10%) | 10mo | $145,000 | $108 | 52 |
| 7575 Shorewood Blvd | 0.30mi | 3/1.0 | 1,080 (-11%) | 14mo | $59,900 | $55 | 52 |
| 8016 W Little Woods Dr | 0.62mi | 3/2.0 | 1,250 (+3%) | 20mo | $70,000 | $56 | 50 |
| 7009 Pinebrook Dr | 0.43mi | 3/2.0 | 1,400 (+15%) | 11mo | $169,900 | $121 | 46 |
| 14516 Tilbury Rd | 0.43mi | 4/1.5 (+1) | 1,316 (+8%) | 23mo | $115,000 | $87 | 40 |
Match score weights: distance 35% · size 25% · config 20% · recency 20%. Top-matched comps best support the ARV.
Projected returns pro-forma
-3.0% appreciation · 3.0% rent growth · sell at horizon
- IRR
- -7.3%
- Equity multiple
- 0.73×
- Total profit
- $-10,448
- Equity at exit
- $20,725
- IRR
- 2.3%
- Equity multiple
- 1.17×
- Total profit
- $6,492
- Equity at exit
- $12,018
Cash invested: $38,920 (down + closing). Projections, not guarantees.
Landlord ↔ Tenant lean methodology
- Overall (STATE)
- 90 Strongly Landlord-Friendly
- State Louisiana
- 90 Strongly Landlord-Friendly · R+12
- County
- — inherits STATE
- City
- — inherits STATE
ZIP-level market 70128
- Home prices YoY
- -5.9%
- Active inventory
- 105
- Price-to-rent
- 8.0×
Monthly cashflow live
- Estimated rent
- $1,441 high interval (Pro) →
- Mortgage (P&I)
- −$729
- Tax from tax record
- −$96 /mo · $1,152/yr
- Insurance
- −$58
- Flood insurance flood zone
- −$66 /mo · $798/yr
- HOA
- −$0
- Vacancy / Maint / Mgmt
- −$303
- Net cashflow
- $189
Break-even live
UW: 25.0% down · 7.5% · 30yr · 1.5% tax · 5.0% vac · 8.0% maint · 8.0% mgmt
Financing live
Cash to close
- Down payment
- $34,750
- Closing costs
- $4,170
- Reserves months
- —
- Total cash needed
- —
Loan-product check · same deal, 3 products live
Conventional
25% down · 7.5% · 30yr
- Down + closing
- —
- Monthly P&I
- —
- Monthly cashflow
- —
- DSCR
- —
- Eligible?
- —
Personal DTI + credit; lowest rate.
DSCR
20% down · 8.5% · 30yr
- Down + closing
- —
- Monthly P&I
- —
- Monthly cashflow
- —
- DSCR
- —
- Eligible?
- —
No personal income docs; deal must DSCR.
Hard money
10% down · 12.0% · 12mo
- Down + closing
- —
- Monthly P&I
- —
- Monthly cashflow
- —
- DSCR
- —
- Eligible?
- —
Short-term bridge; refi at stabilization.
Rent comps 15 comps
| Address | Beds | Baths | Sqft | Rent | $/sqft | DOM | Units | Dist |
|---|---|---|---|---|---|---|---|---|
| 14031 Linden St New Orleans, LA | 3.0 | 2.0 | 1200 | $1,400 | $1.17 | 23d | 1 | 0.16mi |
| 7501 Briarwood Dr New Orleans, LA | 3.0 | 2.0 | 1500 | $1,850 | $1.23 | 23d | 1 | 0.30mi |
| 14509 Duane Rd New Orleans, LA | 2.0 | 1.0 | 1150 | $1,518 | $1.32 | 23d | 1 | 0.43mi |
| 14530 Duane Rd New Orleans, LA | 3.0 | 1.0 | 1150 | $1,450 | $1.26 | 3d | 1 | 0.47mi |
| 14530 Duane Rd New Orleans, LA | 3.0 | 1.0 | 1150 | $1,450 | $1.26 | 3d | 1 | 0.47mi |
| 14724 Emory Rd New Orleans, LA | 3.0 | 2.0 | 1400 | $1,500 | $1.07 | 23d | 1 | 0.47mi |
| 7843 Sail St New Orleans, LA | 3.0 | 1.5 | 1500 | $1,200 | $0.80 | 23d | 1 | 0.52mi |
| 7849 Sail St New Orleans, LA | 3.0 | 2.0 | 1395 | $1,200 | $0.86 | 23d | 1 | 0.52mi |
| 7851 Sail St New Orleans, LA | 3.0 | 2.0 | 1395 | $1,200 | $0.86 | 23d | 1 | 0.52mi |
| 14900 Curran Rd New Orleans, LA | 3.0 | 2.0 | 1221 | $1,250 | $1.02 | 23d | 1 | 0.56mi |
| 7808 Sun St New Orleans, LA | 4.0 | 1.5 | 1500 | $1,950 | $1.30 | 23d | 1 | 0.57mi |
| 7825 Star St New Orleans, LA | 2.0 | 1.0 | 982 | $1,250 | $1.27 | 23d | 1 | 0.65mi |
| 12345 I 10 Service Rd New Orleans, LA | 1.0–2.0 | 1.0–2.0 | 746 | $1,125 | $1.51 | 2d | 200 | 1.03mi |
| 11967 Curran Rd New Orleans, LA | 3.0 | 2.0 | 1100 | $1,750 | $1.59 | 3d | 1 | 1.25mi |
| 12151 I 10 Service Rd New Orleans, LA | 1.0–2.0 | 1.0 | 770 | $1,095 | $1.42 | 2d | 21 | 1.27mi |
Listing history 27 events
-
2026-06-18days on market $139,000 Active 111 DOM
-
2026-06-17days on market $139,000 Active 110 DOM
-
2026-06-16days on market $139,000 Active 109 DOM
-
2026-06-15days on market $139,000 Active 108 DOM
-
2026-06-13days on market $139,000 Active 106 DOM
-
2026-06-10days on market $139,000 Active 103 DOM
-
2026-06-09days on market $139,000 Active 102 DOM
-
2026-06-08days on market $139,000 Active 101 DOM
-
2026-06-07days on market $139,000 Active 100 DOM
-
2026-06-05days on market $139,000 Active 97 DOM
-
2026-06-03days on market $139,000 Active 96 DOM
-
2026-06-02days on market $139,000 Active 95 DOM
-
2026-06-01days on market $139,000 Active 94 DOM
-
2026-05-31days on market $139,000 Active 93 DOM
-
2026-02-27$139,000 Active 490-char remark
Show marketing remark (490 chars)
Beautiful 3-bedroom, 2-bath single-family home featuring central A/C and desirable interior upgrades. The living room offers vaulted ceilings for an open feel and is wired for surround sound, as is the spacious primary bedroom. Kitchen includes granite countertops and ample cabinet storage. The primary suite features a walk-in closet for added convenience. It includes a large, fenced backyard great for outdoor enjoyment. Property is well-suited as a starter home or investment property.
-
2014-11-26soldstatus $69,000
-
2014-11-25soldstatus $69,000
-
2014-09-04$79,500
-
2014-09-04$79,500
-
2013-03-26soldstatus $35,500
-
2012-10-19$41,000
-
2012-10-19$41,000
-
2005-04-08soldstatus $99,000
-
2004-11-23$102,000
-
2004-11-23$102,000
-
1987-07-02soldstatus $62,700
ⓘ Source: listings_history table (triggers on properties + properties_extension) + one-shot
backfill from property_details.listing_events for pre-trigger history.
Tax reassessment forecast LA · Resets to sale price
- Current annual tax
- $1,152 · $96/mo
- Projected year-2 tax
- $1,152 · $96/mo
- Expected delta
- $0/yr ($0/mo · 0.0%)
ⓘ Screening estimate from a state-policy table — verify with the county assessor before closing.
Climate risk First Street
- Flood 8/10 Severe FEMA zone X (shaded) · 60% chance over 30 yrs
- Wildfire 3/10 Moderate
- Heat 10/10 Extreme 7 d/yr ≥107°F today · 22 d/yr by 30 yrs out
- Wind 10/10 Extreme 99% chance of damaging wind over 30 yrs
- Air quality 3/10 Moderate 2 unhealthy d/yr today · 3 by 30 yrs out
Nearby sold comps map
Loading sold comps map…
Walkable amenities ~0.75 mi
Loading nearby amenities…
Taxation est. · year 1
- Rental income
- $17,296
- − Mortgage interest
- −$7,786
- − Property taxes
- −$1,152
- − Insurance
- −$1,492
- − Repairs & maintenance
- −$1,384
- − Management
- −$1,384
- − Depreciation
- −$4,044
- Taxable income
- $55
- Est. tax owed @ 24.0%
- −$13
- After-tax cash flow
- $2,259/yr
For passive investors: Depreciation is non-cash, so a rental often shows a tax loss while cash-flowing — sheltering income. Rental losses are passive: they offset passive income freely, and up to $25,000/yr can offset ordinary (W-2) income if you actively participate and your MAGI is under $100k (phasing out to $0 by $150k); unused losses carry forward. On sale, claimed depreciation is recaptured at up to 25%, and gains may owe capital-gains tax (a 1031 exchange can defer both). Figures are a year-1 estimate at your 24.0% rate — not tax advice; consult a CPA.
Schools (NCES district)
- District
- Orleans Parish
- NCES district ID
- 2201170
- Math proficiency
- 11% ▼ -52.00%
- Reading proficiency
- 27% ▼ -46.00%
- Median HH income
- $37,011
- Composite
- 15.78/100
- National rank
- #9271
- State rank
- #69 of 98 in LA
Livability — New Orleans
- Score
- 81/100
- State rank
- #3
- US rank
- #1383
Category grades
Schools grade is shown separately in the Schools card above.
Census & demographics
- Census place
- New Orleans, LA
- City population
- 338,817
- Population (ZIP)
- 22,973
Population outlook (Orleans County) Hauer SSP2
- Today (2025)
- 513,025 people
- By 2030
- 575,781 · +12.2%
- By 2040
- 700,174 · +36.5%
- By 2050
- 826,541 · +61.1%
- By 2075
- 1,123,374 · +119.0%
- By 2100
- 1,355,609 · +164.2%
Race, ethnicity, and origin ACS 2023
- Neighborhood character
- Predominantly Black (86%)
- Race & ethnicity
- Black 86% Asian 5% White 4% Two or more races 3%
- Foreign-born
- 4% · Vietnam, Canada
- Languages at home
- 95% English-only · Vietnamese 4% Spanish 1%
Political lean MEDSL · Orleans
- 2024 margin
- Solid D (+67.0) · D 82.2% · R 15.2% · Other 2.7%
- 2008→2024 swing
- +6.7pp toward D · 2008: 60.3pp · 2024: 67.0pp
- All cycles
- 2024: D+67.0 2020: D+68.2 2016: D+66.2 2012: D+62.5 2008: D+60.3
Not yet ingested
- Civics
- —
Market trends
- HPI YoY
- ▼ -15.51%
- Current HPI
- 247.7131
- Rent YoY
- —
- Metro
- —
- State GDP YoY
- ▲ 3.29%
- F500 in state
- 10
Industry mix (Fortune 500 HQ in LA)
| Industry | F500 HQs | Revenue |
|---|---|---|
| Telecommunications | 2 | $23B |
|
||
| Utilities | 1 | $12B |
|
||
| Wholesale / Distribution | 1 | $5B |
|
||
| Advertising | 1 | $2B |
|
||
Price history
+121.7% since first listed13 events — show timeline
- 2026-02-27 Listed $139,000 AcadianaMLS
- 2026-02-27 Listed $139,000 GSREIN
- 2014-11-26 Sold (Public Records) $69,000 Public Records
- 2014-11-25 Sold (MLS) $69,000 GSREIN
- 2014-09-04 Listed $79,500 AcadianaMLS
- 2014-09-04 Listed $79,500 GSREIN
- 2013-03-26 Sold (MLS) $35,500 GSREIN
- 2012-10-19 Listed $41,000 AcadianaMLS
- 2012-10-19 Listed $41,000 GSREIN
- 2005-04-08 Sold (MLS) $99,000 GSREIN
- 2004-11-23 Listed $102,000 GSREIN
- 2004-11-23 Listed $102,000 AcadianaMLS
- 1987-07-02 Sold (Public Records) $62,700 Public Records
Property tax history
+1.2%/yrLatest (2026): $1,152 · +1.1% YoY. Source: county tax records.
Cash-flow waterfall
monthlySold comps — $/sqft
last 12 mo · ≤1 miLoading sold comps…