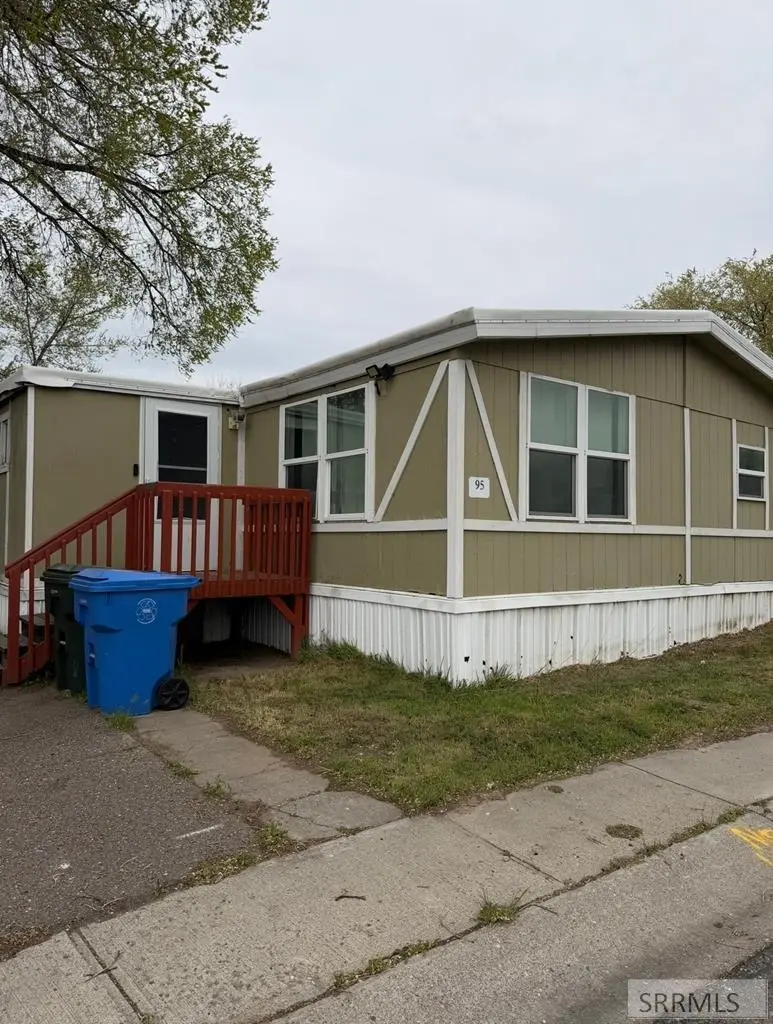
845 W Barton Rd #95 · Pocatello, ID
Flood risk 1/10 · Minimal
- FEMA flood zone
- X (unshaded)
- Chance of flooding over 30 yrs
- 0.0%
- Est. flood insurance / yr
- $473 – $860
Fire risk 9/10 · Severe
- Est. fire insurance / yr
- $584 – $1,086
Heat risk 4/10 · Minor
- Hot days now (above 93°F)
- 7 days/yr
- Hot days in 30 yrs
- 18 days/yr
Wind risk 1/10 · Minimal
- Chance of severe wind over 30 yrs
- —
Air-quality risk 4/10 · Minor
- Unhealthy air days now
- 5 days/yr
- Unhealthy air days in 30 yrs
- 6 days/yr
Risk factors via First Street. Map © Google.
Why this score? — see what drove the B grade
The composite is a weighted blend of 9 inputs, each scored 0–100. Each bar is that input's sub-score; the figure is the points it added to the 100-point composite (weight × sub-score).
- Cash flow +30.0/30.0
- 1% rule +10.0/10.0
- DSCR +10.0/10.0
- ARV discount +7.5/15.0
- Schools +4.3/10.0
- Livability +4.2/5.0
- Rent growth +3.5/5.0
- Condition / age +2.2/5.0
- Appreciation +0.0/10.0
$53,000
🖨 Deal sheet (PDF) 📄 Offer letter ✓ Due diligence
Listing remarks
Welcome home to this 3-bedroom, 2-bath manufactured home located in a clean, well-maintained community. Inside, you'll find a spacious living room that offers plenty of room to relax or entertain, along with a generously sized kitchen featuring ample cabinet and counter space and perfect for everyday living and gatherings. The home includes convenient on site laundry, making daily routines simple and efficient. The thoughtful layout provides comfortable separation between bedrooms, with a primary suite that includes its own private bathroom. Situated in an established park that is cared for and welcoming, this property offers both comfort and convenience. You'll love the easy access to near
Key facts
- On site laundry
- Private bathroom
- Spacious living room
Tags
Property features AI
Finance
- Other: Located in subdivision: COWBOY TRAILER PARK-BAN
Exterior
- Utilities: Public water; Public sewer
- Home design: Single-family residence; One story
- Construction: Wood siding construction
- Exterior features: Rubber roof
Interior
- Kitchen: Refrigerator
- Flooring: Other/unspecified flooring
- Bathrooms: 2 full bathrooms
- Heating & cooling: Electric heating
- Interior features: Refrigerator; Other/unspecified flooring; Crawl space basement
Neighborhood map
What this means for you Summary
Snapshot
- This is a 3-bed/2.0-bath single-family listed at $53k. Condition is rated fair.
Deal economics
- At list price, monthly cash flow is $564 ($7k/yr) — positive.
- The deal already cash-flows at list — no discount required.
- Meets the 1% rule at list price ($1k rent vs $53k).
- Recommended offer: $51k (3.0% below list) — sets the bar for market timing.
Location & tenants
- Location reads 84/100 on livability (#7 in ID, #758 nationally) — a professional / high-income tenant draw. Strengths: commute A+, cost of living A+, housing A+; Watch: amenities C-, employment D.
- Pocatello District (urban): math 45% / reading 58% proficiency, ranked #26 of 92 in ID (top 28%) — acceptable for families but not a draw, mixed tenant base, ~2y average lease.
- Zoned schools: Washington Elementary School (math 57% / reading 57%, grade C+, #88 of 357 statewide, top 28%, 215 students, 58% FRL) — zoned schools average 58% FRL vs 43% district-wide (15 pts higher); higher-poverty schools than district average — tighter screening recommended.
- Market conditions: Rents rising fast (+4.0%/yr); 186 active listings in the ZIP; 325 units permitted in Bannock County in 2024 (6 in 5+ unit buildings).
Forward outlook
- Local home prices are declining (-3.0%/yr); year-one equity from $366 of loan paydown is wiped out by about $2k of value loss. Plan a longer hold.
- At projected returns (-3.0% appreciation + 4.0% rent growth), your $15k cash investment doubles in ~3 years — after that, you're playing with house money.
Negotiation context
- It's been on market 52 days — a 3% lower offer ($51k) is reasonable based on typical stale-listing flexibility.
Risks & watch-outs
- Climate carrying-cost: severe wildfire risk — expect insurance premiums to compound above CPI over the hold.
Questions for the listing agent
- It's been on market 52 days. Have you received any prior offers? Is the seller open to a 3% concession, seller financing, or rate buy-down credit?
- Have any recent inspections been done? Can we get a copy of the seller's disclosures and any deferred-maintenance estimates?
- Is there a deadline driving the sale (1031 exchange, divorce, estate, relocation)? That informs how much negotiation room exists.
- What's the average days-on-market for RENTAL listings here right now (not sales)? A rising rental-DOM trend means longer vacancies and softer asking-rent achievability than the comps imply.
- What's the recent tenant-quality profile in this submarket — average credit score on applications, eviction rate, late-payment / NSF rate, and stable-employment percentage? A property-management company in the area should have these aggregated.
- How much new for-sale + rental construction is in the pipeline within 1–3 miles? Heavy new supply typically softens prices + rents 12–24 months out; constrained supply supports both.
Investment metrics
- 1% rule
- 2.22% ✓
- Cap rate
- 19.06%
- Cash-on-cash
- 45.58%
- DSCR
- 3.03
- GRM
- 3.8
CMA / ARV
No comps found within radius.
Projected returns pro-forma
-3.0% appreciation · 4.01% rent growth · sell at horizon
- IRR
- 43.9%
- Equity multiple
- 2.92×
- Total profit
- $28,541
- Equity at exit
- $7,902
- IRR
- 50.3%
- Equity multiple
- 6.14×
- Total profit
- $76,217
- Equity at exit
- $4,582
Cash invested: $14,840 (down + closing). Projections, not guarantees.
Landlord ↔ Tenant lean methodology
- Overall (STATE)
- 91 Strongly Landlord-Friendly
- State Idaho
- 91 Strongly Landlord-Friendly · R+18
- County
- — inherits STATE
- City
- — inherits STATE
ZIP-level market 83204
- Rents YoY
- 4.0%
- Active inventory
- 186
- Price-to-rent
- 3.8×
Monthly cashflow live
- Estimated rent
- $1,177 medium interval (Pro) →
- Mortgage (P&I)
- −$278
- Tax est. 1.5%
- −$66 /mo · $795/yr
- Insurance
- −$22
- HOA
- −$0
- Vacancy / Maint / Mgmt
- −$247
- Net cashflow
- $564
Break-even live
Sensitivity live
| Price | -10% $600 | -5% $582 | +0% $564 | +5% $545 | +10% $527 |
|---|---|---|---|---|---|
| Rent | -10% $471 | -5% $517 | +0% $564 | +5% $610 | +10% $657 |
| Rate | -1.0pp $590 | -0.5pp $577 | base $564 | +0.5pp $550 | +1.0pp $536 |
UW: 25.0% down · 7.5% · 30yr · 1.5% tax · 5.0% vac · 8.0% maint · 8.0% mgmt
Financing live
Cash to close
- Down payment
- $13,250
- Closing costs
- $1,590
- Reserves months
- —
- Total cash needed
- —
Loan-product check · same deal, 3 products live
Conventional
25% down · 7.5% · 30yr
- Down + closing
- —
- Monthly P&I
- —
- Monthly cashflow
- —
- DSCR
- —
- Eligible?
- —
Personal DTI + credit; lowest rate.
DSCR
20% down · 8.5% · 30yr
- Down + closing
- —
- Monthly P&I
- —
- Monthly cashflow
- —
- DSCR
- —
- Eligible?
- —
No personal income docs; deal must DSCR.
Hard money
10% down · 12.0% · 12mo
- Down + closing
- —
- Monthly P&I
- —
- Monthly cashflow
- —
- DSCR
- —
- Eligible?
- —
Short-term bridge; refi at stabilization.
Listing history 11 events
-
2026-06-13statusdays on market $53,000 Pending 52 DOM
-
2026-06-10days on market $53,000 Active 50 DOM
-
2026-06-09days on market $53,000 Active 49 DOM
-
2026-06-08days on market $53,000 Active 48 DOM
-
2026-06-07pricedays on market $53,000 Active 47 DOM
-
2026-06-03days on market $63,000 Active 43 DOM
-
2026-06-02days on market $63,000 Active 42 DOM
-
2026-06-01days on market $63,000 Active 41 DOM
-
2026-05-31days on market $63,000 Active 40 DOM
-
2026-05-30days on market $63,000 Active 39 DOM
-
2026-04-21$63,000 Active
ⓘ Source: listings_history table (triggers on properties + properties_extension) + one-shot
backfill from property_details.listing_events for pre-trigger history.
Climate risk First Street
- Flood 1/10 Low FEMA zone X (unshaded) · 0% chance over 30 yrs
- Wildfire 9/10 Extreme
- Heat 4/10 Moderate 7 d/yr ≥93°F today · 18 d/yr by 30 yrs out
- Wind 1/10 Low
- Air quality 4/10 Moderate 5 unhealthy d/yr today · 6 by 30 yrs out
Nearby sold comps map
Loading sold comps map…
Walkable amenities ~0.75 mi
Loading nearby amenities…
Taxation est. · year 1
- Rental income
- $14,126
- − Mortgage interest
- −$2,969
- − Property taxes
- −$795
- − Insurance
- −$265
- − Repairs & maintenance
- −$1,130
- − Management
- −$1,130
- − Depreciation
- −$1,542
- Taxable income
- $6,295
- Est. tax owed @ 24.0%
- −$1,511
- After-tax cash flow
- $5,254/yr
For passive investors: Depreciation is non-cash, so a rental often shows a tax loss while cash-flowing — sheltering income. Rental losses are passive: they offset passive income freely, and up to $25,000/yr can offset ordinary (W-2) income if you actively participate and your MAGI is under $100k (phasing out to $0 by $150k); unused losses carry forward. On sale, claimed depreciation is recaptured at up to 25%, and gains may owe capital-gains tax (a 1031 exchange can defer both). Figures are a year-1 estimate at your 24.0% rate — not tax advice; consult a CPA.
Condition & rehab AI · 10 photos
This manufactured home requires moderate renovations, including exterior siding and landscaping, to improve its condition and value.
Repairs flagged
- Major exterior siding — Significant wear and tear
- Major landscaping — Overgrown lawn and unkempt appearance
Value-add opportunities
- Resale Paint interior walls — Fresh paint can improve curb appeal and interior aesthetics
- Resale Replace carpeted flooring — New flooring can enhance the home's overall appearance and value
- Both Landscaping and yard maintenance — A well-maintained yard can improve both resale and rental value
Renovation cost estimate screening
| Repair item | Severity | Est. cost |
|---|---|---|
| exterior siding · Significant wear and tear | Major | $15,000–50,000 |
| landscaping · Overgrown lawn and unkempt appearance | Major | $15,000–50,000 |
| Total estimated repair cost · 2 items | $30,000–100,000 |
Value-add ROI direction
- Resale Paint interior walls — Fresh paint can improve curb appeal and interior aesthetics ↑
- Resale Replace carpeted flooring — New flooring can enhance the home's overall appearance and value ↑
- Both Landscaping and yard maintenance — A well-maintained yard can improve both resale and rental value ↑
ⓘ Cost ranges are severity-bucket heuristics (US national rule-of-thumb). Get contractor quotes + a written scope before underwriting a rehab budget.
Schools (NCES district)
- District
- Pocatello District
- NCES district ID
- 1602640
- Math proficiency
- 45% ▼ -6.00%
- Reading proficiency
- 58% ▼ -1.00%
- Median HH income
- $44,478
- Composite
- 43.46/100
- National rank
- #3003
- State rank
- #26 of 92 in ID
Livability — Pocatello
- Score
- 84/100
- State rank
- #7
- US rank
- #758
Category grades
Schools grade is shown separately in the Schools card above.
Census & demographics
- Census place
- Pocatello, ID
- County
- Bannock County · 82,995 people
- City population
- 58,482
- Metro
- Pocatello, ID
- Population (ZIP)
- 18,580
- Household income
- $57,146
- Rent vs Own
- Severe rent burden
- 435.0
Population outlook (Bannock County) Hauer SSP2
- Today (2025)
- 86,173 people
- By 2030
- 86,575 · +0.5%
- By 2040
- 86,235 · +0.1%
- By 2050
- 86,090 · -0.1%
- By 2075
- 85,032 · -1.3%
- By 2100
- 85,103 · -1.2%
Race, ethnicity, and origin ACS 2023
- Neighborhood character
- Predominantly White (84%)
- Race & ethnicity
- White 84% Two or more races 7% Hispanic / Latino 7% Native American 3% Black 1%
- Hispanic origin (detail)
- Mexican 5%
- Common ancestry
- Portuguese 4% Slovak 3% Italian 2%
- Foreign-born
- 2% · Canada
- Languages at home
- 95% English-only · Spanish 3% Other Indo-European 1% German/W. Germanic 1%
Political lean MEDSL · Bannock
- 2024 margin
- Strong R (+25.1) · D 35.8% · R 60.9% · Other 3.3%
- 2008→2024 swing
- -12.1pp toward R · 2008: -13.0pp · 2024: -25.1pp
- All cycles
- 2024: R+25.1 2020: R+21.9 2016: R+20.5 2012: R+22.1 2008: R+13.0
Not yet ingested
- Civics
- —
Market trends
- HPI YoY
- ▼ -151.01%
- Current HPI
- 232.7208
- Rent YoY
- ▲ 4.01%
- Metro
- Pocatello, ID
- State GDP YoY
- ▲ 4.51%
- F500 in state
- 6
Industry mix (Fortune 500 HQ in ID)
| Industry | F500 HQs | Revenue |
|---|---|---|
| Retail | 1 | $79B |
|
||
| Technology | 1 | $25B |
|
||
| Food / Agriculture | 1 | $6B |
|
||
Price history
1 event — show timeline
- 2026-04-21 Listed $63,000 SRMLS
Cash-flow waterfall
monthlySold comps — $/sqft
last 12 mo · ≤1 miLoading sold comps…