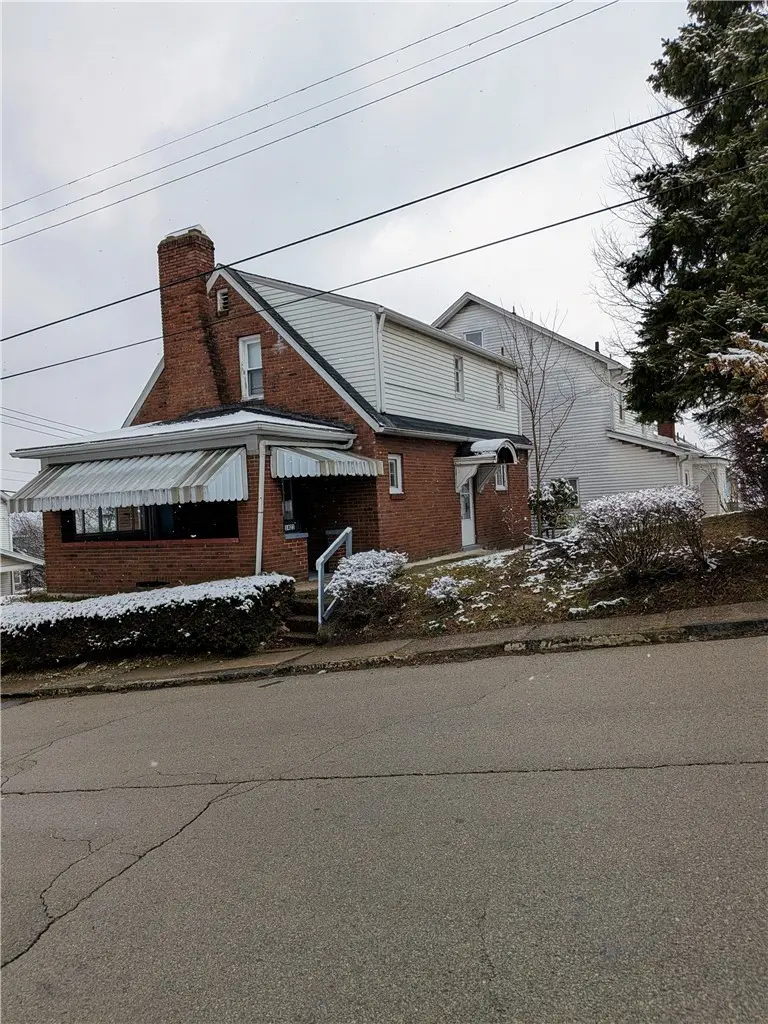
1421 Meadow St · McKeesport, PA
Flood risk 1/10 · Minimal
- FEMA flood zone
- X (unshaded)
- Chance of flooding over 30 yrs
- 0.0%
- Est. flood insurance / yr
- $473 – $860
Fire risk 1/10 · Minimal
- Est. fire insurance / yr
- $511 – $949
Heat risk 4/10 · Minor
- Hot days now (above 97°F)
- 7 days/yr
- Hot days in 30 yrs
- 18 days/yr
Wind risk 2/10 · Minimal
- Chance of severe wind over 30 yrs
- 0.0%
Air-quality risk 5/10 · Moderate
- Unhealthy air days now
- 9 days/yr
- Unhealthy air days in 30 yrs
- 11 days/yr
Risk factors via First Street. Map © Google.
Why this score? — see what drove the C+ grade
The composite is a weighted blend of 9 inputs, each scored 0–100. Each bar is that input's sub-score; the figure is the points it added to the 100-point composite (weight × sub-score).
- Cash flow +26.4/30.0
- DSCR +9.0/10.0
- ARV discount +7.5/15.0
- 1% rule +7.2/10.0
- Livability +3.3/5.0
- Rent growth +2.5/5.0
- Condition / age +2.5/5.0
- Schools +1.6/10.0
- Appreciation +0.0/10.0
$84,900
🖨 Deal sheet 📄 Offer letter ✓ Due diligence
Listing remarks MLS
Nice move-in ready, brick cape cod with a small backyard and detached garage! 2 bedrooms, 1 bathroom with decorative fireplace and formal dining room.
Key facts
- Decorative fireplace
- Formal dining room
- Brick cape cod
Tags
Neighborhood map
What this means for you Summary
Snapshot
- This is a 2-bed/1.0-bath single-family listed at $85k.
Deal economics
- At list price, monthly cash flow is $223 ($3k/yr) — positive.
- The deal already cash-flows at list — no discount required.
- Meets the 1% rule at list price ($1k rent vs $85k).
- Recommended offer: $75k (12.0% below list) — sets the bar for market timing.
Location & tenants
- Location reads 66/100 on livability (#1,089 in PA) — a middle-class / working-renter tenant base. Strengths: commute A+, cost of living A+, housing A+; Watch: schools D+, health & safety D, crime F.
- Mckeesport Area SD (suburban): math 11% / reading 28% proficiency, ranked #499 of 539 in PA (top 93%) — low school quality limits family demand, transient renter base, plan for 1-2y turnover; 66% free/reduced lunch — lower-income household profile, screen leases tightly.
- Market conditions: 113 active listings in the ZIP; 12 comparable units currently listed for rent nearby; rentals lingering (median 44d on market — plan ~5-8 weeks vacancy on turnover, expect pricing pressure); 50% of comp listings sitting > 30 days — soft ceiling on asking rent; lower-income renter base — watch delinquency; 2,996 units permitted in Allegheny County in 2024 (1,588 in 5+ unit buildings).
- This rent runs 35% of the median local income ($35k/yr) — at the standard rent-burdened threshold; future hikes will face affordability resistance.
Forward outlook
- Local home prices are declining (-3.0%/yr); year-one equity from $587 of loan paydown is wiped out by about $3k of value loss. Plan a longer hold.
- At projected returns (-3.0% appreciation + 3.0% rent growth), your $24k cash investment doubles in ~10 years — after that, you're playing with house money.
Negotiation context
- It's been on market 328 days — a 12% lower offer ($75k) is reasonable based on typical stale-listing flexibility.
- 5 sale attempts since 21y ago; this cycle's ask has dropped $15k (15%) from the opening price — seller is motivated, your offer sets the floor, not the list.
Risks & watch-outs
- Watch-outs: built in 1939 — expect roof / HVAC / electrical / plumbing capex.
Questions for the listing agent
- It's been on market 328 days. Have you received any prior offers? Is the seller open to a 12% concession, seller financing, or rate buy-down credit?
- Built in 1939 — when were the roof, HVAC, electrical panel, plumbing, and water heater last replaced?
- Why hasn't it sold? Are there any deal-killer items the seller is aware of (foundation, flood, title, zoning, code violations)?
- Is there a deadline driving the sale (1031 exchange, divorce, estate, relocation)? That informs how much negotiation room exists.
- Schools are D-rated, which usually means shorter tenancies and higher turnover. Who's the typical renter profile here, and what's been the actual vacancy rate?
- Crime grade is F in this area — have there been break-ins, vandalism, or insurance claims at this property in the last 3 years? What carrier currently insures it and at what premium?
- What's the average days-on-market for RENTAL listings here right now (not sales)? A rising rental-DOM trend means longer vacancies and softer asking-rent achievability than the comps imply.
- What's the recent tenant-quality profile in this submarket — average credit score on applications, eviction rate, late-payment / NSF rate, and stable-employment percentage? A property-management company in the area should have these aggregated.
- How much new for-sale + rental construction is in the pipeline within 1–3 miles? Heavy new supply typically softens prices + rents 12–24 months out; constrained supply supports both.
Investment metrics
- 1% rule
- 1.22% ✓
- Cap rate
- 9.44%
- Cash-on-cash
- 11.24%
- DSCR
- 1.50
- GRM
- 6.8
CMA / ARV
- ARV (median comp)
- $50,737
- List price
- $84,900
- Delta
- 67.33%
- Verdict
- OVERPRICED
- Comps
- 20 within 1.0 mi
Show comp detail 12 sales within ~0.75 mi
| Address | Dist | Beds/Ba | Sqft | Sold | Price | $/sf | Match |
|---|---|---|---|---|---|---|---|
| 2805 Riverview St | 0.38mi | 2/1.0 | 864 (-6%) | 0mo | $65,000 | $75 | 71 |
| 1211 Meadow St | 0.10mi | 3/1.0 (+1) | 992 (+7%) | 8mo | $56,915 | $57 | 71 |
| 2720 Garbett St | 0.26mi | 3/2.0 (+1) | 888 (-4%) | 2mo | $30,000 | $34 | 71 |
| 2120 Dalton St | 0.54mi | 2/1.0 | 928 (+0%) | 12mo | $64,900 | $70 | 64 |
| 2101 Barnsdale Ave | 0.60mi | 2/2.0 | 928 (+0%) | 6mo | $45,500 | $49 | 62 |
| 2619 Harrison St | 0.68mi | 2/1.0 | 955 (+3%) | 8mo | $69,900 | $73 | 56 |
| 2620 Kansas St | 0.63mi | 2/1.0 | 972 (+5%) | 8mo | $51,550 | $53 | 56 |
| 2714 Kansas St | 0.69mi | 2/2.0 | 912 (-1%) | 11mo | $124,900 | $137 | 53 |
| 2004 Orofino St | 0.41mi | 2/2.0 | 825 (-11%) | 8mo | $130,500 | $158 | 52 |
| 2116 Barnsdale Ave | 0.60mi | 2/1.5 | 1,008 (+9%) | 4mo | $43,500 | $43 | 51 |
| 2407 Harrison St | 0.56mi | 2/1.0 | 832 (-10%) | 12mo | $58,000 | $70 | 47 |
| 444 27th St | 0.58mi | 3/1.5 (+1) | 812 (-12%) | 9mo | $132,000 | $163 | 38 |
Match score weights: distance 35% · size 25% · config 20% · recency 20%. Top-matched comps best support the ARV.
Projected returns pro-forma
-3.0% appreciation · 3.0% rent growth · sell at horizon
- IRR
- 0.5%
- Equity multiple
- 1.02×
- Total profit
- $451
- Equity at exit
- $12,659
- IRR
- 10.2%
- Equity multiple
- 1.79×
- Total profit
- $18,748
- Equity at exit
- $7,341
Cash invested: $23,772 (down + closing). Projections, not guarantees.
Landlord ↔ Tenant lean methodology
- Overall (STATE)
- 62 Landlord-Friendly
- State Pennsylvania
- 62 Landlord-Friendly · EVEN
- County
- — inherits STATE
- City
- — inherits STATE
ZIP-level market 15132
- Home prices YoY
- -32.9%
- Active inventory
- 113
- Price-to-rent
- 6.8×
Monthly cashflow live
- Estimated rent
- $1,036 high interval (Pro) →
- Mortgage (P&I)
- −$445
- Tax from tax record
- −$115 /mo · $1,379/yr
- Insurance
- −$35
- HOA
- −$0
- Vacancy / Maint / Mgmt
- −$218
- Net cashflow
- $223
Break-even live
UW: 25.0% down · 7.5% · 30yr · 1.5% tax · 5.0% vac · 8.0% maint · 8.0% mgmt
Financing live
Cash to close
- Down payment
- $21,225
- Closing costs
- $2,547
- Reserves months
- —
- Total cash needed
- —
Loan-product check · same deal, 3 products live
Conventional
25% down · 7.5% · 30yr
- Down + closing
- —
- Monthly P&I
- —
- Monthly cashflow
- —
- DSCR
- —
- Eligible?
- —
Personal DTI + credit; lowest rate.
DSCR
20% down · 8.5% · 30yr
- Down + closing
- —
- Monthly P&I
- —
- Monthly cashflow
- —
- DSCR
- —
- Eligible?
- —
No personal income docs; deal must DSCR.
Hard money
10% down · 12.0% · 12mo
- Down + closing
- —
- Monthly P&I
- —
- Monthly cashflow
- —
- DSCR
- —
- Eligible?
- —
Short-term bridge; refi at stabilization.
Rent comps 12 comps
| Address | Beds | Baths | Sqft | Rent | $/sqft | DOM | Units | Dist |
|---|---|---|---|---|---|---|---|---|
| 1114-1116 Ohio St Unit 2R McKeesport, PA | 2.0 | 1.0 | 878 | $850 | $0.97 | 16d | 1 | 0.22mi |
| 3506 Mayfair St Unit B McKeesport, PA | 2.0 | 1.0 | 948 | $1,200 | $1.27 | 44d | 1 | 0.33mi |
| 311-313 24th St McKeesport, PA | 2.0 | 1.0 | 950 | $900 | $0.95 | 44d | 1 | 0.74mi |
| 1108 Prescott St White Oak, PA | 2.0 | 1.0 | 945 | $1,200 | $1.27 | 12d | 1 | 0.77mi |
| 2918 Walnut St Apt 3 McKeesport, PA | 2.0 | 1.0 | 800 | $850 | $1.06 | 44d | 1 | 0.83mi |
| 1205 5th Ave McKeesport, PA | 1.0 | 1.0 | 593 | $1,090 | $1.84 | 44d | 1 | 0.92mi |
| 604 Shaw Ave McKeesport, PA | 2.0 | 1.0–1.5 | 800 | $900 | $1.12 | 12d | 3 | 1.11mi |
| 604 Shaw Ave Unit 102 McKeesport, PA | 1.0 | 1.0 | 750 | $750 | $1.00 | 44d | 1 | 1.11mi |
| 604 Shaw Ave Unit 101 McKeesport, PA | 2.0 | 1.5 | 1050 | $900 | $0.86 | 14d | 1 | 1.11mi |
| 1735 Ohio Ave Unit 6 White Oak, PA | 3.0 | 1.0 | 1034 | $1,200 | $1.16 | 44d | 1 | 1.42mi |
| 1133 Maryland Ave Unit 3 Duquesne, PA | 1.0 | 1.0 | 750 | $1,150 | $1.53 | 14d | 1 | 1.46mi |
| 152 Royal Oak Dr White Oak, PA | 1.0–2.0 | 1.0–2.0 | 930 | $1,445 | $1.55 | 1d | 9 | 1.48mi |
Listing history 26 events
-
2026-06-18days on market $84,900 Active 328 DOM
-
2026-06-17days on market $84,900 Active 327 DOM
-
2026-06-16days on market $84,900 Active 326 DOM
-
2026-06-15days on market $84,900 Active 325 DOM
-
2026-06-13days on market $84,900 Active 323 DOM
-
2026-06-13days on market $84,900 Active 322 DOM
-
2026-06-09days on market $84,900 Active 319 DOM
-
2026-06-08days on market $84,900 Active 318 DOM
-
2026-06-07days on market $84,900 Active 317 DOM
-
2026-06-03days on market $84,900 Active 313 DOM
-
2026-06-02days on market $84,900 Active 312 DOM
-
2026-06-01days on market $84,900 Active 311 DOM
-
2026-05-31days on market $84,900 Active 310 DOM
-
2026-02-24price $84,900 150-char remark
Show marketing remark (150 chars)
Nice move-in ready, brick cape cod with a small backyard and detached garage! 2 bedrooms, 1 bathroom with decorative fireplace and formal dining room.
-
2025-08-12price $85,000 150-char remark
Show marketing remark (150 chars)
Nice move-in ready, brick cape cod with a small backyard and detached garage! 2 bedrooms, 1 bathroom with decorative fireplace and formal dining room.
-
2025-07-25$100,000 Active 150-char remark
Show marketing remark (150 chars)
Nice move-in ready, brick cape cod with a small backyard and detached garage! 2 bedrooms, 1 bathroom with decorative fireplace and formal dining room.
-
2025-07-05historical $1,195
-
2025-06-04$1,195
-
2025-03-22historical $1,195
-
2025-01-01$1,195
-
2025-01-01historical $1,195
-
2025-01-01$1,195
-
2008-11-03soldstatus $157,000
-
2006-04-28soldstatus $27,000 157-char remark
Show marketing remark (157 chars)
GREAT STARTER or Investment. .. NICE Hardwood Floors - Super Corner Lot - Move In Condition - Minor Exterior Work needed. .. TAXES & Lot size APPX -
-
2006-04-19soldstatus $27,000
-
2005-12-02$33,900 157-char remark
Show marketing remark (157 chars)
GREAT STARTER or Investment. .. NICE Hardwood Floors - Super Corner Lot - Move In Condition - Minor Exterior Work needed. .. TAXES & Lot size APPX -
ⓘ Source: listings_history table (triggers on properties + properties_extension) + one-shot
backfill from property_details.listing_events for pre-trigger history.
Tax reassessment forecast PA · Partial reset (capped growth)
- Current annual tax
- $1,379 · $115/mo
- Projected year-2 tax
- $1,379 · $115/mo
- Expected delta
- $0/yr ($0/mo · 0.0%)
ⓘ Screening estimate from a state-policy table — verify with the county assessor before closing.
Climate risk First Street
- Flood 1/10 Low FEMA zone X (unshaded) · 0% chance over 30 yrs
- Wildfire 1/10 Low
- Heat 4/10 Moderate 7 d/yr ≥97°F today · 18 d/yr by 30 yrs out
- Wind 2/10 Low 0% chance of damaging wind over 30 yrs
- Air quality 5/10 Major 9 unhealthy d/yr today · 11 by 30 yrs out
Nearby sold comps map
Loading sold comps map…
Walkable amenities ~0.75 mi
Loading nearby amenities…
Taxation est. · year 1
- Rental income
- $12,430
- − Mortgage interest
- −$4,756
- − Property taxes
- −$1,379
- − Insurance
- −$424
- − Repairs & maintenance
- −$994
- − Management
- −$994
- − Depreciation
- −$2,470
- Taxable income
- $1,412
- Est. tax owed @ 24.0%
- −$339
- After-tax cash flow
- $2,334/yr
For passive investors: Depreciation is non-cash, so a rental often shows a tax loss while cash-flowing — sheltering income. Rental losses are passive: they offset passive income freely, and up to $25,000/yr can offset ordinary (W-2) income if you actively participate and your MAGI is under $100k (phasing out to $0 by $150k); unused losses carry forward. On sale, claimed depreciation is recaptured at up to 25%, and gains may owe capital-gains tax (a 1031 exchange can defer both). Figures are a year-1 estimate at your 24.0% rate — not tax advice; consult a CPA.
Schools (NCES district)
- District
- Mckeesport Area SD
- NCES district ID
- 4214940
- Math proficiency
- 11% ▼ -9.00%
- Reading proficiency
- 28% ▼ -10.00%
- Median HH income
- $33,779
- Composite
- 15.88/100
- National rank
- #9257
- State rank
- #499 of 539 in PA
Livability — McKeesport
- Score
- 66/100
- State rank
- #1089
- US rank
- #12321
Category grades
Schools grade is shown separately in the Schools card above.
Census & demographics
- Census place
- McKeesport, PA
- County
- Allegheny County · 1,022,028 people
- City population
- 25,010
- Metro
- Pittsburgh, PA
- Population (ZIP)
- 18,898
- Household income
- $35,397
- Rent vs Own
- Severe rent burden
- 1239.0
Population outlook (Allegheny County) Hauer SSP2
- Today (2025)
- 1,250,282 people
- By 2030
- 1,256,482 · +0.5%
- By 2040
- 1,256,318 · +0.5%
- By 2050
- 1,244,169 · -0.5%
- By 2075
- 1,197,693 · -4.2%
- By 2100
- 1,093,187 · -12.6%
Race, ethnicity, and origin ACS 2023
- Neighborhood character
- Diverse neighborhood (Simpson 0.62)
- Race & ethnicity
- White 50% Black 35% Two or more races 10% Hispanic / Latino 4% Asian 1%
- Common ancestry
- Romanian 5% Serbian 2% Scotch-Irish 2%
- Foreign-born
- 2% · Canada, China
- Languages at home
- 96% English-only · Spanish 3%
Political lean MEDSL · Allegheny
- 2024 margin
- Strong D (+20.3) · D 59.7% · R 39.4%
- 2008→2024 swing
- +4.8pp toward D · 2008: 15.5pp · 2024: 20.3pp
- All cycles
- 2024: D+20.3 2020: D+20.4 2016: D+16.4 2012: D+14.4 2008: D+15.5
Not yet ingested
- Civics
- —
Market trends
- HPI YoY
- ▼ -71.01%
- Current HPI
- 145.195
- Rent YoY
- —
- Metro
- Pittsburgh, PA
- State GDP YoY
- ▲ 1.68%
- F500 in state
- 34
Industry mix (Fortune 500 HQ in PA)
| Industry | F500 HQs | Revenue |
|---|---|---|
| Healthcare | 2 | $309B |
|
||
| Insurance | 2 | $27B |
|
||
| Telecommunications / Media | 1 | $124B |
|
||
| Industrial Distribution | 1 | $22B |
|
||
| Financial Services | 1 | $20B |
|
||
| Chemicals / Materials | 1 | $18B |
|
||
Price history
+150.4% since first listed13 events — show timeline
- 2026-02-24 Price Changed $84,900 West Penn MLS
- 2025-08-12 Price Changed $85,000 West Penn MLS
- 2025-07-25 Listed $100,000 West Penn MLS
- 2025-07-05 Rental Removed $1,195 APPFOLIO
- 2025-06-04 Listed for Rent $1,195 APPFOLIO
- 2025-03-22 Rental Removed $1,195 APPFOLIO
- 2025-01-01 Listed for Rent $1,195 APPFOLIO
- 2025-01-01 Rental Removed $1,195 SHOWMOJO
- 2025-01-01 Listed for Rent $1,195 SHOWMOJO
- 2008-11-03 Sold (Public Records) $157,000 Public Records
- 2006-04-28 Sold (MLS) $27,000 West Penn MLS
- 2006-04-19 Sold (Public Records) $27,000 Public Records
- 2005-12-02 Listed $33,900 West Penn MLS
Property tax history
+6.2%/yrLatest (2026): $1,379 · +0.0% YoY. Source: county tax records.
Cash-flow waterfall
monthlySold comps — $/sqft
last 12 mo · ≤1 miLoading sold comps…