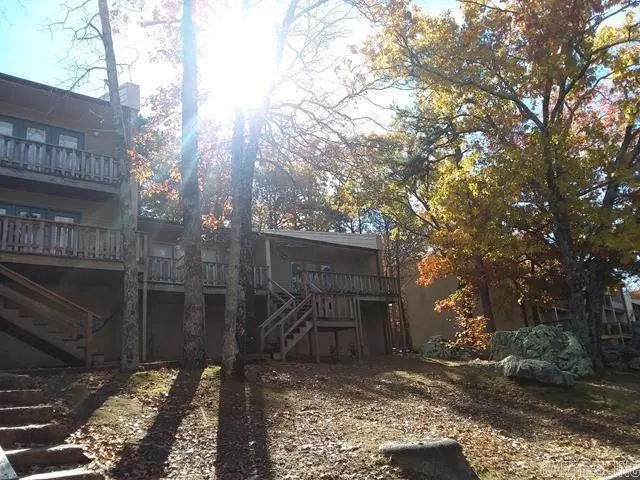
601 Dave Creek Pkwy #86 · Fairfield Bay, AR
Flood risk No data
- FEMA flood zone
- —
- Chance of flooding over 30 yrs
- —
- Est. flood insurance / yr
- —
Fire risk No data
- Est. fire insurance / yr
- —
Heat risk No data
- Hot days now (above threshold)
- —
- Hot days in 30 yrs
- —
Wind risk No data
- Chance of severe wind over 30 yrs
- —
Air-quality risk No data
- Unhealthy air days now
- —
- Unhealthy air days in 30 yrs
- —
Risk factors via First Street. Map © Google.
Why this score? — see what drove the D+ grade
The composite is a weighted blend of 9 inputs, each scored 0–100. Each bar is that input's sub-score; the figure is the points it added to the 100-point composite (weight × sub-score).
- Cash flow +15.0/30.0
- ARV discount +7.5/15.0
- 1% rule +5.0/10.0
- DSCR +5.0/10.0
- Appreciation +4.8/10.0
- Schools +3.8/10.0
- Livability +3.1/5.0
- Rent growth +2.5/5.0
- Condition / age +2.5/5.0
$25,000
🖨 Deal sheet (PDF) 📄 Offer letter ✓ Due diligence
Listing remarks MLS
Very Nice 1 bedroom 1 bath condo that is in walking distance to the Cool Pool, Tennis and Pickleball courts and just down the road from the Hart Center. Very nice with new flooring and paint.
Key facts
- $330 HOA
- Community pool
- Built 1980
Tags
Neighborhood map
What this means for you Summary
Snapshot
- This is a 1-bed/1.0-bath condo listed at $25k.
Deal economics
- At list price, monthly cash flow is $762 ($9k/yr) — positive.
- The deal already cash-flows at list — no discount required.
- Meets the 1% rule at list price ($2k rent vs $25k).
- Recommended offer: $22k (12.0% below list) — sets the bar for market timing.
- Cap rate 42.9% vs local median 5.7% in Fairfield Bay — top-decile yield for the area; either an underpriced asset or a hidden risk that comps aren't pricing in. Stress-test before assuming the spread holds.
Location & tenants
- Location reads 62/100 on livability (#220 in AR) — a middle-class / working-renter tenant base. Strengths: cost of living A+, housing A+, crime B; Watch: employment D+, amenities F, commute F.
- Shirley School District (rural): math 44% / reading 42% proficiency, ranked #132 of 245 in AR (top 54%) — families likely to look elsewhere, expect single-tenant / working-renter base with shorter leases; 73% free/reduced lunch — lower-income household profile, screen leases tightly.
- Zoned schools: Shirley Elementary School (math 12% / reading 12%, grade F, #419 of 454 statewide, top 93%, 180 students, 100% FRL); Shirley High School (math 22% / reading 32%, grade F, #164 of 292 statewide, top 61%, 139 students, 100% FRL) — zoned schools average 100% FRL vs 73% district-wide (27 pts higher); higher-poverty schools than district average — tighter screening recommended.
- Zoned-school proficiency averages 20% at this address vs 43% district-wide (-24 pts) — the specific schools serving this property underperform the Shirley School District average; the district grade overstates school quality for this exact location.
- Market conditions: 264 active listings in the ZIP; 16 units permitted in Van Buren County in 2024 (0 in 5+ unit buildings).
Forward outlook
- In year one you build about $54 of equity ($173 loan paydown + $-119 appreciation (-0.5% local appreciation)).
- Van Buren County population projected at -27% by 2050 — secular population decline; favor cash flow + early exit over multi-decade hold.
- At projected returns (-0.5% appreciation + 3.0% rent growth), your $7k cash investment doubles in ~1 year — after that, you're playing with house money.
Negotiation context
- It's been on market 254 days — a 12% lower offer ($22k) is reasonable based on typical stale-listing flexibility.
- 2 sale attempts since 15y ago; this cycle's ask has dropped $25k (50%) from the opening price — seller is motivated, your offer sets the floor, not the list.
- Current owner paid $12k; list at $25k implies a 100% gain — meaningful room to come down on a strong offer.
Risks & watch-outs
- Watch-outs: HOA is 21% of rent.
Questions for the listing agent
- It's been on market 254 days. Have you received any prior offers? Is the seller open to a 12% concession, seller financing, or rate buy-down credit?
- What does the HOA fee cover, when was the last increase, and are there any pending special assessments or reserve-fund shortfalls?
- Any open or pending special assessments — roof, HVAC, plumbing, elevator, façade? What's the per-unit balance and payoff schedule, and is the seller paying it off at close or rolling it to the buyer?
- Why hasn't it sold? Are there any deal-killer items the seller is aware of (foundation, flood, title, zoning, code violations)?
- Is there a deadline driving the sale (1031 exchange, divorce, estate, relocation)? That informs how much negotiation room exists.
- Schools are F-rated, which usually means shorter tenancies and higher turnover. Who's the typical renter profile here, and what's been the actual vacancy rate?
- The area grade is low — what's the realistic commute time and amenity access for the typical tenant pool here? Any planned neighborhood developments (good or bad) we should know about?
- What's the average days-on-market for RENTAL listings here right now (not sales)? A rising rental-DOM trend means longer vacancies and softer asking-rent achievability than the comps imply.
- What's the recent tenant-quality profile in this submarket — average credit score on applications, eviction rate, late-payment / NSF rate, and stable-employment percentage? A property-management company in the area should have these aggregated.
- How much new apartment / multifamily construction is in the pipeline within 1–3 miles? Heavy new supply (>2% of stock underway) typically softens rents 12–24 months out; light construction supports rent growth.
Investment metrics
- 1% rule
- 6.35% ✓
- Cap rate
- 42.88%
- Cash-on-cash
- 130.65%
- DSCR
- 6.81
- GRM
- 1.3
CMA / ARV
- ARV (median comp)
- $83,882
- List price
- $25,000
- Delta
- -70.20%
- Verdict
- UNDERPRICED
- Comps
- 20 within 1.0 mi
Projected returns pro-forma
-0.48% appreciation · 3.0% rent growth · sell at horizon
- IRR
- —
- Equity multiple
- 7.78×
- Total profit
- $47,475
- Equity at exit
- $6,669
- IRR
- —
- Equity multiple
- 16.34×
- Total profit
- $107,407
- Equity at exit
- $7,560
Cash invested: $7,000 (down + closing). Projections, not guarantees.
Landlord ↔ Tenant lean methodology
- Overall (STATE)
- 92 Strongly Landlord-Friendly
- State Arkansas
- 92 Strongly Landlord-Friendly · R+14
- County
- — inherits STATE
- City
- — inherits STATE
ZIP-level market 72088
- Home prices YoY
- -0.2%
- Active inventory
- 264
- Price-to-rent
- 1.3×
Monthly cashflow live
- Estimated rent
- $1,588 medium interval (Pro) →
- Mortgage (P&I)
- −$131
- Tax from tax record
- −$21 /mo · $255/yr
- Insurance
- −$10
- HOA
- −$330
- Vacancy / Maint / Mgmt
- −$334
- Net cashflow
- $762
Break-even live
Sensitivity live
| Price | -10% $776 | -5% $769 | +0% $762 | +5% $755 | +10% $748 |
|---|---|---|---|---|---|
| Rent | -10% $637 | -5% $699 | +0% $762 | +5% $825 | +10% $888 |
| Rate | -1.0pp $775 | -0.5pp $768 | base $762 | +0.5pp $756 | +1.0pp $749 |
UW: 25.0% down · 7.5% · 30yr · 1.5% tax · 5.0% vac · 8.0% maint · 8.0% mgmt
Financing live
Cash to close
- Down payment
- $6,250
- Closing costs
- $750
- Reserves months
- —
- Total cash needed
- —
Loan-product check · same deal, 3 products live
Conventional
25% down · 7.5% · 30yr
- Down + closing
- —
- Monthly P&I
- —
- Monthly cashflow
- —
- DSCR
- —
- Eligible?
- —
Personal DTI + credit; lowest rate.
DSCR
20% down · 8.5% · 30yr
- Down + closing
- —
- Monthly P&I
- —
- Monthly cashflow
- —
- DSCR
- —
- Eligible?
- —
No personal income docs; deal must DSCR.
Hard money
10% down · 12.0% · 12mo
- Down + closing
- —
- Monthly P&I
- —
- Monthly cashflow
- —
- DSCR
- —
- Eligible?
- —
Short-term bridge; refi at stabilization.
HOA detail condo
- Monthly dues
- $330 · $3,960/yr
- Likely covers
- pool
- Assessments
- None detected in remarks — confirm with the listing agent.
Listing history 10 events
-
2026-05-19price $25,000 191-char remark
Show marketing remark (191 chars)
Very Nice 1 bedroom 1 bath condo that is in walking distance to the Cool Pool, Tennis and Pickleball courts and just down the road from the Hart Center. Very nice with new flooring and paint.
-
2025-09-15$49,900 New Listing 191-char remark
Show marketing remark (191 chars)
Very Nice 1 bedroom 1 bath condo that is in walking distance to the Cool Pool, Tennis and Pickleball courts and just down the road from the Hart Center. Very nice with new flooring and paint.
-
2011-12-30soldstatus $12,500 243-char remark
Show marketing remark (243 chars)
Just doesn't get any better than this. .. HUGE Price Reduction. .. gotta check this one out today!! This is a Fannie Mae property. Special programs, incentives & financing opportunities may be available. Learn more at www. HomePath.com .
-
2011-12-15historical 243-char remark
Show marketing remark (243 chars)
Just doesn't get any better than this. .. HUGE Price Reduction. .. gotta check this one out today!! This is a Fannie Mae property. Special programs, incentives & financing opportunities may be available. Learn more at www. HomePath.com .
-
2011-10-13$12,500 243-char remark
Show marketing remark (243 chars)
Just doesn't get any better than this. .. HUGE Price Reduction. .. gotta check this one out today!! This is a Fannie Mae property. Special programs, incentives & financing opportunities may be available. Learn more at www. HomePath.com .
-
2005-11-04soldstatus $25,000
-
2002-08-16soldstatus $20,000
-
1997-09-19soldstatus $22,000
-
1995-07-25soldstatus $18,000
-
1994-06-13soldstatus $19,000
ⓘ Source: listings_history table (triggers on properties + properties_extension) + one-shot
backfill from property_details.listing_events for pre-trigger history.
Tax reassessment forecast AR · Resets to sale price
- Current annual tax
- $255 · $21/mo
- Projected year-2 tax
- $255 · $21/mo
- Expected delta
- $0/yr ($0/mo · 0.0%)
ⓘ Screening estimate from a state-policy table — verify with the county assessor before closing.
Nearby sold comps map
Loading sold comps map…
Walkable amenities ~0.75 mi
Loading nearby amenities…
Taxation est. · year 1
- Rental income
- $19,062
- − Mortgage interest
- −$1,400
- − Property taxes
- −$255
- − Insurance
- −$125
- − Repairs & maintenance
- −$1,525
- − Management
- −$1,525
- − HOA
- −$3,960
- − Depreciation
- −$727
- Taxable income
- $9,544
- Est. tax owed @ 24.0%
- −$2,291
- After-tax cash flow
- $6,855/yr
For passive investors: Depreciation is non-cash, so a rental often shows a tax loss while cash-flowing — sheltering income. Rental losses are passive: they offset passive income freely, and up to $25,000/yr can offset ordinary (W-2) income if you actively participate and your MAGI is under $100k (phasing out to $0 by $150k); unused losses carry forward. On sale, claimed depreciation is recaptured at up to 25%, and gains may owe capital-gains tax (a 1031 exchange can defer both). Figures are a year-1 estimate at your 24.0% rate — not tax advice; consult a CPA.
Schools (NCES district)
- District
- Shirley School District
- NCES district ID
- 0512420
- Math proficiency
- 44% ▲ 4.00%
- Reading proficiency
- 42% ▲ 1.00%
- Median HH income
- $36,296
- Composite
- 37.98/100
- National rank
- #8669
- State rank
- #132 of 245 in AR
Livability — Fairfield Bay
- Score
- 62/100
- State rank
- #220
- US rank
- #16778
Category grades
Schools grade is shown separately in the Schools card above.
Census & demographics
- Census place
- Fairfield Bay, AR
- City population
- 2,264
- Population (ZIP)
- 2,264
Population outlook (Van Buren County) Hauer SSP2
- Today (2025)
- 15,459 people
- By 2030
- 14,645 · -5.3%
- By 2040
- 12,918 · -16.4%
- By 2050
- 11,263 · -27.1%
- By 2075
- 7,870 · -49.1%
- By 2100
- 4,918 · -68.2%
Race, ethnicity, and origin ACS 2023
- Neighborhood character
- Predominantly White (88%)
- Race & ethnicity
- White 88% Hispanic / Latino 6% Two or more races 3% Asian 2%
- Hispanic origin (detail)
- Mexican 6%
- Common ancestry
- Lithuanian 9% Iranian 2% Romanian 2%
- Foreign-born
- 3% · Canada, Dominican Republic
- Languages at home
- 94% English-only · Other Asian/Pacific 4% Tagalog/Filipino 1% Spanish 1%
Political lean MEDSL · Van Buren
- 2024 margin
- Solid R (+60.2) · D 18.9% · R 79.0% · Other 2.1%
- 2008→2024 swing
- -28.5pp toward R · 2008: -31.7pp · 2024: -60.2pp
- All cycles
- 2024: R+60.2 2020: R+56.9 2016: R+53.9 2012: R+39.5 2008: R+31.7
Not yet ingested
- Civics
- —
Market trends
- HPI YoY
- ▼ -0.48%
- Current HPI
- 238.2694
- Rent YoY
- —
- Metro
- —
- State GDP YoY
- ▲ 3.80%
- F500 in state
- 10
Industry mix (Fortune 500 HQ in AR)
| Industry | F500 HQs | Revenue |
|---|---|---|
| Retail | 1 | $681B |
|
||
| Food / Agriculture | 1 | $53B |
|
||
| Retail / Energy | 1 | $22B |
|
||
| Transportation / Logistics | 1 | $12B |
|
||
| Energy | 1 | $4B |
|
||
Price history
+31.6% since first listed10 events — show timeline
- 2026-05-19 Price Changed $25,000 CARMLS
- 2025-09-15 Listed $49,900 CARMLS
- 2011-12-30 Sold (MLS) $12,500 CARMLS
- 2011-12-15 Listing Removed — CARMLS
- 2011-10-13 Listed $12,500 CARMLS
- 2005-11-04 Sold (Public Records) $25,000 Public Records
- 2002-08-16 Sold (Public Records) $20,000 Public Records
- 1997-09-19 Sold (Public Records) $22,000 Public Records
- 1995-07-25 Sold (Public Records) $18,000 Public Records
- 1994-06-13 Sold (Public Records) $19,000 Public Records
Cash-flow waterfall
monthlySold comps — $/sqft
last 12 mo · ≤1 miLoading sold comps…