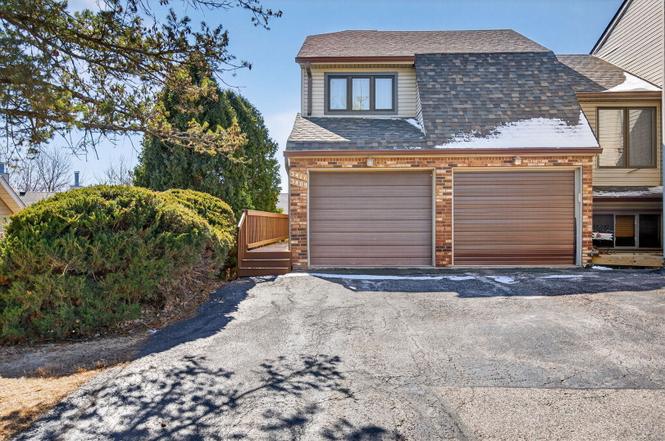
3409 Parkwild Dr #101 · Bettendorf, IA
Flood risk No data
- FEMA flood zone
- —
- Chance of flooding over 30 yrs
- —
- Est. flood insurance / yr
- —
Fire risk No data
- Est. fire insurance / yr
- —
Heat risk No data
- Hot days now (above threshold)
- —
- Hot days in 30 yrs
- —
Wind risk No data
- Chance of severe wind over 30 yrs
- —
Air-quality risk No data
- Unhealthy air days now
- —
- Unhealthy air days in 30 yrs
- —
Risk factors via First Street. Map © Google.
Why this score? — see what drove the D grade
The composite is a weighted blend of 9 inputs, each scored 0–100. Each bar is that input's sub-score; the figure is the points it added to the 100-point composite (weight × sub-score).
- Cash flow +8.0/30.0
- Schools +7.6/10.0
- ARV discount +7.5/15.0
- 1% rule +5.2/10.0
- Livability +4.0/5.0
- Rent growth +3.2/5.0
- Condition / age +2.5/5.0
- DSCR +2.0/10.0
- Appreciation +0.0/10.0
$132,500
🖨 Deal sheet (PDF) 📄 Offer letter ✓ Due diligence
Key facts
- $289 HOA
- Garage
- Community pool
Property features AI
Finance
- Other: Unit in a 2-unit building; Living area reported from assessor (total finished area ~900)
- HOA & community: Monthly association fee of $289 covering pool, lawn care, and snow removal; Pets allowed (with number limit)
Exterior
- Parking: Attached garage (1 garage space; 1 total parking space)
- Utilities: Public water; Public sewer
- Home design: Attached single, condo/duplex; One entry level
- Construction: Vinyl siding; Approximately 41–50 years old
- Exterior features: Condo setting
Interior
- Kitchen: Kitchen located on main level, 10 x 11
- Bedrooms: Two bedrooms (including a main-level master bedroom); Bedroom with main-level 19 x 10 dimensions; Master bedroom on main level, 12 x 13
- Bathrooms: One full bathroom
- Heating & cooling: Natural gas forced-air heating; Central air conditioning
- Interior features: Five total rooms
- Laundry & utility: Dedicated laundry room
Neighborhood map
What this means for you Summary
Snapshot
- This is a 2-bed/1.0-bath condo listed at $132k.
Deal economics
- At list price, monthly cash flow is $-137 ($-2k/yr) — negative.
- To cash-flow at today's rent, offer at most $108k (18.2% below list).
- Meets the 1% rule at list price ($1k rent vs $132k).
- Recommended offer: $108k (18.2% below list) — sets the bar for cash-flow.
- Cap rate 5.1% vs local median 3.0% in Bettendorf — top-decile yield for the area; either an underpriced asset or a hidden risk that comps aren't pricing in. Stress-test before assuming the spread holds.
Location & tenants
- Location reads 81/100 on livability (#73 in IA, #1,579 nationally) — a professional / high-income tenant draw. Strengths: crime A+, employment A+, housing A+; Watch: amenities F, commute F.
- Pleasant Valley Community School District (suburban): math 87% / reading 85% proficiency, ranked #5 of 289 in IA (top 2%) — strong family-tenant draw, lease renewals of 3-5y typical; only 8% free/reduced lunch — higher-income household profile.
- Zoned schools: Riverdale Heights Elem School (math 85% / reading 80%, grade A+, #43 of 616 statewide, top 7%, 629 students, 23% FRL); Pleasant Valley Junior High School (math 86% / reading 84%, grade A+, #9 of 246 statewide, top 3%, 856 students, 12% FRL); Pleasant Valley High School (math 83% / reading 87%, grade A, #12 of 336 statewide, top 4%, 1,658 students, 11% FRL).
- Market conditions: Rents rising (+2.9%/yr); 432 active listings in the ZIP; 13 comparable units currently listed for rent nearby; rentals at typical pace (median 16d on market — plan ~3-4 weeks tenant-placement turnaround); solid renter incomes; 805 units permitted in Scott County in 2024 (479 in 5+ unit buildings).
- This rent is only 16% of the median local income ($102k/yr) — well below the 30% rent-burden line; pricing power to push rent on renewal without tenant pushback.
Forward outlook
- Local home prices are declining (-3.0%/yr); year-one equity from $916 of loan paydown is wiped out by about $4k of value loss. Plan a longer hold.
- Scott County population projected at +19% by 2050 — long-run rental-demand tailwind backs the buy-and-hold thesis.
Negotiation context
- It's been on market 60 days — a 3% lower offer ($129k) is reasonable based on typical stale-listing flexibility.
- 2 sale attempts since 3y ago; this cycle's ask has dropped $12k (9%) from the opening price — seller is motivated, your offer sets the floor, not the list.
- Current owner paid $115k; 15% above their basis — modest negotiation headroom, anchor on the comps not their cost.
Risks & watch-outs
- Watch-outs: HOA is 21% of rent.
Questions for the listing agent
- What do current leases actually rent for vs. the listed asking? Can we see a recent rent roll and the last 12 months of T-12 income?
- It's been on market 60 days. Have you received any prior offers? Is the seller open to a 18% concession, seller financing, or rate buy-down credit?
- What does the HOA fee cover, when was the last increase, and are there any pending special assessments or reserve-fund shortfalls?
- Any open or pending special assessments — roof, HVAC, plumbing, elevator, façade? What's the per-unit balance and payoff schedule, and is the seller paying it off at close or rolling it to the buyer?
- Is there a deadline driving the sale (1031 exchange, divorce, estate, relocation)? That informs how much negotiation room exists.
- Schools are A-rated — typically a magnet for longer-tenancy family renters. What's the average tenant stay here, and is there a school-zone premium baked into asking?
- The area grade is low — what's the realistic commute time and amenity access for the typical tenant pool here? Any planned neighborhood developments (good or bad) we should know about?
- What's the average days-on-market for RENTAL listings here right now (not sales)? A rising rental-DOM trend means longer vacancies and softer asking-rent achievability than the comps imply.
- What's the recent tenant-quality profile in this submarket — average credit score on applications, eviction rate, late-payment / NSF rate, and stable-employment percentage? A property-management company in the area should have these aggregated.
- How much new apartment / multifamily construction is in the pipeline within 1–3 miles? Heavy new supply (>2% of stock underway) typically softens rents 12–24 months out; light construction supports rent growth.
Investment metrics
- 1% rule
- 1.02% ✓
- Cap rate
- 5.06%
- Cash-on-cash
- -4.42%
- DSCR
- 0.80
- GRM
- 8.2
CMA / ARV
No comps found within radius.
Projected returns pro-forma
-3.0% appreciation · 2.88% rent growth · sell at horizon
- IRR
- -23.7%
- Equity multiple
- 0.19×
- Total profit
- $-30,135
- Equity at exit
- $19,756
- IRR
- -18.6%
- Equity multiple
- -0.01×
- Total profit
- $-37,305
- Equity at exit
- $11,456
Cash invested: $37,100 (down + closing). Projections, not guarantees.
Landlord ↔ Tenant lean methodology
- Overall (STATE)
- 83 Strongly Landlord-Friendly
- State Iowa
- 83 Strongly Landlord-Friendly · R+6
- County
- — inherits STATE
- City
- — inherits STATE
ZIP-level market 52722
- Rents YoY
- 2.9%
- Active inventory
- 432
- Price-to-rent
- 8.2×
Monthly cashflow live
- Estimated rent
- $1,353 high interval (Pro) →
- Mortgage (P&I)
- −$695
- Tax from tax record
- −$167 /mo · $1,999/yr
- Insurance
- −$55
- HOA
- −$289
- Vacancy / Maint / Mgmt
- −$284
- Net cashflow
- $-137
Break-even live
Sensitivity live
| Price | -10% $-62 | -5% $-99 | +0% $-137 | +5% $-174 | +10% $-212 |
|---|---|---|---|---|---|
| Rent | -10% $-244 | -5% $-190 | +0% $-137 | +5% $-83 | +10% $-30 |
| Rate | -1.0pp $-70 | -0.5pp $-103 | base $-137 | +0.5pp $-171 | +1.0pp $-206 |
UW: 25.0% down · 7.5% · 30yr · 1.5% tax · 5.0% vac · 8.0% maint · 8.0% mgmt
Financing live
Cash to close
- Down payment
- $33,125
- Closing costs
- $3,975
- Reserves months
- —
- Total cash needed
- —
Loan-product check · same deal, 3 products live
Conventional
25% down · 7.5% · 30yr
- Down + closing
- —
- Monthly P&I
- —
- Monthly cashflow
- —
- DSCR
- —
- Eligible?
- —
Personal DTI + credit; lowest rate.
DSCR
20% down · 8.5% · 30yr
- Down + closing
- —
- Monthly P&I
- —
- Monthly cashflow
- —
- DSCR
- —
- Eligible?
- —
No personal income docs; deal must DSCR.
Hard money
10% down · 12.0% · 12mo
- Down + closing
- —
- Monthly P&I
- —
- Monthly cashflow
- —
- DSCR
- —
- Eligible?
- —
Short-term bridge; refi at stabilization.
Rent comps 13 comps
| Address | Beds | Baths | Sqft | Rent | $/sqft | DOM | Units | Dist |
|---|---|---|---|---|---|---|---|---|
| 2835 Tanglefoot Ln Apt 9 Bettendorf, IA | 2.0 | 1.0 | 880 | $875 | $0.99 | 46d | 1 | 0.47mi |
| 3939 53rd Ave Bettendorf, IA | 3.0 | 1.0–2.0 | 951 | $1,699 | $1.79 | 15d | 29 | 0.75mi |
| 2900 Middle Rd Bettendorf, IA | 1.0–3.0 | 1.0–2.0 | 996 | $1,345 | $1.35 | 15d | 27 | 0.75mi |
| 2319 Pinehurst St Bettendorf, IA | 3.0 | 1.0 | 825 | $1,800 | $2.18 | 15d | 1 | 0.87mi |
| 2796 Willow Dr Apt 5 Bettendorf, IA | 2.0 | 1.0 | 875 | $995 | $1.14 | 46d | 1 | 0.88mi |
| 5454 Devils Glen Rd Bettendorf, IA | 1.0 | 1.0 | 613 | $1,245 | $2.03 | 15d | 1 | 0.95mi |
| 5454 Devils Glen Rd #104 Bettendorf, IA | 1.0 | 1.0 | 627 | $1,395 | $2.22 | 46d | 1 | 0.95mi |
| 5472 Devils Glen Rd Unit 319 Bettendorf, IA | 2.0 | 2.0 | 1065 | $1,695 | $1.59 | 15d | 1 | 0.98mi |
| 5472 Devils Glen Rd #204 Bettendorf, IA | 2.0 | 2.0 | 1065 | $1,695 | $1.59 | 23d | 1 | 0.98mi |
| 3430 Holiday Ct #4 Bettendorf, IA | 2.0 | 1.0 | 750 | $1,100 | $1.47 | 15d | 1 | 0.98mi |
| 3430 Holiday Ct Unit 1 Bettendorf, IA | 1.0 | 1.0 | 750 | $1,200 | $1.60 | 23d | 1 | 0.98mi |
| 5472 Devils Glen Rd Bettendorf, IA | 1.0–3.0 | 1.0–3.0 | 1141 | $1,790 | $1.57 | 15d | 2 | 0.99mi |
| 5472 Devils Glen Rd Bettendorf, IA | 2.0–3.0 | 2.0–3.0 | 1293 | $1,695 | $1.31 | 46d | 2 | 0.99mi |
HOA detail condo
- Monthly dues
- $289 · $3,468/yr
- Assessments
- None detected in remarks — confirm with the listing agent.
Listing history 11 events
-
2026-05-01status Pending
-
2026-04-27price $132,500
-
2026-04-03price $140,000
-
2026-03-02$145,000 Active
-
2023-10-03historical
-
2023-10-03historical
-
2023-09-11price
-
2023-08-17Active
-
2021-08-27soldstatus $115,000
-
2021-08-27soldstatus $115,000
-
2019-05-03soldstatus $77,000
ⓘ Source: listings_history table (triggers on properties + properties_extension) + one-shot
backfill from property_details.listing_events for pre-trigger history.
Tax reassessment forecast IA · Partial reset (capped growth)
- Current annual tax
- $1,999 · $167/mo
- Projected year-2 tax
- $2,040 · $170/mo
- Expected delta
- +$41/yr (+$3/mo · 2.0%)
ⓘ Screening estimate from a state-policy table — verify with the county assessor before closing.
Nearby sold comps map
Loading sold comps map…
Walkable amenities ~0.75 mi
Loading nearby amenities…
Taxation est. · year 1
- Rental income
- $16,239
- − Mortgage interest
- −$7,422
- − Property taxes
- −$1,999
- − Insurance
- −$662
- − Repairs & maintenance
- −$1,299
- − Management
- −$1,299
- − HOA
- −$3,468
- − Depreciation
- −$3,855
- Taxable loss
- −$3,766
- Est. tax savings @ 24.0%
- +$904
- After-tax cash flow
- $-735/yr
For passive investors: Depreciation is non-cash, so a rental often shows a tax loss while cash-flowing — sheltering income. Rental losses are passive: they offset passive income freely, and up to $25,000/yr can offset ordinary (W-2) income if you actively participate and your MAGI is under $100k (phasing out to $0 by $150k); unused losses carry forward. On sale, claimed depreciation is recaptured at up to 25%, and gains may owe capital-gains tax (a 1031 exchange can defer both). Figures are a year-1 estimate at your 24.0% rate — not tax advice; consult a CPA.
Schools (NCES district)
- District
- Pleasant Valley Community School District
- NCES district ID
- 1923110
- Math proficiency
- 87% ▼ -4.00%
- Reading proficiency
- 85% ▼ -2.00%
- Median HH income
- $80,716
- Composite
- 75.59/100
- National rank
- #130
- State rank
- #5 of 289 in IA
Livability — Bettendorf
- Score
- 81/100
- State rank
- #73
- US rank
- #1579
Category grades
Schools grade is shown separately in the Schools card above.
Census & demographics
- Census place
- Bettendorf, IA
- County
- Scott County · 144,583 people
- City population
- 41,264
- Metro
- Davenport-Moline-Rock Island, IA-IL
- Population (ZIP)
- 41,264
- Household income
- $101,546
- Rent vs Own
- Severe rent burden
- 935.0
Population outlook (Scott County) Hauer SSP2
- Today (2025)
- 188,878 people
- By 2030
- 196,648 · +4.1%
- By 2040
- 210,860 · +11.6%
- By 2050
- 224,359 · +18.8%
- By 2075
- 258,884 · +37.1%
- By 2100
- 286,447 · +51.7%
Race, ethnicity, and origin ACS 2023
- Neighborhood character
- Predominantly White (82%)
- Race & ethnicity
- White 82% Asian 7% Two or more races 7% Hispanic / Latino 5% Black 2%
- Common ancestry
- Portuguese 3% Italian 3% Romanian 2%
- Foreign-born
- 7% · Canada, China, Vietnam
- Languages at home
- 92% English-only · Other Asian/Pacific 2% Spanish 2% Other Indo-European 1%
Political lean MEDSL · Scott
- 2024 margin
- Toss-up / Even · D 47.3% · R 51.2% · Other 1.4%
- 2008→2024 swing
- -18.4pp toward R · 2008: 14.6pp · 2024: -3.9pp
- All cycles
- 2024: R+3.9 2020: D+3.5 2016: D+1.4 2012: D+13.8 2008: D+14.6
Not yet ingested
- Civics
- —
Market trends
- HPI YoY
- ▼ -111.45%
- Current HPI
- 194.8355
- Rent YoY
- ▲ 2.88%
- Metro
- Davenport-Moline-Rock Island, IA-IL
- State GDP YoY
- ▲ 2.48%
- F500 in state
- 4
Industry mix (Fortune 500 HQ in IA)
| Industry | F500 HQs | Revenue |
|---|---|---|
| Financial Services | 1 | $16B |
|
||
| Retail / Convenience | 1 | $15B |
|
||
Price history
+72.1% since first listed11 events — show timeline
- 2026-05-01 Pending — MRED as Distributed by MLS Grid
- 2026-04-27 Price Changed $132,500 MRED as Distributed by MLS Grid
- 2026-04-03 Price Changed $140,000 MRED as Distributed by MLS Grid
- 2026-03-02 Listed $145,000 MRED as Distributed by MLS Grid
- 2023-10-03 Listing Removed — RMLSA as Distributed by MLS Grid
- 2023-10-03 Listing Removed — MRED as Distributed by MLS Grid
- 2023-09-11 Price Changed — RMLSA as Distributed by MLS Grid
- 2023-08-17 Listed — RMLSA as Distributed by MLS Grid
- 2021-08-27 Sold (Public Records) $115,000 Public Records
- 2021-08-27 Sold (Public Records) $115,000 Public Records
- 2019-05-03 Sold (Public Records) $77,000 Public Records
Property tax history
+2.5%/yrLatest (2025): $1,999 · -7.1% YoY. Source: county tax records.
Cash-flow waterfall
monthlySold comps — $/sqft
last 12 mo · ≤1 miLoading sold comps…