 Duplex
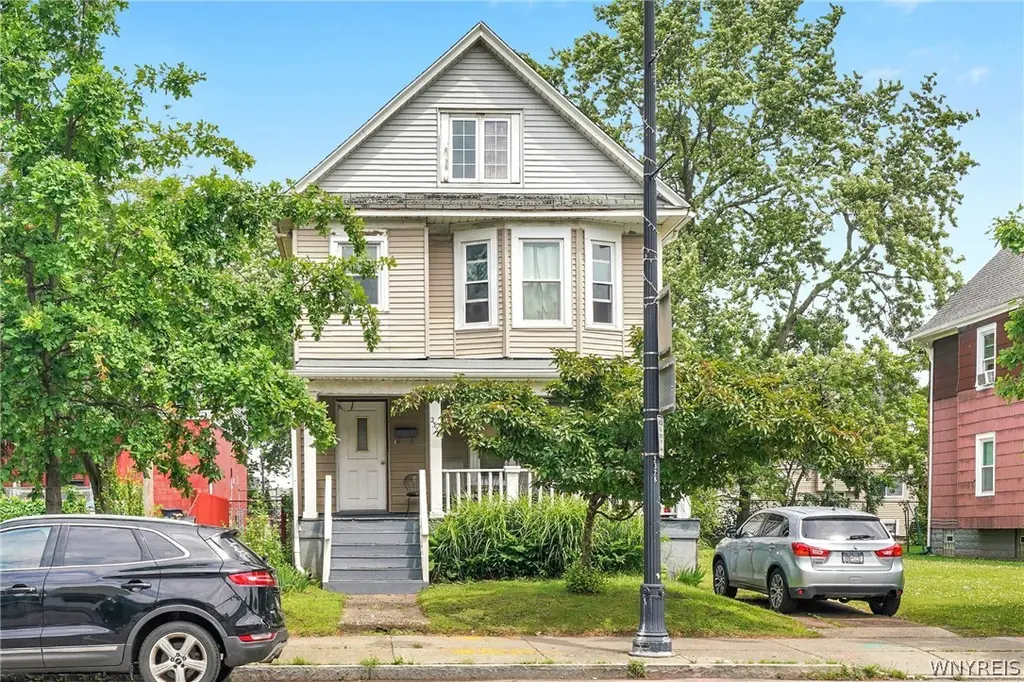
2328 South Park Ave · Buffalo, NY
Flood risk 5/10 · Moderate
- FEMA flood zone
- X (unshaded)
- Chance of flooding over 30 yrs
- 0.65%
- Est. flood insurance / yr
- $473 – $860
Fire risk 1/10 · Minimal
- Est. fire insurance / yr
- $691 – $1,283
Heat risk 3/10 · Minor
- Hot days now (above 92°F)
- 7 days/yr
- Hot days in 30 yrs
- 15 days/yr
Wind risk 1/10 · Minimal
- Chance of severe wind over 30 yrs
- —
Air-quality risk 4/10 · Minor
- Unhealthy air days now
- 3 days/yr
- Unhealthy air days in 30 yrs
- 8 days/yr
Risk factors via First Street. Map © Google.
Why this score? — see what drove the B+ grade
The composite is a weighted blend of 9 inputs, each scored 0–100. Each bar is that input's sub-score; the figure is the points it added to the 100-point composite (weight × sub-score).
- Cash flow +29.4/30.0
- ARV discount +15.0/15.0
- DSCR +10.0/10.0
- 1% rule +6.9/10.0
- Rent growth +4.4/5.0
- Livability +3.9/5.0
- Schools +3.3/10.0
- Condition / age +2.5/5.0
- Appreciation +0.0/10.0
$200,000
🖨 Deal sheet (PDF) 📄 Offer letter ✓ Due diligence
Multi-family units
County records classify this as Multi-Family (2-4 Unit). Listing-text estimate: 2 units. confirmed
Listing remarks MLS
Great opportunity in a desirable South Buffalo location! This upper/lower 2-unit features two 2-bedroom, 1-bath apartments with separate utilities and solid mechanicals. Rents are currently below market, offering potential for future upside. Exterior features low-maintenance vinyl siding, and the property has been well maintained over the years. A versatile property with value-add potential, ideal for an owner-occupant or investor looking to build long-term equity.
Key facts
- Separate utilities
- Value-add potential
- Well maintained
Tags
Neighborhood map
What this means for you Summary
Snapshot
- This is a 2 × 2-bed/1.0-bath units multifamily listed at $200k.
Deal economics
- At list price, monthly cash flow is $707 ($8k/yr) — positive. Per door: $353/mo.
- The deal already cash-flows at list — no discount required.
- Meets the 1% rule at list price ($2k rent vs $200k).
- Recommended offer: $182k (9.0% below list) — sets the bar for market timing.
- Cap rate 10.5% vs local median 8.0% in Buffalo — top-decile yield for the area; either an underpriced asset or a hidden risk that comps aren't pricing in. Stress-test before assuming the spread holds.
Location & tenants
- Location reads 77/100 on livability (#195 in NY, #3,011 nationally) — a middle-class / working-renter tenant base. Strengths: commute A+, housing A+, health & safety A+; Watch: crime F, employment D-.
- Buffalo City School District (urban): math 41% / reading 40% proficiency, ranked #535 of 590 in NY (top 91%) — families likely to look elsewhere, expect single-tenant / working-renter base with shorter leases; 75% free/reduced lunch — lower-income household profile, screen leases tightly.
- Market conditions: Rents rising fast (+7.6%/yr); 136 active listings in the ZIP; 2 comparable units currently listed for rent nearby; 1,244 units permitted in Erie County in 2024 (563 in 5+ unit buildings).
- This rent runs 40% of the median local income ($71k/yr) — at the standard rent-burdened threshold; future hikes will face affordability resistance.
Forward outlook
- Local home prices are declining (-3.0%/yr); year-one equity from $1k of loan paydown is wiped out by about $6k of value loss. Plan a longer hold.
- At projected returns (-3.0% appreciation + 7.6% rent growth), your $56k cash investment doubles in ~7 years — after that, you're playing with house money.
Negotiation context
- It's been on market 114 days — a 9% lower offer ($182k) is reasonable based on typical stale-listing flexibility.
- 2 sale attempts with the ask held roughly flat each time — persistent listings suggest the price (not the market) is what's stuck; bring a comps-based counter.
Risks & watch-outs
- Watch-outs: built in 1918 — expect roof / HVAC / electrical / plumbing capex.
- Climate carrying-cost: moderate flood risk — expect insurance premiums to compound above CPI over the hold.
Questions for the listing agent
- It's been on market 114 days. Have you received any prior offers? Is the seller open to a 9% concession, seller financing, or rate buy-down credit?
- Can we see the unit-by-unit rent roll, current vacancy, and any below-market leases? What's the average tenancy length?
- What capital expenditures (roof, boiler, parking lot, exteriors) have been made in the last 5 years, and what's planned in the next 2?
- Built in 1918 — when were the roof, HVAC, electrical panel, plumbing, and water heater last replaced?
- Why hasn't it sold? Are there any deal-killer items the seller is aware of (foundation, flood, title, zoning, code violations)?
- Is there a deadline driving the sale (1031 exchange, divorce, estate, relocation)? That informs how much negotiation room exists.
- Crime grade is F in this area — have there been break-ins, vandalism, or insurance claims at this property in the last 3 years? What carrier currently insures it and at what premium?
- What's the average days-on-market for RENTAL listings here right now (not sales)? A rising rental-DOM trend means longer vacancies and softer asking-rent achievability than the comps imply.
- What's the recent tenant-quality profile in this submarket — average credit score on applications, eviction rate, late-payment / NSF rate, and stable-employment percentage? A property-management company in the area should have these aggregated.
- How much new apartment / multifamily construction is in the pipeline within 1–3 miles? Heavy new supply (>2% of stock underway) typically softens rents 12–24 months out; light construction supports rent growth.
Investment metrics
- 1% rule
- 1.19% ✓
- Cap rate
- 10.53%
- Cash-on-cash
- 15.14%
- DSCR
- 1.67
- GRM
- 7.0
CMA / ARV
- ARV (median comp)
- $393,559
- List price
- $200,000
- Delta
- -49.18%
- Verdict
- UNDERPRICED
- Comps
- 20 within 1.0 mi
Show comp detail 12 sales within ~0.75 mi
| Address | Dist | Beds/Ba | Sqft | Sold | Price | $/sf | Match |
|---|---|---|---|---|---|---|---|
| 51 Ashton Pl | 0.11mi | 3/2.0 (-1) | 1,736 (-8%) | 3mo | $240,000 | $138 | 73 |
| 55 Harding Rd | 0.36mi | 4/2.0 | 1,844 (-2%) | 9mo | $275,000 | $149 | 71 |
| 16 Culver Rd | 0.32mi | 4/2.0 | 1,800 (-5%) | 8mo | $262,000 | $146 | 71 |
| 15 Arbour Ln | 0.49mi | 4/2.0 | 1,856 (-2%) | 7mo | $275,000 | $148 | 69 |
| 165 Lockwood Ave | 0.62mi | 4/3.0 | 1,865 (-1%) | 3mo | $195,000 | $105 | 63 |
| 15 Vincent Ave | 0.35mi | 3/2.0 (-1) | 1,803 (-5%) | 11mo | $230,000 | $128 | 62 |
| 183 Lockwood Ave | 0.61mi | 4/2.0 | 1,858 (-2%) | 12mo | $197,500 | $106 | 59 |
| 169 Altruria St | 0.56mi | 5/2.0 (+1) | 1,958 (+4%) | 8mo | $241,000 | $123 | 57 |
| 6 Mckinley Pkwy | 0.43mi | 4/2.0 | 2,110 (+12%) | 9mo | $380,000 | $180 | 54 |
| 137 Lockwood Ave | 0.63mi | 5/2.0 (+1) | 1,936 (+2%) | 13mo | $204,000 | $105 | 50 |
| 123 Kimberly Ave | 0.70mi | 4/2.0 | 1,633 (-14%) | 4mo | $246,500 | $151 | 41 |
| 103 Kimberly Ave | 0.67mi | 4/2.0 | 1,633 (-14%) | 10mo | $271,000 | $166 | 38 |
Match score weights: distance 35% · size 25% · config 20% · recency 20%. Top-matched comps best support the ARV.
Projected returns pro-forma
-3.0% appreciation · 7.62% rent growth · sell at horizon
- IRR
- 10.4%
- Equity multiple
- 1.43×
- Total profit
- $24,059
- Equity at exit
- $29,821
- IRR
- 22.7%
- Equity multiple
- 3.33×
- Total profit
- $130,705
- Equity at exit
- $17,292
Cash invested: $56,000 (down + closing). Projections, not guarantees.
Landlord ↔ Tenant lean methodology
- Overall (STATE)
- 15 Strongly Tenant-Friendly
- State New York
- 15 Strongly Tenant-Friendly · D+10
- County
- — inherits STATE
- City
- — inherits STATE
ZIP-level market 14220
- Home prices YoY
- -26.7%
- Rents YoY
- 7.6%
- Active inventory
- 136
- Price-to-rent
- 14.0×
Monthly cashflow live
- Estimated rent
- $2,376 high interval (Pro) →
- Mortgage (P&I)
- −$1,049
- Tax from tax record
- −$38 /mo · $460/yr
- Insurance
- −$83
- HOA
- −$0
- Vacancy / Maint / Mgmt
- −$499
- Net cashflow
- $707
Break-even live
Sensitivity live
| Price | -10% $820 | -5% $763 | +0% $707 | +5% $650 | +10% $593 |
|---|---|---|---|---|---|
| Rent | -10% $519 | -5% $613 | +0% $707 | +5% $800 | +10% $894 |
| Rate | -1.0pp $807 | -0.5pp $757 | base $707 | +0.5pp $655 | +1.0pp $602 |
2-unit breakdown (identical units grouped — click to expand)
| Units | Beds | Baths | Est. rent |
|---|---|---|---|
| 2× units | 2 | 1 | $2,376 |
| #1 | 2 | 1 | $1,188 |
| #2 | 2 | 1 | $1,188 |
| Total (2 units) | $2,376 | ||
UW: 25.0% down · 7.5% · 30yr · 1.5% tax · 5.0% vac · 8.0% maint · 8.0% mgmt
Financing live
Cash to close
- Down payment
- $50,000
- Closing costs
- $6,000
- Reserves months
- —
- Total cash needed
- —
Loan-product check · same deal, 3 products live
Conventional
25% down · 7.5% · 30yr
- Down + closing
- —
- Monthly P&I
- —
- Monthly cashflow
- —
- DSCR
- —
- Eligible?
- —
Personal DTI + credit; lowest rate.
DSCR
20% down · 8.5% · 30yr
- Down + closing
- —
- Monthly P&I
- —
- Monthly cashflow
- —
- DSCR
- —
- Eligible?
- —
No personal income docs; deal must DSCR.
Hard money
10% down · 12.0% · 12mo
- Down + closing
- —
- Monthly P&I
- —
- Monthly cashflow
- —
- DSCR
- —
- Eligible?
- —
Short-term bridge; refi at stabilization.
Rent comps 2 comps
| Address | Beds | Baths | Sqft | Rent | $/sqft | DOM | Units | Dist |
|---|---|---|---|---|---|---|---|---|
| 74 Woodside Ave Unit 1 Buffalo, NY | 3.0 | 1.0 | 1250 | $1,510 | $1.21 | 2d | 1 | 0.53mi |
| 89 Macamley St #2 Buffalo, NY | 3.0 | 1.0 | 1274 | $1,100 | $0.86 | 11d | 1 | 1.27mi |
Listing history 17 events
-
2026-06-18days on market $200,000 Active 114 DOM
-
2026-06-17days on market $200,000 Active 113 DOM
-
2026-06-16days on market $200,000 Active 112 DOM
-
2026-06-15days on market $200,000 Active 111 DOM
-
2026-06-13days on market $200,000 Active 109 DOM
-
2026-06-13days on market $200,000 Active 108 DOM
-
2026-06-10days on market $200,000 Active 106 DOM
-
2026-06-09days on market $200,000 Active 105 DOM
-
2026-06-08days on market $200,000 Active 104 DOM
-
2026-06-07days on market $200,000 Active 103 DOM
-
2026-06-03days on market $200,000 Active 99 DOM
-
2026-06-02days on market $200,000 Active 98 DOM
-
2026-06-01days on market $200,000 Active 97 DOM
-
2026-05-31days on market $200,000 Active 96 DOM
-
2026-02-24$200,000 Active 469-char remark
Show marketing remark (469 chars)
Great opportunity in a desirable South Buffalo location! This upper/lower 2-unit features two 2-bedroom, 1-bath apartments with separate utilities and solid mechanicals. Rents are currently below market, offering potential for future upside. Exterior features low-maintenance vinyl siding, and the property has been well maintained over the years. A versatile property with value-add potential, ideal for an owner-occupant or investor looking to build long-term equity.
-
2026-01-02historical
-
2025-07-05$1,200,000 Active
ⓘ Source: listings_history table (triggers on properties + properties_extension) + one-shot
backfill from property_details.listing_events for pre-trigger history.
Tax reassessment forecast NY · Partial reset (capped growth)
- Current annual tax
- $460 · $38/mo
- Projected year-2 tax
- $1,920 · $160/mo
- Expected delta
- +$1,460/yr (+$122/mo · 317.7%)
ⓘ Screening estimate from a state-policy table — verify with the county assessor before closing.
Climate risk First Street
- Flood 5/10 Major FEMA zone X (unshaded) · 65% chance over 30 yrs
- Wildfire 1/10 Low
- Heat 3/10 Moderate 7 d/yr ≥92°F today · 15 d/yr by 30 yrs out
- Wind 1/10 Low
- Air quality 4/10 Moderate 3 unhealthy d/yr today · 8 by 30 yrs out
Nearby sold comps map
Loading sold comps map…
Walkable amenities ~0.75 mi
Loading nearby amenities…
Taxation est. · year 1
- Rental income
- $28,512
- − Mortgage interest
- −$11,203
- − Property taxes
- −$460
- − Insurance
- −$1,000
- − Repairs & maintenance
- −$2,281
- − Management
- −$2,281
- − Depreciation
- −$5,818
- Taxable income
- $5,469
- Est. tax owed @ 24.0%
- −$1,313
- After-tax cash flow
- $7,166/yr
For passive investors: Depreciation is non-cash, so a rental often shows a tax loss while cash-flowing — sheltering income. Rental losses are passive: they offset passive income freely, and up to $25,000/yr can offset ordinary (W-2) income if you actively participate and your MAGI is under $100k (phasing out to $0 by $150k); unused losses carry forward. On sale, claimed depreciation is recaptured at up to 25%, and gains may owe capital-gains tax (a 1031 exchange can defer both). Figures are a year-1 estimate at your 24.0% rate — not tax advice; consult a CPA.
Schools (NCES district)
- District
- Buffalo City School District
- NCES district ID
- 3605850
- Math proficiency
- 41% ▲ 11.00%
- Reading proficiency
- 40% ▲ 7.00%
- Median HH income
- $31,665
- Composite
- 33.17/100
- National rank
- #5544
- State rank
- #535 of 590 in NY
Livability — Buffalo
- Score
- 77/100
- State rank
- #195
- US rank
- #3011
Category grades
Schools grade is shown separately in the Schools card above.
Census & demographics
- Census place
- Buffalo, NY
- County
- Erie County · 714,559 people
- City population
- 440,021
- Metro
- Buffalo-Cheektowaga, NY
- Population (ZIP)
- 24,428
- Household income
- $70,963
- Rent vs Own
- Severe rent burden
- 602.0
Population outlook (Erie County) Hauer SSP2
- Today (2025)
- 933,037 people
- By 2030
- 935,181 · +0.2%
- By 2040
- 928,531 · -0.5%
- By 2050
- 905,725 · -2.9%
- By 2075
- 834,037 · -10.6%
- By 2100
- 708,033 · -24.1%
Race, ethnicity, and origin ACS 2023
- Neighborhood character
- Predominantly White (76%)
- Race & ethnicity
- White 76% Hispanic / Latino 13% Two or more races 6% Black 5% Asian 2%
- Hispanic origin (detail)
- Puerto Rican 10% Cuban 1%
- Common ancestry
- Romanian 16% Lithuanian 1% Subsaharan African 1%
- Foreign-born
- 4% · Canada, Jamaica, China
- Languages at home
- 90% English-only · Spanish 4% Chinese 1%
Political lean MEDSL · Erie
- 2024 margin
- Lean D (+9.7) · D 54.8% · R 45.2%
- 2008→2024 swing
- -7.9pp toward R · 2008: 17.5pp · 2024: 9.7pp
- All cycles
- 2024: D+9.7 2020: D+14.7 2016: D+4.8 2012: D+15.6 2008: D+17.5
Not yet ingested
- Civics
- —
Market trends
- HPI YoY
- ▼ -146.29%
- Current HPI
- 402.5053
- Rent YoY
- ▲ 7.62%
- Metro
- Buffalo-Cheektowaga, NY
- State GDP YoY
- ▲ 2.60%
- F500 in state
- 92
Industry mix (Fortune 500 HQ in NY)
| Industry | F500 HQs | Revenue |
|---|---|---|
| Financial Services | 10 | $950B |
|
||
| Consumer Goods | 9 | $162B |
|
||
| Insurance | 4 | $225B |
|
||
| Telecommunications | 2 | $144B |
|
||
| Pharmaceuticals | 2 | $112B |
|
||
| Media / Entertainment | 2 | $69B |
|
||
Price history
-83.3% since first listed3 events — show timeline
- 2026-02-24 Listed $200,000 WNYREIS
- 2026-01-02 Listing Removed — WNYREIS
- 2025-07-05 Listed $1,200,000 WNYREIS
Property tax history
+4.8%/yrLatest (2025): $460 · +0.0% YoY. Source: county tax records.
Cash-flow waterfall
monthlySold comps — $/sqft
last 12 mo · ≤1 miLoading sold comps…