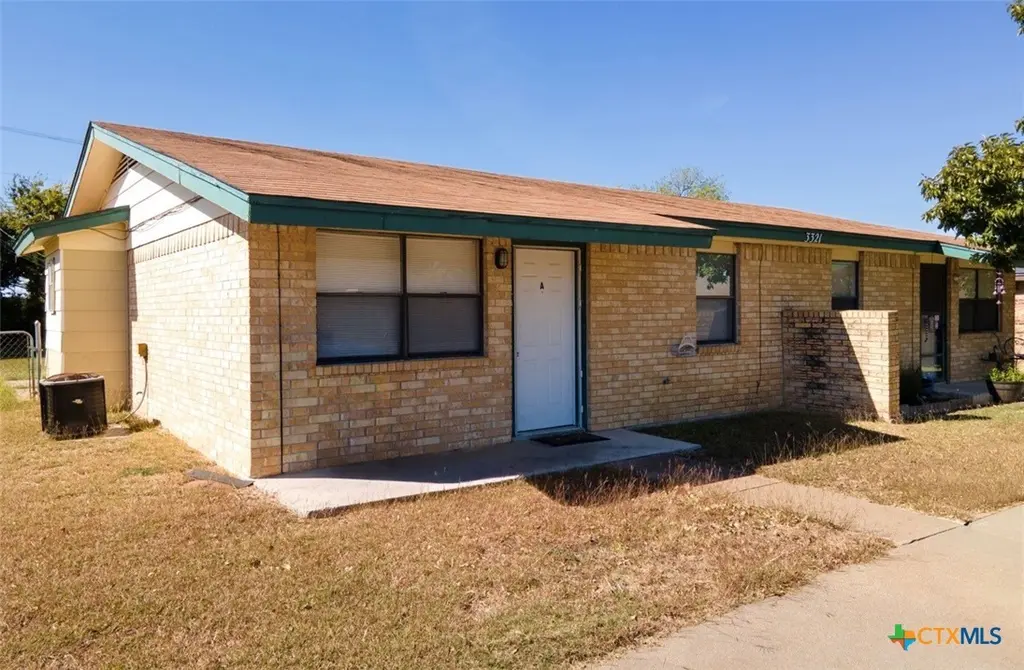
3321 Chisholm Trl · Killeen, TX
Flood risk 1/10 · Minimal
- FEMA flood zone
- X (unshaded)
- Chance of flooding over 30 yrs
- 0.0%
- Est. flood insurance / yr
- $507 – $1,088
Fire risk 3/10 · Minor
- Est. fire insurance / yr
- $1,222 – $2,270
Heat risk 8/10 · Major
- Hot days now (above 107°F)
- 7 days/yr
- Hot days in 30 yrs
- 24 days/yr
Wind risk 6/10 · Moderate
- Chance of severe wind over 30 yrs
- 61.0%
Air-quality risk 1/10 · Minimal
- Unhealthy air days now
- 0 days/yr
- Unhealthy air days in 30 yrs
- 0 days/yr
Risk factors via First Street. Map © Google.
Why this score? — see what drove the D- grade
The composite is a weighted blend of 9 inputs, each scored 0–100. Each bar is that input's sub-score; the figure is the points it added to the 100-point composite (weight × sub-score).
- Cash flow +12.4/30.0
- ARV discount +9.3/15.0
- DSCR +3.7/10.0
- 1% rule +3.5/10.0
- Livability +3.2/5.0
- Schools +3.0/10.0
- Condition / age +2.5/5.0
- Rent growth +2.0/5.0
- Appreciation +0.0/10.0
$193,750
🖨 Deal sheet (PDF) 📄 Offer letter ✓ Due diligence
Listing remarks MLS
Ideal Investment Opportunity! Four full duplexes featuring eight 2-bedroom, 1-bath units—each approximately 850 sq ft—located on a quiet, desirable street convenient to both Killeen and Harker Heights. Units include an attached 40 sq ft storage closet and large fenced backyards. Off street parking can accommodate up to 4 vehicles per unit. Perfect for an investor looking to grow their portfolio!
Key facts
- Off street parking
- Built 1986
- Listed 70 days
Tags
Neighborhood map
What this means for you Summary
Snapshot
- This is a 4-bed/1.0-bath townhouse listed at $194k.
Deal economics
- At list price, monthly cash flow is $-32 ($-379/yr) — negative.
- To cash-flow at today's rent, offer at most $188k (2.9% below list).
- To meet the 1% rule (rent ≥ 1% of price), the offer needs to be $166k (14.5% below list).
- Recommended offer: $166k (14.5% below list) — sets the bar for 1% rule.
- Cap rate 6.1% vs local median 3.9% in Killeen — top-decile yield for the area; either an underpriced asset or a hidden risk that comps aren't pricing in. Stress-test before assuming the spread holds.
Location & tenants
- Location reads 63/100 on livability (#853 in TX) — a middle-class / working-renter tenant base. Strengths: cost of living A+, housing A+; Watch: schools D+, amenities D, employment D.
- Killeen ISD (urban): math 31% / reading 38% proficiency, ranked #524 of 826 in TX (top 63%) — families likely to look elsewhere, expect single-tenant / working-renter base with shorter leases.
- Market conditions: Rents soft (-1.9%/yr); 644 active listings in the ZIP; 40 comparable units currently listed for rent nearby; rentals lingering (median 45d on market — plan ~5-8 weeks vacancy on turnover, expect pricing pressure); 58% of comp listings sitting > 30 days — soft ceiling on asking rent; 3,222 units permitted in Bell County in 2024 (246 in 5+ unit buildings).
Forward outlook
- Local home prices are declining (-3.0%/yr); year-one equity from $1k of loan paydown is wiped out by about $6k of value loss. Plan a longer hold.
- Bell County population projected at +21% by 2050 — long-run rental-demand tailwind backs the buy-and-hold thesis.
Negotiation context
- It's been on market 70 days — a 6% lower offer ($182k) is reasonable based on typical stale-listing flexibility.
- 3 sale attempts; this cycle's ask has dropped $31k (14%) from the opening price — seller is motivated, your offer sets the floor, not the list.
Risks & watch-outs
- Climate carrying-cost: major wind risk, 61% chance of damaging wind over 30y; extreme-heat days projected 7→24/yr by 2055 (HVAC capex compounding) — expect insurance premiums to compound above CPI over the hold.
Questions for the listing agent
- What do current leases actually rent for vs. the listed asking? Can we see a recent rent roll and the last 12 months of T-12 income?
- It's been on market 70 days. Have you received any prior offers? Is the seller open to a 15% concession, seller financing, or rate buy-down credit?
- Why hasn't it sold? Are there any deal-killer items the seller is aware of (foundation, flood, title, zoning, code violations)?
- Is there a deadline driving the sale (1031 exchange, divorce, estate, relocation)? That informs how much negotiation room exists.
- Schools are D-rated, which usually means shorter tenancies and higher turnover. Who's the typical renter profile here, and what's been the actual vacancy rate?
- Crime grade is D in this area — have there been break-ins, vandalism, or insurance claims at this property in the last 3 years? What carrier currently insures it and at what premium?
- The area grade is low — what's the realistic commute time and amenity access for the typical tenant pool here? Any planned neighborhood developments (good or bad) we should know about?
- What's the average days-on-market for RENTAL listings here right now (not sales)? A rising rental-DOM trend means longer vacancies and softer asking-rent achievability than the comps imply.
- What's the recent tenant-quality profile in this submarket — average credit score on applications, eviction rate, late-payment / NSF rate, and stable-employment percentage? A property-management company in the area should have these aggregated.
- How much new for-sale + rental construction is in the pipeline within 1–3 miles? Heavy new supply typically softens prices + rents 12–24 months out; constrained supply supports both.
Investment metrics
- 1% rule
- 0.85% ✗
- Cap rate
- 6.10%
- Cash-on-cash
- -0.70%
- DSCR
- 0.97
- GRM
- 9.8
CMA / ARV
- ARV (median comp)
- $201,669
- List price
- $193,750
- Delta
- -3.93%
- Verdict
- FAIR
- Comps
- 3 within 2.0 mi
Projected returns pro-forma
-3.0% appreciation · 0.0% rent growth · sell at horizon
- IRR
- -20.9%
- Equity multiple
- 0.30×
- Total profit
- $-38,234
- Equity at exit
- $28,889
- IRR
- -23.1%
- Equity multiple
- -0.01×
- Total profit
- $-54,533
- Equity at exit
- $16,752
Cash invested: $54,250 (down + closing). Projections, not guarantees.
Landlord ↔ Tenant lean methodology
- Overall (STATE)
- 87 Strongly Landlord-Friendly
- State Texas
- 87 Strongly Landlord-Friendly · R+5
- County
- — inherits STATE
- City
- — inherits STATE
ZIP-level market 76542
- Home prices YoY
- -21.7%
- Rents YoY
- -1.9%
- Active inventory
- 644
- Price-to-rent
- 9.8×
Monthly cashflow live
- Estimated rent
- $1,656 high interval (Pro) →
- Mortgage (P&I)
- −$1,016
- Tax from tax record
- −$243 /mo · $2,913/yr
- Insurance
- −$81
- HOA
- −$0
- Vacancy / Maint / Mgmt
- −$348
- Net cashflow
- $-32
Break-even live
Sensitivity live
| Price | -10% $78 | -5% $23 | +0% $-32 | +5% $-86 | +10% $-141 |
|---|---|---|---|---|---|
| Rent | -10% $-162 | -5% $-97 | +0% $-32 | +5% $34 | +10% $99 |
| Rate | -1.0pp $66 | -0.5pp $18 | base $-32 | +0.5pp $-82 | +1.0pp $-133 |
UW: 25.0% down · 7.5% · 30yr · 1.5% tax · 5.0% vac · 8.0% maint · 8.0% mgmt
Financing live
Cash to close
- Down payment
- $48,438
- Closing costs
- $5,812
- Reserves months
- —
- Total cash needed
- —
Loan-product check · same deal, 3 products live
Conventional
25% down · 7.5% · 30yr
- Down + closing
- —
- Monthly P&I
- —
- Monthly cashflow
- —
- DSCR
- —
- Eligible?
- —
Personal DTI + credit; lowest rate.
DSCR
20% down · 8.5% · 30yr
- Down + closing
- —
- Monthly P&I
- —
- Monthly cashflow
- —
- DSCR
- —
- Eligible?
- —
No personal income docs; deal must DSCR.
Hard money
10% down · 12.0% · 12mo
- Down + closing
- —
- Monthly P&I
- —
- Monthly cashflow
- —
- DSCR
- —
- Eligible?
- —
Short-term bridge; refi at stabilization.
Rent comps 40 comps
| Address | Beds | Baths | Sqft | Rent | $/sqft | DOM | Units | Dist |
|---|---|---|---|---|---|---|---|---|
| 3800 John Chisholm Loop Apt A Killeen, TX | 3.0 | 2.0 | 1309 | $1,250 | $0.95 | 24d | 1 | 0.12mi |
| 3701 Water Oak Dr Killeen, TX | 3.0 | 2.0 | 1542 | $1,595 | $1.03 | 45d | 1 | 0.28mi |
| 3713 Water Oak Dr Killeen, TX | 4.0 | 2.0 | 1357 | $1,645 | $1.21 | 24d | 1 | 0.32mi |
| 3923 Oak Valley Dr Killeen, TX | 4.0 | 2.0 | 1704 | $1,520 | $0.89 | 45d | 1 | 0.37mi |
| 3804 Water Oak Dr Killeen, TX | 3.0 | 2.5 | 1558 | $1,395 | $0.90 | 24d | 1 | 0.41mi |
| 4008 Sunflower Dr Killeen, TX | 3.0 | 2.5 | 1619 | $1,500 | $0.93 | 45d | 1 | 0.42mi |
| 4205 Pepper Mill Holw Killeen, TX | 4.0 | 2.0 | 1556 | $1,500 | $0.96 | 45d | 1 | 0.51mi |
| 4201 Sunflower Dr Killeen, TX | 4.0 | 2.5 | 1740 | $1,700 | $0.98 | 45d | 1 | 0.52mi |
| 4512 Indigo Dr Killeen, TX | 3.0 | 2.0 | 1416 | $1,595 | $1.13 | 24d | 1 | 0.56mi |
| 4207 Indigo Dr Killeen, TX | 3.0 | 2.5 | 1701 | $1,595 | $0.94 | 45d | 1 | 0.59mi |
| 3806 Lone Oak Dr Killeen, TX | 3.0 | 2.0 | 1332 | $1,299 | $0.98 | 24d | 1 | 0.60mi |
| 4205 Bluestem Ln Killeen, TX | 3.0 | 2.0 | 1319 | $1,600 | $1.21 | 45d | 1 | 0.62mi |
| 3809 Oak Valley Dr Killeen, TX | 3.0 | 2.0 | 1437 | $1,395 | $0.97 | 24d | 1 | 0.62mi |
| 3819 Oak Valley Dr Killeen, TX | 3.0 | 2.5 | 1402 | $1,300 | $0.93 | 45d | 1 | 0.65mi |
| 4303 Rainlily St Killeen, TX | 4.0 | 2.5 | 2129 | $2,200 | $1.03 | 15d | 1 | 0.67mi |
| 3901 Crosscut Loop Killeen, TX | 3.0 | 2.0 | 1490 | $1,500 | $1.01 | 45d | 1 | 0.70mi |
| 2601 Little Nolan Rd Killeen, TX | 3.0 | 2.0 | 1336 | $1,325 | $0.99 | 45d | 1 | 0.73mi |
| 4802 Pepper Mill Holw Killeen, TX | 3.0 | 2.0 | 1394 | $1,395 | $1.00 | 45d | 1 | 0.73mi |
| 4716 Glass Mountain Dr Killeen, TX | 3.0 | 2.0 | 1480 | $1,545 | $1.04 | 15d | 1 | 0.74mi |
| 4208 Frontier Trl Killeen, TX | 3.0 | 2.0 | 1700 | $1,450 | $0.85 | 45d | 1 | 0.76mi |
| 4212 Embers Dr Killeen, TX | 4.0 | 2.0 | 1848 | $1,650 | $0.89 | 45d | 1 | 0.79mi |
| 4807 Teal Dr Killeen, TX | 3.0 | 2.0 | 1421 | $1,495 | $1.05 | 45d | 1 | 0.80mi |
| 4806 Greenlee Dr Killeen, TX | 3.0 | 2.5 | 1620 | $1,400 | $0.86 | 45d | 1 | 0.80mi |
| 4103 Shagbark Dr Killeen, TX | 3.0 | 2.5 | 1776 | $1,645 | $0.93 | 45d | 1 | 0.80mi |
| 3109 Rampart Loop Killeen, TX | 3.0 | 2.0 | 1432 | $1,415 | $0.99 | 24d | 1 | 0.81mi |
| 4209 Adobe Dr Killeen, TX | 3.0 | 2.0 | 1407 | $1,450 | $1.03 | 24d | 1 | 0.84mi |
| 4704 Champion Dr Killeen, TX | 3.0 | 2.0 | 1298 | $1,450 | $1.12 | 45d | 1 | 0.86mi |
| 5006 Morning Star Ln Killeen, TX | 4.0 | 2.0 | 1611 | $1,695 | $1.05 | 24d | 1 | 0.88mi |
| 4305 Rifle Dr Killeen, TX | 3.0 | 2.0 | 1646 | $1,695 | $1.03 | 45d | 1 | 0.90mi |
| 5107 Daybreak Dr Killeen, TX | 3.0 | 2.0 | 2301 | $1,175 | $0.51 | 24d | 1 | 0.95mi |
| 4303 Fawn Dr Killeen, TX | 4.0 | 2.0 | 1570 | $1,595 | $1.02 | 24d | 1 | 0.95mi |
| 5005 Shawn Dr Killeen, TX | 3.0 | 2.0 | 1530 | $1,400 | $0.92 | 45d | 1 | 0.98mi |
| 4108 Fawn Dr Killeen, TX | 3.0 | 2.0 | 1341 | $1,275 | $0.95 | 45d | 1 | 1.03mi |
| 5010 White Rock Dr Killeen, TX | 3.0 | 2.5 | 2249 | $1,600 | $0.71 | 45d | 1 | 1.04mi |
| 4210 Telluride Dr Killeen, TX | 4.0 | 2.0 | 1571 | $2,249 | $1.43 | 45d | 1 | 1.04mi |
| 4705 Fawn Dr Killeen, TX | 3.0 | 2.0 | 1371 | $1,395 | $1.02 | 15d | 1 | 1.06mi |
| 4209 Breckenridge Dr Killeen, TX | 3.0 | 2.0 | 1230 | $1,400 | $1.14 | 45d | 1 | 1.06mi |
| 1900 Elms Run Ct Unit B Killeen, TX | 3.0 | 2.0 | 1450 | $2,100 | $1.45 | 15d | 1 | 1.07mi |
| 2802 Scottsdale Dr Killeen, TX | 3.0 | 2.5 | 2583 | $2,200 | $0.85 | 15d | 1 | 1.07mi |
| 5117 Teal Dr Killeen, TX | 3.0 | 2.0 | 1626 | $1,450 | $0.89 | 24d | 1 | 1.08mi |
Listing history 21 events
-
2026-06-18days on market $193,750 Active 70 DOM
-
2026-06-17days on market $193,750 Active 69 DOM
-
2026-06-16days on market $193,750 Active 68 DOM
-
2026-06-15days on market $193,750 Active 67 DOM
-
2026-06-14days on market $193,750 Active 65 DOM
-
2026-06-13days on market $193,750 Active 64 DOM
-
2026-06-10days on market $193,750 Active 62 DOM
-
2026-06-09days on market $193,750 Active 61 DOM
-
2026-06-08days on market $193,750 Active 60 DOM
-
2026-06-07days on market $193,750 Active 59 DOM
-
2026-06-03days on market $193,750 Active 55 DOM
-
2026-06-02days on market $193,750 Active 54 DOM
-
2026-06-01days on market $193,750 Active 53 DOM
-
2026-05-31days on market $193,750 Active 52 DOM
-
2026-05-30days on market $193,750 Active 51 DOM
-
2026-04-23price $850,000 410-char remark
Show marketing remark (410 chars)
Ideal Investment Opportunity! Four full duplexes featuring eight 2-bedroom, 1-bath units—each approximately 850 sq ft—located on a quiet, desirable street convenient to both Killeen and Harker Heights. Units include an attached 40 sq ft storage closet and large fenced backyards. Off street parking can accommodate up to 4 vehicles per unit. Perfect for an investor looking to grow their portfolio!
-
2026-04-09$224,500 Active 384-char remark
Show marketing remark (384 chars)
Ideal Investment Opportunity! Duplex featuring two- 2-bedroom, 1-bath units each approximately 850 sq ft-located on a quiet, desirable street convenient to both Killeen and Harker Heights. Units include an attached 40 sq ft storage closet and large fenced backyard. Off street parking can accommodate up to 4 vehicles per unit. Perfect for an investor looking to grow their portfolio!
-
2026-04-01historical
-
2025-11-12price $890,000 410-char remark
Show marketing remark (410 chars)
Ideal Investment Opportunity! Four full duplexes featuring eight 2-bedroom, 1-bath units—each approximately 850 sq ft—located on a quiet, desirable street convenient to both Killeen and Harker Heights. Units include an attached 40 sq ft storage closet and large fenced backyards. Off street parking can accommodate up to 4 vehicles per unit. Perfect for an investor looking to grow their portfolio!
-
2025-11-12$800,000 Active 410-char remark
Show marketing remark (410 chars)
Ideal Investment Opportunity! Four full duplexes featuring eight 2-bedroom, 1-bath units—each approximately 850 sq ft—located on a quiet, desirable street convenient to both Killeen and Harker Heights. Units include an attached 40 sq ft storage closet and large fenced backyards. Off street parking can accommodate up to 4 vehicles per unit. Perfect for an investor looking to grow their portfolio!
-
2025-11-12$225,000 Active
Show marketing remark (410 chars)
Ideal Investment Opportunity! Four full duplexes featuring eight 2-bedroom, 1-bath units—each approximately 850 sq ft—located on a quiet, desirable street convenient to both Killeen and Harker Heights. Units include an attached 40 sq ft storage closet and large fenced backyards. Off street parking can accommodate up to 4 vehicles per unit. Perfect for an investor looking to grow their portfolio!
ⓘ Source: listings_history table (triggers on properties + properties_extension) + one-shot
backfill from property_details.listing_events for pre-trigger history.
Tax reassessment forecast TX · Resets to sale price
- Current annual tax
- $2,913 · $243/mo
- Projected year-2 tax
- $3,546 · $295/mo
- Expected delta
- +$632/yr (+$53/mo · 21.7%)
ⓘ Screening estimate from a state-policy table — verify with the county assessor before closing.
Climate risk First Street
- Flood 1/10 Low FEMA zone X (unshaded) · 0% chance over 30 yrs
- Wildfire 3/10 Moderate
- Heat 8/10 Severe 7 d/yr ≥107°F today · 24 d/yr by 30 yrs out
- Wind 6/10 Major 61% chance of damaging wind over 30 yrs
- Air quality 1/10 Low 0 unhealthy d/yr today · 0 by 30 yrs out
Nearby sold comps map
Loading sold comps map…
Walkable amenities ~0.75 mi
Loading nearby amenities…
Taxation est. · year 1
- Rental income
- $19,868
- − Mortgage interest
- −$10,853
- − Property taxes
- −$2,913
- − Insurance
- −$969
- − Repairs & maintenance
- −$1,589
- − Management
- −$1,589
- − Depreciation
- −$5,636
- Taxable loss
- −$3,683
- Est. tax savings @ 24.0%
- +$884
- After-tax cash flow
- $505/yr
For passive investors: Depreciation is non-cash, so a rental often shows a tax loss while cash-flowing — sheltering income. Rental losses are passive: they offset passive income freely, and up to $25,000/yr can offset ordinary (W-2) income if you actively participate and your MAGI is under $100k (phasing out to $0 by $150k); unused losses carry forward. On sale, claimed depreciation is recaptured at up to 25%, and gains may owe capital-gains tax (a 1031 exchange can defer both). Figures are a year-1 estimate at your 24.0% rate — not tax advice; consult a CPA.
Schools (NCES district)
- District
- Killeen ISD
- NCES district ID
- 4825660
- Math proficiency
- 31% ▼ -16.00%
- Reading proficiency
- 38% ▼ -3.00%
- Median HH income
- $47,665
- Composite
- 29.69/100
- National rank
- #6458
- State rank
- #524 of 826 in TX
Livability — Killeen
- Score
- 63/100
- State rank
- #853
- US rank
- #15359
Category grades
Schools grade is shown separately in the Schools card above.
Census & demographics
- Census place
- Killeen, TX
- County
- Bell County · 345,090 people
- City population
- 163,398
- Metro
- Killeen-Temple, TX
- Population (ZIP)
- 53,892
- Household income
- $74,055
- Rent vs Own
- Severe rent burden
- 1167.0
Population outlook (Bell County) Hauer SSP2
- Today (2025)
- 371,114 people
- By 2030
- 389,104 · +4.8%
- By 2040
- 420,592 · +13.3%
- By 2050
- 447,779 · +20.7%
- By 2075
- 499,130 · +34.5%
- By 2100
- 505,680 · +36.3%
Race, ethnicity, and origin ACS 2023
- Neighborhood character
- Highly diverse neighborhood (Simpson 0.74)
- Race & ethnicity
- Black 34% White 27% Hispanic / Latino 26% Two or more races 17% Asian 5%
- Hispanic origin (detail)
- Mexican 13% Puerto Rican 9%
- Common ancestry
- Italian 1% Lithuanian 1% Slovak 1%
- Foreign-born
- 10% · Canada, South Korea, Vietnam
- Languages at home
- 79% English-only · Spanish 15% Korean 1% German/W. Germanic 1%
Political lean MEDSL · Bell
- 2024 margin
- R (+16.2) · D 41.3% · R 57.6% · Other 1.1%
- 2008→2024 swing
- -6.5pp toward R · 2008: -9.8pp · 2024: -16.2pp
- All cycles
- 2024: R+16.2 2020: R+8.5 2016: R+15.1 2012: R+16.4 2008: R+9.8
Not yet ingested
- Civics
- —
Market trends
- HPI YoY
- ▼ -43.94%
- Current HPI
- 158.4385
- Rent YoY
- ▼ -1.85%
- Metro
- Killeen-Temple, TX
- State GDP YoY
- ▲ 3.95%
- F500 in state
- 110
Industry mix (Fortune 500 HQ in TX)
| Industry | F500 HQs | Revenue |
|---|---|---|
| Energy | 16 | $1,198B |
|
||
| Technology | 5 | $198B |
|
||
| Engineering / Construction | 4 | $72B |
|
||
| Energy Services | 3 | $60B |
|
||
| Utilities | 3 | $41B |
|
||
| Healthcare | 2 | $330B |
|
||
Price history
+6.2% since first listed6 events — show timeline
- 2026-04-23 Price Changed $850,000 CTXMLS
- 2026-04-09 Listed $224,500 CTXMLS
- 2026-04-01 Listing Removed — CTXMLS
- 2025-11-12 Price Changed $890,000 CTXMLS
- 2025-11-12 Listed $225,000 CTXMLS
- 2025-11-12 Listed $800,000 CTXMLS
Property tax history
+5.9%/yrLatest (2025): $2,913 · -14.6% YoY. Source: county tax records.
Cash-flow waterfall
monthlySold comps — $/sqft
last 12 mo · ≤1 miLoading sold comps…