 🏷️ Likely Rental
303 Gage Blvd #227 · Richland, WA
Flood risk 1/10 · Minimal
- FEMA flood zone
- X
- Chance of flooding over 30 yrs
- 0.0%
- Est. flood insurance / yr
- $507 – $1,088
Fire risk 4/10 · Minor
- Est. fire insurance / yr
- $604 – $1,122
Heat risk 5/10 · Moderate
- Hot days now (above 98°F)
- 7 days/yr
- Hot days in 30 yrs
- 14 days/yr
Wind risk 1/10 · Minimal
- Chance of severe wind over 30 yrs
- —
Air-quality risk 9/10 · Severe
- Unhealthy air days now
- 13 days/yr
- Unhealthy air days in 30 yrs
- 14 days/yr
Risk factors via First Street. Map © Google.
Why this score? — see what drove the D+ grade
The composite is a weighted blend of 9 inputs, each scored 0–100. Each bar is that input's sub-score; the figure is the points it added to the 100-point composite (weight × sub-score).
- Cash flow +15.0/30.0
- ARV discount +7.5/15.0
- Schools +5.3/10.0
- 1% rule +5.0/10.0
- DSCR +5.0/10.0
- Livability +4.0/5.0
- Rent growth +2.9/5.0
- Condition / age +2.5/5.0
- Appreciation +0.0/10.0
$1,400
🖨 Deal sheet (PDF) 📄 Offer letter ✓ Due diligence
Listing remarks
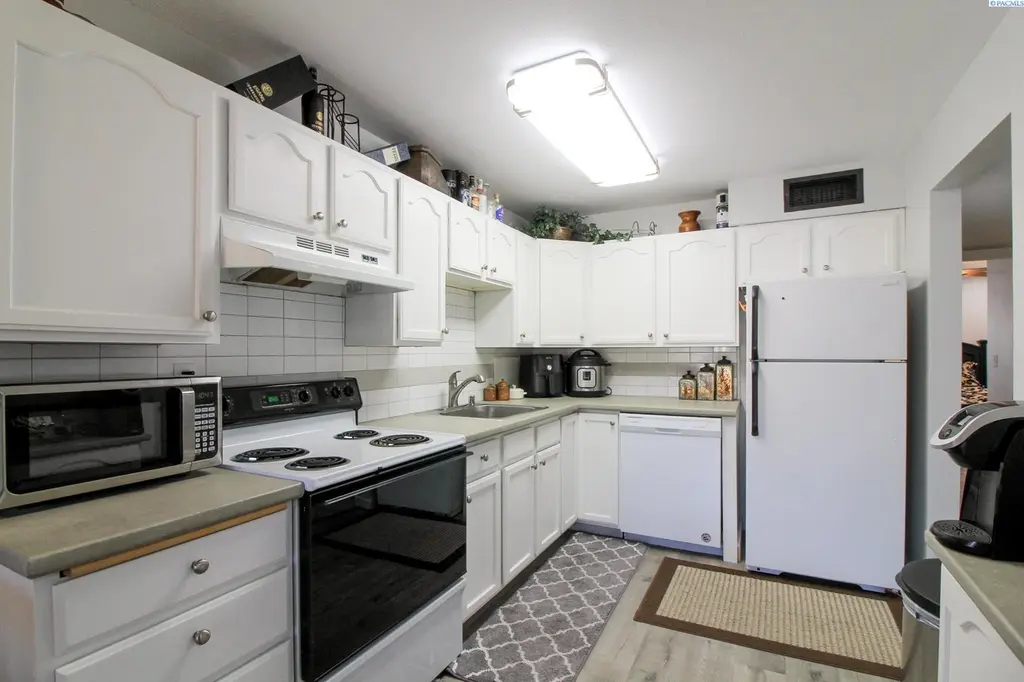
We do not accept 3rd party applications or viewing requests. 1 Bedroom, 1 Bath 704 sqft Apartment in Richland Fully furnished 1 bedroom, 1-bathroom upstairs unit in a convenient Richland apartment community! Thoughtfully equipped with furniture, linens, and kitchen essentials, this home is move-in ready and perfect for comfortable everyday living or a flexible temporary stay. Inside, the bright living space features oversized windows that bring in abundant natural light, along with a cozy wood-burning fireplace for added charm. The kitchen offers generous cabinet and counter space, plus a dishwasher to make cleanup easy. The spacious bedroom includes a queen-sized bed, and central heat and
Key facts
- Private deck
- Storage closet
- Built 1979
Tags
Property features AI
Exterior
- Parking: No garage
- Home design: One-story residence; One level
- Construction: New construction
- Exterior features: Condominium property; Located in a subdivision listed as OTHER; Zoned single family residential
Interior
- Bathrooms: One full bathroom
- Interior features: No basement
Neighborhood map
What this means for you Summary
Snapshot
- This is a 1-bed/1.0-bath condo listed at $1k.
Deal economics
- At list price, monthly cash flow is $1k ($13k/yr) — positive.
- The deal already cash-flows at list — no discount required.
- Meets the 1% rule at list price ($1k rent vs $1k).
- Recommended offer: $1k (3.0% below list) — sets the bar for market timing.
- Cap rate 925.5% vs local median 2.8% in Richland — top-decile yield for the area; either an underpriced asset or a hidden risk that comps aren't pricing in. Stress-test before assuming the spread holds.
Location & tenants
- Location reads 79/100 on livability (#112 in WA, #2,258 nationally) — a middle-class / working-renter tenant base. Strengths: commute A+, housing A+, health & safety A+; Watch: cost of living C-, amenities F.
- Richland School District (urban): math 52% / reading 64% proficiency, ranked #61 of 291 in WA (top 21%) — acceptable for families but not a draw, mixed tenant base, ~2y average lease.
- Zoned schools: Badger Mountain Elementary (569 students, 39% FRL); Carmichael Middle School (807 students, 55% FRL); Richland High School (2,137 students, 38% FRL) — zoned schools average 44% FRL vs 29% district-wide (16 pts higher); higher-poverty schools than district average — tighter screening recommended.
- Market conditions: Rents rising (+1.6%/yr); 576 active listings in the ZIP; 2 comparable units currently listed for rent nearby; solid renter incomes; 1,532 units permitted in Benton County in 2024 (389 in 5+ unit buildings).
- This rent is only 16% of the median local income ($100k/yr) — well below the 30% rent-burden line; pricing power to push rent on renewal without tenant pushback.
Forward outlook
- Local home prices are declining (-3.0%/yr); year-one equity from $10 of loan paydown is wiped out by about $42 of value loss. Plan a longer hold.
- Benton County population projected at +32% by 2050 — long-run rental-demand tailwind backs the buy-and-hold thesis.
- At projected returns (-3.0% appreciation + 1.6% rent growth), your $392 cash investment doubles in ~1 year — after that, you're playing with house money.
Negotiation context
- It's been on market 46 days — a 3% lower offer ($1k) is reasonable based on typical stale-listing flexibility.
Risks & watch-outs
- Climate carrying-cost: extreme-heat days projected 7→14/yr by 2055 (HVAC capex compounding) — expect insurance premiums to compound above CPI over the hold.
Questions for the listing agent
- It's been on market 46 days. Have you received any prior offers? Is the seller open to a 3% concession, seller financing, or rate buy-down credit?
- Built in 1979 — when were the roof, HVAC, electrical panel, plumbing, and water heater last replaced?
- Any open or pending special assessments — roof, HVAC, plumbing, elevator, façade? What's the per-unit balance and payoff schedule, and is the seller paying it off at close or rolling it to the buyer?
- Is there a deadline driving the sale (1031 exchange, divorce, estate, relocation)? That informs how much negotiation room exists.
- Schools are A-rated — typically a magnet for longer-tenancy family renters. What's the average tenant stay here, and is there a school-zone premium baked into asking?
- The area grade is low — what's the realistic commute time and amenity access for the typical tenant pool here? Any planned neighborhood developments (good or bad) we should know about?
- What's the average days-on-market for RENTAL listings here right now (not sales)? A rising rental-DOM trend means longer vacancies and softer asking-rent achievability than the comps imply.
- What's the recent tenant-quality profile in this submarket — average credit score on applications, eviction rate, late-payment / NSF rate, and stable-employment percentage? A property-management company in the area should have these aggregated.
- How much new apartment / multifamily construction is in the pipeline within 1–3 miles? Heavy new supply (>2% of stock underway) typically softens rents 12–24 months out; light construction supports rent growth.
Investment metrics
- 1% rule
- 97.83% ✓
- Cap rate
- 925.47%
- Cash-on-cash
- 3282.77%
- DSCR
- 147.06
- GRM
- 0.1
CMA / ARV
- ARV (median comp)
- $191,802
- List price
- $1,400
- Delta
- -99.27%
- Verdict
- UNDERPRICED
- Comps
- 8 within 1.0 mi
Projected returns pro-forma
-3.0% appreciation · 1.6% rent growth · sell at horizon
- IRR
- —
- Equity multiple
- 169.85×
- Total profit
- $66,191
- Equity at exit
- $209
- IRR
- —
- Equity multiple
- 353.24×
- Total profit
- $138,077
- Equity at exit
- $121
Cash invested: $392 (down + closing). Projections, not guarantees.
Landlord ↔ Tenant lean methodology
- Overall (STATE)
- 28 Tenant-Leaning
- State Washington
- 28 Tenant-Leaning · D+8
- County
- — inherits STATE
- City
- — inherits STATE
ZIP-level market 99352
- Rents YoY
- 1.6%
- Active inventory
- 576
- Price-to-rent
- 0.1×
Monthly cashflow live
- Estimated rent
- $1,370 medium interval (Pro) →
- Mortgage (P&I)
- −$7
- Tax est. 1.5%
- −$2 /mo · $21/yr
- Insurance
- −$1
- HOA
- −$0
- Lot rent
- −$0
- Vacancy / Maint / Mgmt
- −$288
- Net cashflow
- $1,072
Break-even live
Sensitivity live
| Price | -10% $1,073 | -5% $1,073 | +0% $1,072 | +5% $1,072 | +10% $1,071 |
|---|---|---|---|---|---|
| Rent | -10% $964 | -5% $1,018 | +0% $1,072 | +5% $1,126 | +10% $1,181 |
| Rate | -1.0pp $1,073 | -0.5pp $1,073 | base $1,072 | +0.5pp $1,072 | +1.0pp $1,072 |
UW: 25.0% down · 7.5% · 30yr · 1.5% tax · 5.0% vac · 8.0% maint · 8.0% mgmt
Financing live
Cash to close
- Down payment
- $350
- Closing costs
- $42
- Reserves months
- —
- Total cash needed
- —
Loan-product check · same deal, 3 products live
Conventional
25% down · 7.5% · 30yr
- Down + closing
- —
- Monthly P&I
- —
- Monthly cashflow
- —
- DSCR
- —
- Eligible?
- —
Personal DTI + credit; lowest rate.
DSCR
20% down · 8.5% · 30yr
- Down + closing
- —
- Monthly P&I
- —
- Monthly cashflow
- —
- DSCR
- —
- Eligible?
- —
No personal income docs; deal must DSCR.
Hard money
10% down · 12.0% · 12mo
- Down + closing
- —
- Monthly P&I
- —
- Monthly cashflow
- —
- DSCR
- —
- Eligible?
- —
Short-term bridge; refi at stabilization.
Rent comps 2 comps
| Address | Beds | Baths | Sqft | Rent | $/sqft | DOM | Units | Dist |
|---|---|---|---|---|---|---|---|---|
| 250 Gage Blvd Richland, WA | 1.0–3.0 | 1.0–2.0 | 1012 | $1,375 | $1.36 | 16d | 10 | 0.15mi |
| 1950 Bellerive Dr Richland, WA | 2.0 | 1.0 | 710 | $1,058 | $1.49 | 16d | 5 | 0.46mi |
HOA detail condo
- Monthly dues
- $0 · $0/yr
- Assessments
- None detected in remarks — confirm with the listing agent.
Listing history 21 events
-
2026-06-23days on market $1,400 Active 46 DOM
-
2026-06-22days on market $1,400 Active 45 DOM
-
2026-06-18days on market $1,400 Active 42 DOM
-
2026-06-17days on market $1,400 Active 41 DOM
-
2026-06-16days on market $1,400 Active 40 DOM
-
2026-06-15days on market $1,400 Active 39 DOM
-
2026-06-14days on market $1,400 Active 37 DOM
-
2026-06-13days on market $1,400 Active 36 DOM
-
2026-06-10days on market $1,400 Active 34 DOM
-
2026-06-09days on market $1,400 Active 33 DOM
-
2026-06-08days on market $1,400 Active 32 DOM
-
2026-06-07days on market $1,400 Active 31 DOM
-
2026-06-05days on market $1,400 Active 28 DOM
-
2026-06-03days on market $1,400 Active 27 DOM
-
2026-06-02days on market $1,400 Active 26 DOM
-
2026-06-01days on market $1,400 Active 25 DOM
-
2026-05-31days on market $1,400 Active 24 DOM
-
2026-05-30days on market $1,400 Active 23 DOM
-
2026-05-07$1,400 Active 1901-char remark
-
2021-03-23soldstatus $149,900
-
2003-11-07soldstatus $51,000
ⓘ Source: listings_history table (triggers on properties + properties_extension) + one-shot
backfill from property_details.listing_events for pre-trigger history.
Climate risk First Street
- Flood 1/10 Low FEMA zone X · 0% chance over 30 yrs
- Wildfire 4/10 Moderate
- Heat 5/10 Major 7 d/yr ≥98°F today · 14 d/yr by 30 yrs out
- Wind 1/10 Low
- Air quality 9/10 Extreme 13 unhealthy d/yr today · 14 by 30 yrs out
Nearby sold comps map
Loading sold comps map…
Walkable amenities ~0.75 mi
Loading nearby amenities…
Taxation est. · year 1
- Rental income
- $16,436
- − Mortgage interest
- −$78
- − Property taxes
- −$21
- − Insurance
- −$7
- − Repairs & maintenance
- −$1,315
- − Management
- −$1,315
- − Depreciation
- −$41
- Taxable income
- $13,659
- Est. tax owed @ 24.0%
- −$3,278
- After-tax cash flow
- $9,590/yr
For passive investors: Depreciation is non-cash, so a rental often shows a tax loss while cash-flowing — sheltering income. Rental losses are passive: they offset passive income freely, and up to $25,000/yr can offset ordinary (W-2) income if you actively participate and your MAGI is under $100k (phasing out to $0 by $150k); unused losses carry forward. On sale, claimed depreciation is recaptured at up to 25%, and gains may owe capital-gains tax (a 1031 exchange can defer both). Figures are a year-1 estimate at your 24.0% rate — not tax advice; consult a CPA.
Schools (NCES district)
- District
- Richland School District
- NCES district ID
- 5307320
- Math proficiency
- 52% ▬ 0.00%
- Reading proficiency
- 64% ▼ -1.00%
- Median HH income
- $70,475
- Composite
- 53.04/100
- National rank
- #3244
- State rank
- #61 of 291 in WA
Livability — Richland
- Score
- 79/100
- State rank
- #112
- US rank
- #2258
Category grades
Schools grade is shown separately in the Schools card above.
Census & demographics
- Census place
- Richland, WA
- County
- Benton County · 186,895 people
- City population
- 62,989
- Metro
- Kennewick-Richland, WA
- Population (ZIP)
- 37,430
- Household income
- $100,108
- Rent vs Own
- Severe rent burden
- 983.0
Population outlook (Benton County) Hauer SSP2
- Today (2025)
- 219,421 people
- By 2030
- 233,813 · +6.6%
- By 2040
- 262,134 · +19.5%
- By 2050
- 290,100 · +32.2%
- By 2075
- 363,525 · +65.7%
- By 2100
- 418,667 · +90.8%
Race, ethnicity, and origin ACS 2023
- Neighborhood character
- Predominantly White (73%)
- Race & ethnicity
- White 73% Hispanic / Latino 14% Two or more races 10% Asian 7% Black 2%
- Hispanic origin (detail)
- Mexican 11%
- Common ancestry
- Italian 4% Portuguese 4% Slovak 3%
- Foreign-born
- 9% · Canada, South Korea, China
- Languages at home
- 88% English-only · Spanish 4% Other Indo-European 3% Korean 1%
Political lean MEDSL · Benton
- 2024 margin
- Strong R (+21.9) · D 37.7% · R 59.6% · Other 2.7%
- 2008→2024 swing
- +4.2pp toward D · 2008: -26.1pp · 2024: -21.9pp
- All cycles
- 2024: R+21.9 2020: R+21.0 2016: R+26.6 2012: R+27.0 2008: R+26.1
Not yet ingested
- Civics
- —
Market trends
- HPI YoY
- ▼ -323.81%
- Current HPI
- 217.3435
- Rent YoY
- ▲ 1.60%
- Metro
- Kennewick-Richland, WA
- State GDP YoY
- ▲ 4.65%
- F500 in state
- 22
Industry mix (Fortune 500 HQ in WA)
| Industry | F500 HQs | Revenue |
|---|---|---|
| Retail | 2 | $269B |
|
||
| Technology / Retail | 1 | $638B |
|
||
| Technology | 1 | $245B |
|
||
| Telecommunications | 1 | $38B |
|
||
| Food / Beverage | 1 | $36B |
|
||
| Automotive / Trucks | 1 | $34B |
|
||
Price history
-97.3% since first listed3 events — show timeline
- 2026-05-07 Listed $1,400 PACMLS
- 2021-03-23 Sold (Public Records) $149,900 Public Records
- 2003-11-07 Sold (Public Records) $51,000 Public Records
Property tax history
+6.3%/yrLatest (2026): $1,596 · -2.4% YoY. Source: county tax records.
Cash-flow waterfall
monthlySold comps — $/sqft
last 12 mo · ≤1 miLoading sold comps…