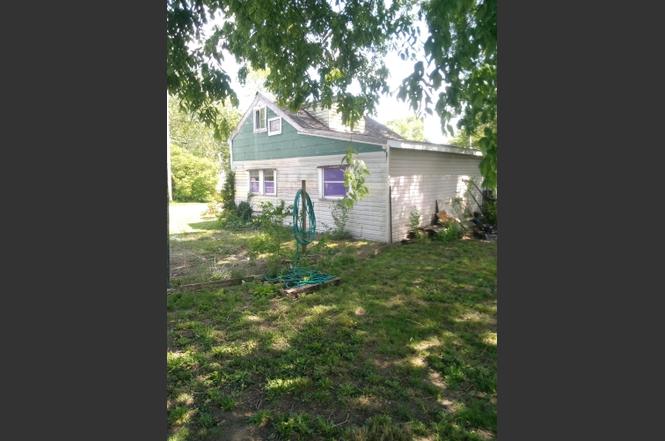
405 Hedges St · Ashville, OH
Flood risk 1/10 · Minimal
- FEMA flood zone
- X (unshaded)
- Chance of flooding over 30 yrs
- 0.0%
- Est. flood insurance / yr
- $507 – $1,088
Fire risk 1/10 · Minimal
- Est. fire insurance / yr
- $713 – $1,323
Heat risk 4/10 · Minor
- Hot days now (above 101°F)
- 7 days/yr
- Hot days in 30 yrs
- 18 days/yr
Wind risk 2/10 · Minimal
- Chance of severe wind over 30 yrs
- 1.0%
Air-quality risk 2/10 · Minimal
- Unhealthy air days now
- 1 days/yr
- Unhealthy air days in 30 yrs
- 2 days/yr
Risk factors via First Street. Map © Google.
Why this score? — see what drove the B grade
The composite is a weighted blend of 9 inputs, each scored 0–100. Each bar is that input's sub-score; the figure is the points it added to the 100-point composite (weight × sub-score).
- Cash flow +30.0/30.0
- 1% rule +10.0/10.0
- DSCR +10.0/10.0
- ARV discount +7.5/15.0
- Schools +5.8/10.0
- Livability +3.8/5.0
- Rent growth +2.5/5.0
- Condition / age +1.5/5.0
- Appreciation +0.0/10.0
$69,500
🖨 Deal sheet 📄 Offer letter ✓ Due diligence
Listing remarks
Opportunity awaits with this 616 sq ft 1-bedroom 1-bath home, featuring a versatile loft and all utilities in place, gas, electric, sewage and water. Whether you are looking for your next renovation project, investment or the perfect site to reimagine and rebuild, this property offers a ready to go foundation with solid 10' oak beams. This property is a blank canvas ready for transformation. Being sold As Is
Key facts
- 8,712 sq ft lot
- Built 1900
- Listed 95 days
Property features AI
Finance
- Other: Lot size approximately 0.2 acres
Exterior
- Utilities: Public water; Public sewer
- Home design: Single family residence; One and one half stories; No common walls; Built in 1900
- Construction: Stone foundation; Built in 1900; 1288 total building area (source: Realist)
- Exterior features: Stone and other foundation
Interior
- Bedrooms: One main-level bedroom
- Flooring: Other flooring
- Bathrooms: One full bathroom
- Heating & cooling: Has heating
- Interior features: Storm-part windows; No fireplaces
Neighborhood map
What this means for you Summary
Snapshot
- This is a 1-bed/1.0-bath single-family listed at $70k. Condition is rated poor.
Deal economics
- At list price, monthly cash flow is $376 ($5k/yr) — positive.
- The deal already cash-flows at list — no discount required.
- Meets the 1% rule at list price ($1k rent vs $70k).
- Recommended offer: $63k (9.0% below list) — sets the bar for market timing.
- Cap rate 12.8% vs local median 4.2% in Ashville — top-decile yield for the area; either an underpriced asset or a hidden risk that comps aren't pricing in. Stress-test before assuming the spread holds.
Location & tenants
- Location reads 76/100 on livability (#212 in OH, #3,315 nationally) — a middle-class / working-renter tenant base. Strengths: schools A+, crime A+, cost of living A+; Watch: amenities F, commute F.
- Teays Valley Local (town): math 66% / reading 68% proficiency, ranked #166 of 656 in OH (top 25%) — acceptable for families but not a draw, mixed tenant base, ~2y average lease.
- Market conditions: 169 active listings in the ZIP; solid renter incomes; 312 units permitted in Pickaway County in 2024 (0 in 5+ unit buildings).
- This rent is only 15% of the median local income ($84k/yr) — well below the 30% rent-burden line; pricing power to push rent on renewal without tenant pushback.
Forward outlook
- Local home prices are declining (-3.0%/yr); year-one equity from $481 of loan paydown is wiped out by about $2k of value loss. Plan a longer hold.
- Pickaway County population projected at +3% by 2050 — modest demand growth; plan on rents tracking national, not racing it.
- At projected returns (-3.0% appreciation + 3.0% rent growth), your $19k cash investment doubles in ~6 years — after that, you're playing with house money.
Negotiation context
- It's been on market 95 days — a 9% lower offer ($63k) is reasonable based on typical stale-listing flexibility.
Risks & watch-outs
- Watch-outs: built in 1900 — expect roof / HVAC / electrical / plumbing capex.
Questions for the listing agent
- It's been on market 95 days. Have you received any prior offers? Is the seller open to a 9% concession, seller financing, or rate buy-down credit?
- Have any recent inspections been done? Can we get a copy of the seller's disclosures and any deferred-maintenance estimates?
- Built in 1900 — when were the roof, HVAC, electrical panel, plumbing, and water heater last replaced?
- Why hasn't it sold? Are there any deal-killer items the seller is aware of (foundation, flood, title, zoning, code violations)?
- Is there a deadline driving the sale (1031 exchange, divorce, estate, relocation)? That informs how much negotiation room exists.
- Schools are A-rated — typically a magnet for longer-tenancy family renters. What's the average tenant stay here, and is there a school-zone premium baked into asking?
- What's the average days-on-market for RENTAL listings here right now (not sales)? A rising rental-DOM trend means longer vacancies and softer asking-rent achievability than the comps imply.
- What's the recent tenant-quality profile in this submarket — average credit score on applications, eviction rate, late-payment / NSF rate, and stable-employment percentage? A property-management company in the area should have these aggregated.
- How much new for-sale + rental construction is in the pipeline within 1–3 miles? Heavy new supply typically softens prices + rents 12–24 months out; constrained supply supports both.
Investment metrics
- 1% rule
- 1.56% ✓
- Cap rate
- 12.79%
- Cash-on-cash
- 23.22%
- DSCR
- 2.03
- GRM
- 5.3
CMA / ARV
No comps found within radius.
Projected returns pro-forma
-3.0% appreciation · 3.0% rent growth · sell at horizon
- IRR
- 16.3%
- Equity multiple
- 1.65×
- Total profit
- $12,732
- Equity at exit
- $10,363
- IRR
- 24.8%
- Equity multiple
- 3.16×
- Total profit
- $42,028
- Equity at exit
- $6,009
Cash invested: $19,460 (down + closing). Projections, not guarantees.
Landlord ↔ Tenant lean methodology
- Overall (STATE)
- 73 Landlord-Friendly
- State Ohio
- 73 Landlord-Friendly · R+6
- County
- — inherits STATE
- City
- — inherits STATE
ZIP-level market 43103
- Active inventory
- 169
- Price-to-rent
- 5.3×
Monthly cashflow live
- Estimated rent
- $1,085 medium interval (Pro) →
- Mortgage (P&I)
- −$364
- Tax est. 1.5%
- −$87 /mo · $1,042/yr
- Insurance
- −$29
- HOA
- −$0
- Vacancy / Maint / Mgmt
- −$228
- Net cashflow
- $376
Break-even live
UW: 25.0% down · 7.5% · 30yr · 1.5% tax · 5.0% vac · 8.0% maint · 8.0% mgmt
Financing live
Cash to close
- Down payment
- $17,375
- Closing costs
- $2,085
- Reserves months
- —
- Total cash needed
- —
Loan-product check · same deal, 3 products live
Conventional
25% down · 7.5% · 30yr
- Down + closing
- —
- Monthly P&I
- —
- Monthly cashflow
- —
- DSCR
- —
- Eligible?
- —
Personal DTI + credit; lowest rate.
DSCR
20% down · 8.5% · 30yr
- Down + closing
- —
- Monthly P&I
- —
- Monthly cashflow
- —
- DSCR
- —
- Eligible?
- —
No personal income docs; deal must DSCR.
Hard money
10% down · 12.0% · 12mo
- Down + closing
- —
- Monthly P&I
- —
- Monthly cashflow
- —
- DSCR
- —
- Eligible?
- —
Short-term bridge; refi at stabilization.
Listing history 17 events
-
2026-06-18days on market $69,500 Active 95 DOM
-
2026-06-18price $69,500 Active 94 DOM
-
2026-06-17days on market $82,500 Active 94 DOM
-
2026-06-16days on market $82,500 Active 93 DOM
-
2026-06-15days on market $82,500 Active 92 DOM
-
2026-06-13days on market $82,500 Active 90 DOM
-
2026-06-09days on market $82,500 Active 86 DOM
-
2026-06-08days on market $82,500 Active 85 DOM
-
2026-06-07days on market $82,500 Active 84 DOM
-
2026-06-03days on market $82,500 Active 80 DOM
-
2026-06-02days on market $82,500 Active 79 DOM
-
2026-06-01days on market $82,500 Active 78 DOM
-
2026-05-31days on market $82,500 Active 77 DOM
-
2026-05-20price $82,500
-
2026-04-22price $89,000
-
2026-03-15$99,900 Active
-
2026-02-20historical $99,900
ⓘ Source: listings_history table (triggers on properties + properties_extension) + one-shot
backfill from property_details.listing_events for pre-trigger history.
Climate risk First Street
- Flood 1/10 Low FEMA zone X (unshaded) · 0% chance over 30 yrs
- Wildfire 1/10 Low
- Heat 4/10 Moderate 7 d/yr ≥101°F today · 18 d/yr by 30 yrs out
- Wind 2/10 Low 100% chance of damaging wind over 30 yrs
- Air quality 2/10 Low 1 unhealthy d/yr today · 2 by 30 yrs out
Nearby sold comps map
Loading sold comps map…
Walkable amenities ~0.75 mi
Loading nearby amenities…
Taxation est. · year 1
- Rental income
- $13,014
- − Mortgage interest
- −$3,893
- − Property taxes
- −$1,042
- − Insurance
- −$348
- − Repairs & maintenance
- −$1,041
- − Management
- −$1,041
- − Depreciation
- −$2,022
- Taxable income
- $3,627
- Est. tax owed @ 24.0%
- −$870
- After-tax cash flow
- $3,647/yr
For passive investors: Depreciation is non-cash, so a rental often shows a tax loss while cash-flowing — sheltering income. Rental losses are passive: they offset passive income freely, and up to $25,000/yr can offset ordinary (W-2) income if you actively participate and your MAGI is under $100k (phasing out to $0 by $150k); unused losses carry forward. On sale, claimed depreciation is recaptured at up to 25%, and gains may owe capital-gains tax (a 1031 exchange can defer both). Figures are a year-1 estimate at your 24.0% rate — not tax advice; consult a CPA.
Condition & rehab AI · 12 photos
This property requires extensive repairs and updates to bring it up to a livable condition. Immediate focus should be on the roof and exterior siding to improve the home's appearance and functionality.
Repairs flagged
- Major roof — Severe weathering
- Major exterior siding — Severe weathering
- Major interior walls — Exposed framing, missing drywall
- Major flooring — Exposed subflooring
Value-add opportunities
- Resale New roof — Improves home's appearance and functionality
- Resale New exterior siding — Enhances curb appeal
- Resale Interior drywall and paint — Restores home's livability and aesthetic
- Resale Flooring replacement — Improves home's livability and appearance
Renovation cost estimate screening
| Repair item | Severity | Est. cost |
|---|---|---|
| roof · Severe weathering | Major | $15,000–50,000 |
| exterior siding · Severe weathering | Major | $15,000–50,000 |
| interior walls · Exposed framing, missing drywall | Major | $15,000–50,000 |
| flooring · Exposed subflooring | Major | $15,000–50,000 |
| Total estimated repair cost · 4 items | $60,000–200,000 |
Value-add ROI direction
- Resale New roof — Improves home's appearance and functionality ↑
- Resale New exterior siding — Enhances curb appeal ↑
- Resale Interior drywall and paint — Restores home's livability and aesthetic ↑
- Resale Flooring replacement — Improves home's livability and appearance ↑
ⓘ Cost ranges are severity-bucket heuristics (US national rule-of-thumb). Get contractor quotes + a written scope before underwriting a rehab budget.
Schools (NCES district)
- District
- Teays Valley Local
- NCES district ID
- 3904909
- Math proficiency
- 66% ▼ -12.00%
- Reading proficiency
- 68% ▼ -10.00%
- Median HH income
- $64,637
- Composite
- 58.28/100
- National rank
- #1019
- State rank
- #166 of 656 in OH
Livability — Ashville
- Score
- 76/100
- State rank
- #212
- US rank
- #3315
Category grades
Schools grade is shown separately in the Schools card above.
Census & demographics
- Census place
- Ashville, OH
- County
- Pickaway · 57,589 people
- Metro
- Columbus, OH
- Population (ZIP)
- 12,981
- Household income
- $84,304
- Rent vs Own
- Severe rent burden
- 4.6
Population outlook (Pickaway County) Hauer SSP2
- Today (2025)
- 59,488 people
- By 2030
- 60,400 · +1.5%
- By 2040
- 61,498 · +3.4%
- By 2050
- 61,478 · +3.3%
- By 2075
- 59,696 · +0.3%
- By 2100
- 51,458 · -13.5%
Race, ethnicity, and origin ACS 2023
- Neighborhood character
- Predominantly White (94%)
- Race & ethnicity
- White 94% Two or more races 4% Hispanic / Latino 2%
- Common ancestry
- Italian 2% Slovak 2% Lithuanian 1%
- Foreign-born
- 1% · Canada
- Languages at home
- 99% English-only · Spanish 1%
Political lean MEDSL · Pickaway
- 2024 margin
- Solid R (+48.5) · D 25.3% · R 73.8%
- 2008→2024 swing
- -26.8pp toward R · 2008: -21.7pp · 2024: -48.5pp
- All cycles
- 2024: R+48.5 2020: R+47.0 2016: R+42.6 2012: R+18.7 2008: R+21.7
Not yet ingested
- Civics
- —
Market trends
- HPI YoY
- ▼ -137.66%
- Current HPI
- 241.2767
- Rent YoY
- —
- Metro
- —
- State GDP YoY
- ▲ 1.98%
- F500 in state
- 48
Industry mix (Fortune 500 HQ in OH)
| Industry | F500 HQs | Revenue |
|---|---|---|
| Insurance | 3 | $145B |
|
||
| Industrial Machinery | 3 | $49B |
|
||
| Financial Services | 3 | $24B |
|
||
| Consumer Goods | 2 | $93B |
|
||
| Aerospace / Defense | 2 | $47B |
|
||
| Utilities | 2 | $33B |
|
||
Price history
-17.4% since first listed4 events — show timeline
- 2026-05-20 Price Changed $82,500 CBRMLS
- 2026-04-22 Price Changed $89,000 CBRMLS
- 2026-03-15 Listed $99,900 CBRMLS
- 2026-02-20 Coming Soon $99,900 CBRMLS
Cash-flow waterfall
monthlySold comps — $/sqft
last 12 mo · ≤1 miLoading sold comps…