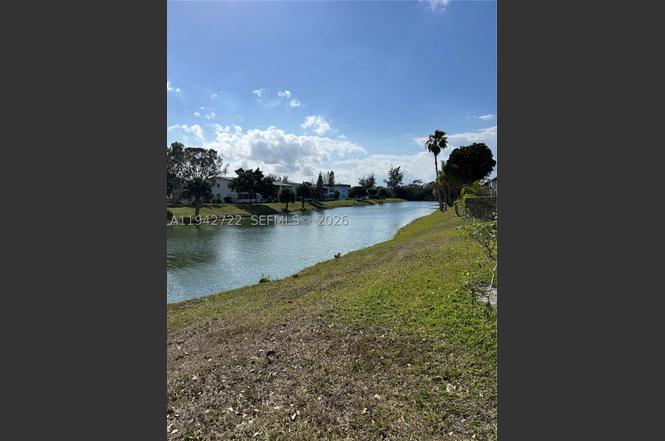
 🌊 Lakefront
38 Northampton B #38 · West Palm Beach, FL
Flood risk 1/10 · Minimal
- FEMA flood zone
- X (unshaded)
- Chance of flooding over 30 yrs
- 0.0%
- Est. flood insurance / yr
- $507 – $1,088
Fire risk 5/10 · Moderate
- Est. fire insurance / yr
- $947 – $1,759
Heat risk 10/10 · Severe
- Hot days now (above 105°F)
- 7 days/yr
- Hot days in 30 yrs
- 25 days/yr
Wind risk 10/10 · Severe
- Chance of severe wind over 30 yrs
- 99.0%
Air-quality risk 2/10 · Minimal
- Unhealthy air days now
- 1 days/yr
- Unhealthy air days in 30 yrs
- 1 days/yr
Risk factors via First Street. Map © Google.
Why this score? — see what drove the C+ grade
The composite is a weighted blend of 9 inputs, each scored 0–100. Each bar is that input's sub-score; the figure is the points it added to the 100-point composite (weight × sub-score).
- Cash flow +23.8/30.0
- 1% rule +10.0/10.0
- DSCR +7.7/10.0
- ARV discount +7.5/15.0
- Schools +4.3/10.0
- Livability +4.1/5.0
- Rent growth +2.5/5.0
- Condition / age +2.5/5.0
- Appreciation +0.0/10.0
$80,000
🖨 Deal sheet 📄 Offer letter ✓ Due diligence
Listing remarks
Great Place to live out of the cold 1 1 1/2 furnished 55+on second floor tranquil view of canal from screened in patio, in a large very active Gated community with lots to do. many swimming pools, club houses, amenities , security, lake for Kayaking, picnic area and much more also this bldg can be rented once a year. come see it
Key facts
- Gated community
- Lake for kayaking
- Many swimming pools
Tags
Property features AI
Finance
- Financial info: Lease considered; Pets not allowed
- HOA & community: Monthly association fee; Association amenities include fitness center, laundry, barbecue, picnic area, pickleball, pool, shuffleboard court, spa/hot tub, trails; Association covers amenities, cable TV, laundry, grounds maintenance, recreation facilities, security, and trash; Senior community
Exterior
- Parking: Detached 1-car garage; Guest parking available; 1 covered parking space
- Security: Complex is fenced; Security guard
- Utilities: Cable available
- Home design: Attached property; 2-story building; Entry on second floor; Has a view; Waterfront with canal access
- Construction: Block construction; Resale property
- Exterior features: Balcony; Screened balcony; Association pool
Interior
- Kitchen: Dishwasher; Microwave
- Flooring: Laminate flooring; Marble flooring
- Bathrooms: 1 full bathroom; 1 half bathroom
- Heating & cooling: Ceiling fans; Wall/window air conditioning units
- Interior features: Second floor entry
- Laundry & utility: Washer hookup; Dryer hookup; Common area laundry
Neighborhood map
What this means for you Summary
Snapshot
- This is a 1-bed/1.5-bath condo listed at $80k.
Deal economics
- At list price, monthly cash flow is $154 ($2k/yr) — positive.
- The deal already cash-flows at list — no discount required.
- Meets the 1% rule at list price ($1k rent vs $80k).
- Recommended offer: $70k (12.0% below list) — sets the bar for market timing.
- Cap rate 8.6% vs local median 3.8% in West Palm Beach — top-decile yield for the area; either an underpriced asset or a hidden risk that comps aren't pricing in. Stress-test before assuming the spread holds.
Location & tenants
- Location reads 82/100 on livability (#75 in FL, #1,255 nationally) — a professional / high-income tenant draw. Strengths: commute A+, housing A+, health & safety A+; Watch: employment C-, crime F.
- Palm Beach (suburban): math 46% / reading 53% proficiency, ranked #34 of 73 in FL (top 47%) — families likely to look elsewhere, expect single-tenant / working-renter base with shorter leases.
- Market conditions: Rents flat; 473 active listings in the ZIP; 40 comparable units currently listed for rent nearby; rentals at typical pace (median 24d on market — plan ~3-4 weeks tenant-placement turnaround); 3,974 units permitted in Palm Beach County in 2024 (1,012 in 5+ unit buildings).
- This rent runs 32% of the median local income ($52k/yr) — at the standard rent-burdened threshold; future hikes will face affordability resistance.
Forward outlook
- Local home prices are declining (-3.0%/yr); year-one equity from $553 of loan paydown is wiped out by about $2k of value loss. Plan a longer hold.
- Palm Beach County population projected at +30% by 2050 — long-run rental-demand tailwind backs the buy-and-hold thesis.
Negotiation context
- It's been on market 160 days — a 12% lower offer ($70k) is reasonable based on typical stale-listing flexibility.
- 2 sale attempts; this cycle's ask has dropped $48k (37%) from the opening price — seller is motivated, your offer sets the floor, not the list.
Risks & watch-outs
- Watch-outs: HOA is 28% of rent.
- Climate carrying-cost: severe wind risk, 99% chance of damaging wind over 30y; moderate wildfire risk; extreme-heat days projected 7→25/yr by 2055 (HVAC capex compounding) — expect insurance premiums to compound above CPI over the hold.
Questions for the listing agent
- It's been on market 160 days. Have you received any prior offers? Is the seller open to a 12% concession, seller financing, or rate buy-down credit?
- Built in 1972 — when were the roof, HVAC, electrical panel, plumbing, and water heater last replaced?
- What does the HOA fee cover, when was the last increase, and are there any pending special assessments or reserve-fund shortfalls?
- Any open or pending special assessments — roof, HVAC, plumbing, elevator, façade? What's the per-unit balance and payoff schedule, and is the seller paying it off at close or rolling it to the buyer?
- Why hasn't it sold? Are there any deal-killer items the seller is aware of (foundation, flood, title, zoning, code violations)?
- Is there a deadline driving the sale (1031 exchange, divorce, estate, relocation)? That informs how much negotiation room exists.
- Crime grade is F in this area — have there been break-ins, vandalism, or insurance claims at this property in the last 3 years? What carrier currently insures it and at what premium?
- This sits on a lake — are riparian / water-frontage rights deeded with the parcel? Any dock permits, shoreline easements, or HOA water-use restrictions?
- What's the documented flood / surge / shoreline-erosion history here (FEMA AND non-FEMA — e.g., storm surge, creek backup, septic-field saturation)?
- Any water-quality or seasonal algae-bloom issues that affect tenant satisfaction or short-term-rental demand?
- What's the average days-on-market for RENTAL listings here right now (not sales)? A rising rental-DOM trend means longer vacancies and softer asking-rent achievability than the comps imply.
- What's the recent tenant-quality profile in this submarket — average credit score on applications, eviction rate, late-payment / NSF rate, and stable-employment percentage? A property-management company in the area should have these aggregated.
- How much new apartment / multifamily construction is in the pipeline within 1–3 miles? Heavy new supply (>2% of stock underway) typically softens rents 12–24 months out; light construction supports rent growth.
Investment metrics
- 1% rule
- 1.74% ✓
- Cap rate
- 8.60%
- Cash-on-cash
- 8.23%
- DSCR
- 1.37
- GRM
- 4.8
CMA / ARV
No comps found within radius.
Projected returns pro-forma
-3.0% appreciation · 0.02% rent growth · sell at horizon
- IRR
- -8.9%
- Equity multiple
- 0.69×
- Total profit
- $-6,970
- Equity at exit
- $11,928
- IRR
- -7.2%
- Equity multiple
- 0.64×
- Total profit
- $-8,088
- Equity at exit
- $6,917
Cash invested: $22,400 (down + closing). Projections, not guarantees.
Landlord ↔ Tenant lean methodology
- Overall (STATE)
- 87 Strongly Landlord-Friendly
- State Florida
- 87 Strongly Landlord-Friendly · R+3
- County
- — inherits STATE
- City
- — inherits STATE
ZIP-level market 33417
- Home prices YoY
- -29.2%
- Rents YoY
- 0.0%
- Active inventory
- 473
- Price-to-rent
- 4.8×
Monthly cashflow live
- Estimated rent
- $1,394 high interval (Pro) →
- Mortgage (P&I)
- −$420
- Tax est. 1.5%
- −$100 /mo · $1,200/yr
- Insurance
- −$33
- HOA
- −$395
- Vacancy / Maint / Mgmt
- −$293
- Net cashflow
- $154
Break-even live
UW: 25.0% down · 7.5% · 30yr · 1.5% tax · 5.0% vac · 8.0% maint · 8.0% mgmt
Financing live
Cash to close
- Down payment
- $20,000
- Closing costs
- $2,400
- Reserves months
- —
- Total cash needed
- —
Loan-product check · same deal, 3 products live
Conventional
25% down · 7.5% · 30yr
- Down + closing
- —
- Monthly P&I
- —
- Monthly cashflow
- —
- DSCR
- —
- Eligible?
- —
Personal DTI + credit; lowest rate.
DSCR
20% down · 8.5% · 30yr
- Down + closing
- —
- Monthly P&I
- —
- Monthly cashflow
- —
- DSCR
- —
- Eligible?
- —
No personal income docs; deal must DSCR.
Hard money
10% down · 12.0% · 12mo
- Down + closing
- —
- Monthly P&I
- —
- Monthly cashflow
- —
- DSCR
- —
- Eligible?
- —
Short-term bridge; refi at stabilization.
Rent comps 40 comps
| Address | Beds | Baths | Sqft | Rent | $/sqft | DOM | Units | Dist |
|---|---|---|---|---|---|---|---|---|
| 92 Berkshire Cres Unit 92 West Palm Beach, FL | 1.0 | 1.0 | 615 | $1,350 | $2.20 | 24d | 1 | 0.10mi |
| 333 Northampton Q Unit 333 West Palm Beach, FL | 1.0 | 1.0 | 570 | $1,300 | $2.28 | 24d | 1 | 0.10mi |
| 235 Northampton L #235 West Palm Beach, FL | 1.0 | 1.0 | 615 | $1,300 | $2.11 | 10d | 1 | 0.11mi |
| 172 Camden I West Palm Beach, FL | 1.0 | 1.5 | 646 | $1,400 | $2.17 | 2d | 1 | 0.12mi |
| 243 Northampton M Unit M West Palm Beach, FL | 1.0 | 1.0 | 570 | $1,400 | $2.46 | 7d | 1 | 0.13mi |
| 89 Berkshire D #89 West Palm Beach, FL | 1.0 | 1.0 | 585 | $1,050 | $1.79 | 7d | 1 | 0.13mi |
| 89 Berkshire D #89 West Palm Beach, FL | 1.0 | 1.0 | 585 | $1,150 | $1.97 | 24d | 1 | 0.13mi |
| 216 Berkshire K Unit K West Palm Beach, FL | 1.0 | 1.0 | 585 | $1,400 | $2.39 | 20d | 1 | 0.13mi |
| 107 Kent St Unit 107* West Palm Beach, FL | 1.0 | 1.0 | 570 | $1,500 | $2.63 | 24d | 1 | 0.14mi |
| 157 Camden G West Palm Beach, FL | 1.0 | 1.5 | 646 | $1,350 | $2.09 | 24d | 1 | 0.14mi |
| 231 Berkshire K #231 West Palm Beach, FL | 1.0 | 1.0 | 585 | $1,150 | $1.97 | 2d | 1 | 0.15mi |
| 209 Camden I Unit 209 West Palm Beach, FL | 1.0 | 1.5 | 738 | $1,350 | $1.83 | 24d | 1 | 0.16mi |
| 118 Kent H West Palm Beach, FL | 1.0 | 1.0 | 570 | $1,325 | $2.32 | 24d | 1 | 0.17mi |
| 220 Berkshire K #220 West Palm Beach, FL | 1.0 | 1.0 | 585 | $1,300 | $2.22 | 20d | 1 | 0.17mi |
| 142 Kent I West Palm Beach, FL | 1.0 | 1.5 | 684 | $1,475 | $2.16 | 24d | 1 | 0.18mi |
| 179 Berkshire I Unit I West Palm Beach, FL | 1.0 | 1.0 | 585 | $1,225 | $2.09 | 24d | 1 | 0.19mi |
| 374 Camden P West Palm Beach, FL | 1.0 | 1.0 | 570 | $1,150 | $2.02 | 18d | 1 | 0.19mi |
| 372 Camden P West Palm Beach, FL | 1.0 | 1.0 | 570 | $1,200 | $2.11 | 24d | 1 | 0.20mi |
| 3 Berkshire a West Palm Beach, FL | 1.0 | 1.0 | 585 | $1,900 | $3.25 | 24d | 1 | 0.26mi |
| 364 Camden Dr Unit 364 West Palm Beach, FL | 1.0 | 1.0 | 570 | $1,500 | $2.63 | 24d | 1 | 0.26mi |
| 210 Canterbury E Unit 1 West Palm Beach, FL | 1.0 | 1.0 | 570 | $1,375 | $2.41 | 12d | 1 | 0.28mi |
| 166 Sussex I Unit I West Palm Beach, FL | 1.0 | 1.0 | 570 | $1,500 | $2.63 | 24d | 1 | 0.29mi |
| 176 Sussex I Unit I West Palm Beach, FL | 1.0 | 1.0 | 570 | $1,400 | $2.46 | 24d | 1 | 0.29mi |
| 172 Sussex I Unit I West Palm Beach, FL | 1.0 | 1.0 | 570 | $1,500 | $2.63 | 24d | 1 | 0.29mi |
| 159 Sussex H West Palm Beach, FL | 1.0 | 1.0 | 570 | $1,350 | $2.37 | 24d | 1 | 0.29mi |
| 176 Sussex I Unit I West Palm Beach, FL | 1.0 | 1.0 | 570 | $1,400 | $2.46 | 17d | 1 | 0.29mi |
| 4 Sussex a West Palm Beach, FL | 1.0 | 1.0 | 615 | $1,350 | $2.20 | 14d | 1 | 0.29mi |
| 204 Canterbury I Unit I West Palm Beach, FL | 1.0 | 1.0 | 570 | $1,350 | $2.37 | 24d | 1 | 0.31mi |
| 201 Canterbury I Unit I West Palm Beach, FL | 1.0 | 1.0 | 570 | $1,250 | $2.19 | 24d | 1 | 0.31mi |
| 175 Canterbury H #175 West Palm Beach, FL | 1.0 | 1.0 | 570 | $1,250 | $2.19 | 14d | 1 | 0.31mi |
| 361 Windsor N West Palm Beach, FL | 1.0 | 1.5 | 702 | $1,350 | $1.92 | 24d | 1 | 0.31mi |
| 16 Sussex E Unit 16 West Palm Beach, FL | 1.0 | 1.0 | 570 | $1,350 | $2.37 | 12d | 1 | 0.32mi |
| 197 Sussex E Unit 197 West Palm Beach, FL | 1.0 | 1.5 | 684 | $1,500 | $2.19 | 24d | 1 | 0.33mi |
| 11 Cambridge E Unit 11 West Palm Beach, FL | 1.0 | 1.5 | 684 | $1,500 | $2.19 | 24d | 1 | 0.33mi |
| 284 Windsor M Unit M West Palm Beach, FL | 1.0 | 1.0 | 585 | $1,350 | $2.31 | 24d | 1 | 0.34mi |
| 298 Windsor M Unit M West Palm Beach, FL | 1.0 | 1.5 | 702 | $1,300 | $1.85 | 24d | 1 | 0.34mi |
| 298 Windsor M Unit M West Palm Beach, FL | 1.0 | 1.5 | 702 | $1,250 | $1.78 | 17d | 1 | 0.34mi |
| 49 Cambridge B Unit B West Palm Beach, FL | 1.0 | 1.5 | 684 | $1,450 | $2.12 | 24d | 1 | 0.36mi |
| 49 Cambridge B Unit B West Palm Beach, FL | 1.0 | 1.5 | 684 | $1,350 | $1.97 | 2d | 1 | 0.36mi |
| 17 Cambridge a West Palm Beach, FL | 1.0 | 1.5 | 684 | $1,200 | $1.75 | 24d | 1 | 0.36mi |
HOA detail condo
- Monthly dues
- $395 · $4,740/yr
- Likely covers
- poolsecurity
- Assessments
- None detected in remarks — confirm with the listing agent.
Listing history 17 events
-
2026-06-18days on market $80,000 Active 160 DOM
-
2026-06-17days on market $80,000 Active 159 DOM
-
2026-06-16days on market $80,000 Active 158 DOM
-
2026-06-15days on market $80,000 Active 157 DOM
-
2026-06-13days on market $80,000 Active 155 DOM
-
2026-06-09days on market $80,000 Active 151 DOM
-
2026-06-07days on market $80,000 Active 149 DOM
-
2026-06-04days on market $80,000 Active 146 DOM
-
2026-06-03days on market $80,000 Active 145 DOM
-
2026-06-01days on market $80,000 Active 143 DOM
-
2026-05-31days on market $80,000 Active 142 DOM
-
2026-04-02price $80,000
-
2026-03-14price $100,000
-
2026-02-20price $110,000
-
2026-01-08$127,500 Active
-
2025-12-31historical
-
2025-06-25$127,500 Active
ⓘ Source: listings_history table (triggers on properties + properties_extension) + one-shot
backfill from property_details.listing_events for pre-trigger history.
Climate risk First Street
- Flood 1/10 Low FEMA zone X (unshaded) · 0% chance over 30 yrs
- Wildfire 5/10 Major
- Heat 10/10 Extreme 7 d/yr ≥105°F today · 25 d/yr by 30 yrs out
- Wind 10/10 Extreme 99% chance of damaging wind over 30 yrs
- Air quality 2/10 Low 1 unhealthy d/yr today · 1 by 30 yrs out
Nearby sold comps map
Loading sold comps map…
Walkable amenities ~0.75 mi
Loading nearby amenities…
Taxation est. · year 1
- Rental income
- $16,733
- − Mortgage interest
- −$4,481
- − Property taxes
- −$1,200
- − Insurance
- −$400
- − Repairs & maintenance
- −$1,339
- − Management
- −$1,339
- − HOA
- −$4,740
- − Depreciation
- −$2,327
- Taxable income
- $907
- Est. tax owed @ 24.0%
- −$218
- After-tax cash flow
- $1,627/yr
For passive investors: Depreciation is non-cash, so a rental often shows a tax loss while cash-flowing — sheltering income. Rental losses are passive: they offset passive income freely, and up to $25,000/yr can offset ordinary (W-2) income if you actively participate and your MAGI is under $100k (phasing out to $0 by $150k); unused losses carry forward. On sale, claimed depreciation is recaptured at up to 25%, and gains may owe capital-gains tax (a 1031 exchange can defer both). Figures are a year-1 estimate at your 24.0% rate — not tax advice; consult a CPA.
Schools (NCES district)
- District
- Palm Beach
- NCES district ID
- 1201500
- Math proficiency
- 46% ▼ -16.00%
- Reading proficiency
- 53% ▼ -4.00%
- Median HH income
- $53,943
- Composite
- 42.72/100
- National rank
- #3160
- State rank
- #34 of 73 in FL
Livability — West Palm Beach
- Score
- 82/100
- State rank
- #75
- US rank
- #1255
Category grades
Schools grade is shown separately in the Schools card above.
Census & demographics
- County
- Palm Beach County · 1,438,312 people
- City population
- 222,012
- Metro
- Miami-Fort Lauderdale-Pompano Beach, FL
- Population (ZIP)
- 38,079
- Household income
- $51,605
- Rent vs Own
- Severe rent burden
- 2548.0
Population outlook (Palm Beach County) Hauer SSP2
- Today (2025)
- 1,637,487 people
- By 2030
- 1,743,255 · +6.5%
- By 2040
- 1,948,712 · +19.0%
- By 2050
- 2,132,979 · +30.3%
- By 2075
- 2,530,027 · +54.5%
- By 2100
- 2,706,979 · +65.3%
Race, ethnicity, and origin ACS 2023
- Neighborhood character
- Highly diverse neighborhood (Simpson 0.72)
- Race & ethnicity
- White 34% Black 30% Hispanic / Latino 27% Two or more races 16% Asian 3%
- Hispanic origin (detail)
- Mexican 3% Puerto Rican 6% Cuban 5% Dominican 2%
- Common ancestry
- Hispanic 10% Romanian 3% Scotch-Irish 1%
- Foreign-born
- 34% · Canada, Jamaica
- Languages at home
- 58% English-only · Spanish 24% French/Haitian/Cajun 11% Other Indo-European 3%
Political lean MEDSL · Palm Beach
- 2024 margin
- Toss-up / Even · D 50.0% · R 49.2%
- 2008→2024 swing
- -22.1pp toward R · 2008: 22.9pp · 2024: 0.8pp
- All cycles
- 2024: D+0.8 2020: D+12.8 2016: D+15.3 2012: D+17.0 2008: D+22.9
Not yet ingested
- Civics
- —
Market trends
- HPI YoY
- ▼ -138.62%
- Current HPI
- 335.8396
- Rent YoY
- ▬ 0.02%
- Metro
- Miami-Fort Lauderdale-Pompano Beach, FL
- State GDP YoY
- ▲ 3.28%
- F500 in state
- 36
Industry mix (Fortune 500 HQ in FL)
| Industry | F500 HQs | Revenue |
|---|---|---|
| Industrial Technology | 2 | $29B |
|
||
| Insurance | 2 | $17B |
|
||
| Retail | 1 | $60B |
|
||
| Technology Distribution | 1 | $58B |
|
||
| Homebuilding | 1 | $35B |
|
||
| Technology Manufacturing | 1 | $35B |
|
||
Price history
-37.3% since first listed6 events — show timeline
- 2026-04-02 Price Changed $80,000 MARMLS
- 2026-03-14 Price Changed $100,000 MARMLS
- 2026-02-20 Price Changed $110,000 MARMLS
- 2026-01-08 Listed $127,500 MARMLS
- 2025-12-31 Listing Removed — MARMLS
- 2025-06-25 Listed $127,500 MARMLS
Cash-flow waterfall
monthlySold comps — $/sqft
last 12 mo · ≤1 miLoading sold comps…