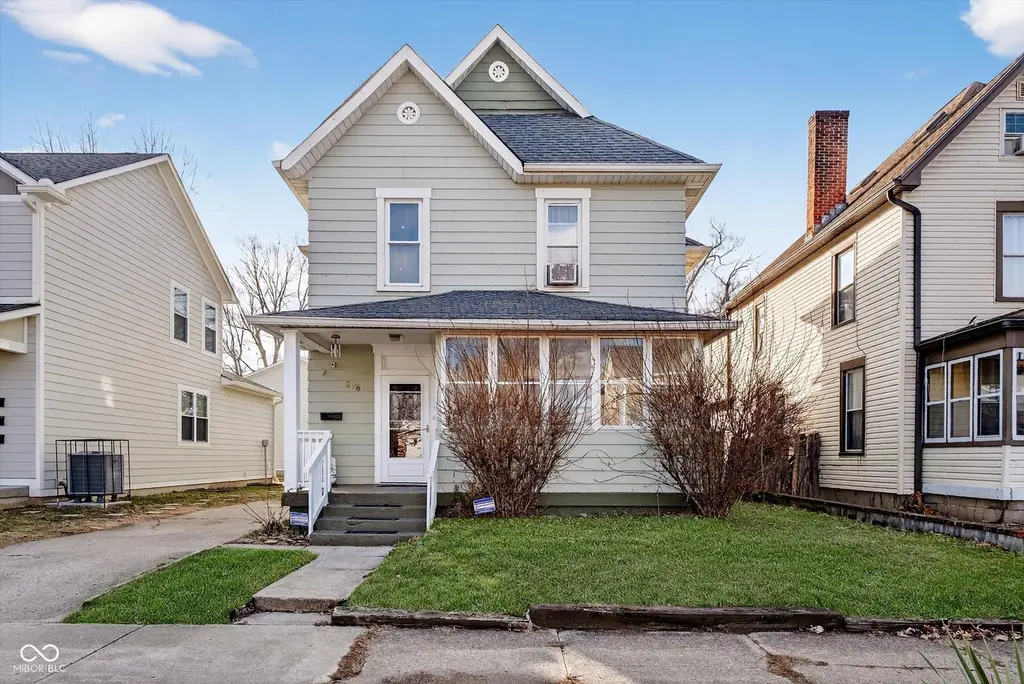
2446 Carrollton Ave · Indianapolis city (balance), IN
Flood risk 1/10 · Minimal
- FEMA flood zone
- X (unshaded)
- Chance of flooding over 30 yrs
- 0.0%
- Est. flood insurance / yr
- $473 – $860
Fire risk 1/10 · Minimal
- Est. fire insurance / yr
- $717 – $1,331
Heat risk 4/10 · Minor
- Hot days now (above 101°F)
- 7 days/yr
- Hot days in 30 yrs
- 19 days/yr
Wind risk 2/10 · Minimal
- Chance of severe wind over 30 yrs
- 0.0%
Air-quality risk 4/10 · Minor
- Unhealthy air days now
- 5 days/yr
- Unhealthy air days in 30 yrs
- 7 days/yr
Risk factors via First Street. Map © Google.
Why this score? — see what drove the C- grade
The composite is a weighted blend of 9 inputs, each scored 0–100. Each bar is that input's sub-score; the figure is the points it added to the 100-point composite (weight × sub-score).
- Cash flow +16.9/30.0
- ARV discount +15.0/15.0
- 1% rule +5.9/10.0
- DSCR +5.2/10.0
- Rent growth +4.1/5.0
- Livability +2.5/5.0
- Condition / age +2.5/5.0
- Schools +1.4/10.0
- Appreciation +0.0/10.0
$235,000
🖨 Deal sheet 📄 Offer letter ✓ Due diligence
Listing remarks MLS
Spacious 4/5 BR home with PRIME Mid Town location - Hardwoods - Flexible living options - Large living areas and bedrooms - Sun room - Arched entry ways and Old World charm - Two blocks from the Monon and a ton of new development - Main level W/D - Minutes to Broadripple and Mass Ave - Currently used as a cash flowing STR - Run the numbers; this one works! All furniture and decor can be purchased with home.
Key facts
- Main level w d
- Arched entry ways
- Sun room
Tags
Neighborhood map
What this means for you Summary
Snapshot
- This is a 5-bed/2.0-bath single-family listed at $235k.
Deal economics
- At list price, monthly cash flow is $154 ($2k/yr) — positive.
- The deal already cash-flows at list — no discount required.
- Meets the 1% rule at list price ($3k rent vs $235k).
- Recommended offer: $214k (9.0% below list) — sets the bar for market timing.
- Cap rate 7.1% vs local median 4.4% in Indianapolis city (balance) — top-decile yield for the area; either an underpriced asset or a hidden risk that comps aren't pricing in. Stress-test before assuming the spread holds.
Location & tenants
- Location reads: area grade C — affects rentability + tenant quality, not the cash-flow math above.
- Indianapolis Public Schools (urban): math 14% / reading 20% proficiency, ranked #286 of 301 in IN (top 95%) — low school quality limits family demand, transient renter base, plan for 1-2y turnover; 77% free/reduced lunch — lower-income household profile, screen leases tightly.
- Market conditions: Rents rising fast (+6.2%/yr); 314 active listings in the ZIP; 6 comparable units currently listed for rent nearby; rentals at typical pace (median 24d on market — plan ~3-4 weeks tenant-placement turnaround); 1,906 units permitted in Marion County in 2024 (621 in 5+ unit buildings).
- This rent runs 42% of the median local income ($72k/yr) — at the standard rent-burdened threshold; future hikes will face affordability resistance.
Forward outlook
- Local home prices are declining (-3.0%/yr); year-one equity from $2k of loan paydown is wiped out by about $7k of value loss. Plan a longer hold.
- Marion County population projected at +18% by 2050 — long-run rental-demand tailwind backs the buy-and-hold thesis.
Negotiation context
- It's been on market 93 days — a 9% lower offer ($214k) is reasonable based on typical stale-listing flexibility.
- 9 sale attempts since 21y ago; this cycle's ask has dropped $15k (6%) from the opening price — seller is motivated, your offer sets the floor, not the list.
- Current owner paid $180k; 31% above their basis — modest negotiation headroom, anchor on the comps not their cost.
Risks & watch-outs
- Watch-outs: property tax is 2.8% of price; built in 1922 — expect roof / HVAC / electrical / plumbing capex.
Questions for the listing agent
- It's been on market 93 days. Have you received any prior offers? Is the seller open to a 9% concession, seller financing, or rate buy-down credit?
- Built in 1922 — when were the roof, HVAC, electrical panel, plumbing, and water heater last replaced?
- Property tax is high relative to price — has the assessment been appealed recently, and will the sale trigger a re-assessment?
- Why hasn't it sold? Are there any deal-killer items the seller is aware of (foundation, flood, title, zoning, code violations)?
- Is there a deadline driving the sale (1031 exchange, divorce, estate, relocation)? That informs how much negotiation room exists.
- What's the average days-on-market for RENTAL listings here right now (not sales)? A rising rental-DOM trend means longer vacancies and softer asking-rent achievability than the comps imply.
- What's the recent tenant-quality profile in this submarket — average credit score on applications, eviction rate, late-payment / NSF rate, and stable-employment percentage? A property-management company in the area should have these aggregated.
- How much new for-sale + rental construction is in the pipeline within 1–3 miles? Heavy new supply typically softens prices + rents 12–24 months out; constrained supply supports both.
Investment metrics
- 1% rule
- 1.09% ✓
- Cap rate
- 7.08%
- Cash-on-cash
- 2.80%
- DSCR
- 1.12
- GRM
- 7.6
CMA / ARV
- ARV (median comp)
- $426,556
- List price
- $235,000
- Delta
- -44.91%
- Verdict
- UNDERPRICED
- Comps
- 20 within 1.0 mi
Show comp detail 12 sales within ~0.75 mi
| Address | Dist | Beds/Ba | Sqft | Sold | Price | $/sf | Match |
|---|---|---|---|---|---|---|---|
| 2114 Broadway St | 0.47mi | 4/2.5 (-1) | 2,704 (-2%) | 0mo | $437,000 | $162 | 68 |
| 2228 N New Jersey St | 0.50mi | 4/2.5 (-1) | 2,758 (+0%) | 6mo | $500,000 | $181 | 64 |
| 2351 N Pennsylvania St | 0.64mi | 4/3.0 (-1) | 2,757 (+0%) | 3mo | $500,000 | $181 | 58 |
| 519 Sutherland Ave | 0.30mi | 4/2.5 (-1) | 2,400 (-12%) | 6mo | $390,000 | $163 | 53 |
| 2314 N New Jersey St | 0.44mi | 4/3.0 (-1) | 2,530 (-8%) | 7mo | $470,000 | $186 | 52 |
| 2019 Winthrop Ave | 0.59mi | 4/3.5 (-1) | 2,890 (+5%) | 3mo | $630,000 | $218 | 50 |
| 1909 Ruckle St | 0.74mi | 4/4.0 (-1) | 2,616 (-5%) | 3mo | $485,000 | $185 | 42 |
| 2933 Winthrop Ave | 0.52mi | 4/2.0 (-1) | 2,340 (-15%) | 6mo | $162,000 | $69 | 41 |
| 1922 Ruckle St | 0.73mi | 4/4.0 (-1) | 2,568 (-6%) | 2mo | $485,000 | $189 | 41 |
| 3039 N Park Ave | 0.64mi | 4/3.0 (-1) | 2,462 (-10%) | 6mo | $399,900 | $162 | 39 |
| 2026 Alvord St | 0.58mi | 4/3.5 (-1) | 3,039 (+11%) | 8mo | $720,000 | $237 | 38 |
| 2123 N Talbott St | 0.74mi | 4/2.5 (-1) | 3,084 (+12%) | 1mo | $442,500 | $143 | 37 |
Match score weights: distance 35% · size 25% · config 20% · recency 20%. Top-matched comps best support the ARV.
Projected returns pro-forma
-3.0% appreciation · 6.21% rent growth · sell at horizon
- IRR
- -7.8%
- Equity multiple
- 0.70×
- Total profit
- $-19,559
- Equity at exit
- $35,039
- IRR
- 5.9%
- Equity multiple
- 1.51×
- Total profit
- $33,807
- Equity at exit
- $20,319
Cash invested: $65,800 (down + closing). Projections, not guarantees.
Landlord ↔ Tenant lean methodology
- Overall (STATE)
- 90 Strongly Landlord-Friendly
- State Indiana
- 90 Strongly Landlord-Friendly · R+11
- County
- — inherits STATE
- City
- — inherits STATE
ZIP-level market 46205
- Rents YoY
- 6.2%
- Active inventory
- 314
- Price-to-rent
- 7.6×
Monthly cashflow live
- Estimated rent
- $2,564 high interval (Pro) →
- Mortgage (P&I)
- −$1,232
- Tax from tax record
- −$541 /mo · $6,498/yr
- Insurance
- −$98
- HOA
- −$0
- Vacancy / Maint / Mgmt
- −$538
- Net cashflow
- $154
Break-even live
UW: 25.0% down · 7.5% · 30yr · 1.5% tax · 5.0% vac · 8.0% maint · 8.0% mgmt
Financing live
Cash to close
- Down payment
- $58,750
- Closing costs
- $7,050
- Reserves months
- —
- Total cash needed
- —
Loan-product check · same deal, 3 products live
Conventional
25% down · 7.5% · 30yr
- Down + closing
- —
- Monthly P&I
- —
- Monthly cashflow
- —
- DSCR
- —
- Eligible?
- —
Personal DTI + credit; lowest rate.
DSCR
20% down · 8.5% · 30yr
- Down + closing
- —
- Monthly P&I
- —
- Monthly cashflow
- —
- DSCR
- —
- Eligible?
- —
No personal income docs; deal must DSCR.
Hard money
10% down · 12.0% · 12mo
- Down + closing
- —
- Monthly P&I
- —
- Monthly cashflow
- —
- DSCR
- —
- Eligible?
- —
Short-term bridge; refi at stabilization.
Rent comps 6 comps
| Address | Beds | Baths | Sqft | Rent | $/sqft | DOM | Units | Dist |
|---|---|---|---|---|---|---|---|---|
| 2340 N Park Ave Indianapolis, IN | 4.0 | 3.5 | 3500 | $3,500 | $1.00 | 4d | 1 | 0.29mi |
| 2246 Bellefontaine St Indianapolis, IN | 4.0 | 2.5 | 2587 | $2,300 | $0.89 | 24d | 1 | 0.30mi |
| 1949 Carrollton Ave Indianapolis, IN | 4.0 | 3.5 | 2617 | $2,995 | $1.14 | 44d | 1 | 0.65mi |
| 3128 Broadway St Indianapolis, IN | 4.0 | 1.5 | 1999 | $2,200 | $1.10 | 24d | 1 | 0.70mi |
| 1704 N Pennsylvania St Unit B Indianapolis, IN | 4.0 | 1.5 | 2200 | $1,800 | $0.82 | 44d | 1 | 1.13mi |
| 3160 Graceland Ave Indianapolis, IN | 4.0 | 2.0 | 1936 | $2,000 | $1.03 | 24d | 1 | 1.22mi |
Listing history 35 events
-
2026-06-18days on market $235,000 Active 93 DOM
-
2026-06-17days on market $235,000 Active 92 DOM
-
2026-06-16days on market $235,000 Active 91 DOM
-
2026-06-15days on market $235,000 Active 90 DOM
-
2026-06-13days on market $235,000 Active 88 DOM
-
2026-06-13days on market $235,000 Active 87 DOM
-
2026-06-09days on market $235,000 Active 84 DOM
-
2026-06-08days on market $235,000 Active 83 DOM
-
2026-06-07days on market $235,000 Active 82 DOM
-
2026-06-03days on market $235,000 Active 78 DOM
-
2026-06-02days on market $235,000 Active 77 DOM
-
2026-06-01days on market $235,000 Active 76 DOM
-
2026-05-31days on market $235,000 Active 75 DOM
-
2026-05-08price $235,000 410-char remark
Show marketing remark (410 chars)
Spacious 4/5 BR home with PRIME Mid Town location - Hardwoods - Flexible living options - Large living areas and bedrooms - Sun room - Arched entry ways and Old World charm - Two blocks from the Monon and a ton of new development - Main level W/D - Minutes to Broadripple and Mass Ave - Currently used as a cash flowing STR - Run the numbers; this one works! All furniture and decor can be purchased with home.
-
2026-03-23status Active 410-char remark
Show marketing remark (410 chars)
Spacious 4/5 BR home with PRIME Mid Town location - Hardwoods - Flexible living options - Large living areas and bedrooms - Sun room - Arched entry ways and Old World charm - Two blocks from the Monon and a ton of new development - Main level W/D - Minutes to Broadripple and Mass Ave - Currently used as a cash flowing STR - Run the numbers; this one works! All furniture and decor can be purchased with home.
-
2026-03-02status Pending 410-char remark
Show marketing remark (410 chars)
Spacious 4/5 BR home with PRIME Mid Town location - Hardwoods - Flexible living options - Large living areas and bedrooms - Sun room - Arched entry ways and Old World charm - Two blocks from the Monon and a ton of new development - Main level W/D - Minutes to Broadripple and Mass Ave - Currently used as a cash flowing STR - Run the numbers; this one works! All furniture and decor can be purchased with home.
-
2026-02-24$250,000 Active 410-char remark
Show marketing remark (410 chars)
Spacious 4/5 BR home with PRIME Mid Town location - Hardwoods - Flexible living options - Large living areas and bedrooms - Sun room - Arched entry ways and Old World charm - Two blocks from the Monon and a ton of new development - Main level W/D - Minutes to Broadripple and Mass Ave - Currently used as a cash flowing STR - Run the numbers; this one works! All furniture and decor can be purchased with home.
-
2024-01-25historical $2,500
-
2023-11-19price $2,500
-
2023-10-20price $2,750
-
2023-08-30$3,000
-
2019-06-03soldstatus $180,000 Sold 720-char remark
Show marketing remark (720 chars)
Immaculate & very well-kept home on East side of Fall creek neighborhood in Reagan Park! With just over 2700 sq ft, this huge 5 Bedroom/2 bath home with 3 season sun room and basement is priced to sell. This Homes has 2 bedrooms on MAIN floor, beautiful wood work, arch door ways with Tons of room for storage and walk-in closets. Updates included:2016 Both baths totally refinished, new lights/fans in bedrooms. 2014: New furnace! Recently updates include newly fresh paint and stained as well as new carpet on stairway. Hardwood floors in hallways, dining room and living room. This home is only 2 blocks from Monon Trail and very close to downtown and offering home warranty! Hurry-This home should not last long!
-
2019-04-17status Pending 720-char remark
Show marketing remark (720 chars)
Immaculate & very well-kept home on East side of Fall creek neighborhood in Reagan Park! With just over 2700 sq ft, this huge 5 Bedroom/2 bath home with 3 season sun room and basement is priced to sell. This Homes has 2 bedrooms on MAIN floor, beautiful wood work, arch door ways with Tons of room for storage and walk-in closets. Updates included:2016 Both baths totally refinished, new lights/fans in bedrooms. 2014: New furnace! Recently updates include newly fresh paint and stained as well as new carpet on stairway. Hardwood floors in hallways, dining room and living room. This home is only 2 blocks from Monon Trail and very close to downtown and offering home warranty! Hurry-This home should not last long!
-
2019-04-04price $219,900 720-char remark
Show marketing remark (720 chars)
Immaculate & very well-kept home on East side of Fall creek neighborhood in Reagan Park! With just over 2700 sq ft, this huge 5 Bedroom/2 bath home with 3 season sun room and basement is priced to sell. This Homes has 2 bedrooms on MAIN floor, beautiful wood work, arch door ways with Tons of room for storage and walk-in closets. Updates included:2016 Both baths totally refinished, new lights/fans in bedrooms. 2014: New furnace! Recently updates include newly fresh paint and stained as well as new carpet on stairway. Hardwood floors in hallways, dining room and living room. This home is only 2 blocks from Monon Trail and very close to downtown and offering home warranty! Hurry-This home should not last long!
-
2019-03-10$229,900 Active 720-char remark
Show marketing remark (720 chars)
Immaculate & very well-kept home on East side of Fall creek neighborhood in Reagan Park! With just over 2700 sq ft, this huge 5 Bedroom/2 bath home with 3 season sun room and basement is priced to sell. This Homes has 2 bedrooms on MAIN floor, beautiful wood work, arch door ways with Tons of room for storage and walk-in closets. Updates included:2016 Both baths totally refinished, new lights/fans in bedrooms. 2014: New furnace! Recently updates include newly fresh paint and stained as well as new carpet on stairway. Hardwood floors in hallways, dining room and living room. This home is only 2 blocks from Monon Trail and very close to downtown and offering home warranty! Hurry-This home should not last long!
-
2008-07-18soldstatus $29,500
-
2008-04-04$29,500
-
2008-04-04historical
-
2008-03-24historical
-
2008-01-17$37,500
-
2007-12-10historical
-
2007-10-23$49,900
-
2006-01-21$84,000
-
2005-12-07historical
-
2005-06-08$110,000
ⓘ Source: listings_history table (triggers on properties + properties_extension) + one-shot
backfill from property_details.listing_events for pre-trigger history.
Tax reassessment forecast IN · Partial reset (capped growth)
- Current annual tax
- $6,498 · $541/mo
- Projected year-2 tax
- $6,498 · $541/mo
- Expected delta
- $0/yr ($0/mo · 0.0%)
ⓘ Screening estimate from a state-policy table — verify with the county assessor before closing.
Climate risk First Street
- Flood 1/10 Low FEMA zone X (unshaded) · 0% chance over 30 yrs
- Wildfire 1/10 Low
- Heat 4/10 Moderate 7 d/yr ≥101°F today · 19 d/yr by 30 yrs out
- Wind 2/10 Low 0% chance of damaging wind over 30 yrs
- Air quality 4/10 Moderate 5 unhealthy d/yr today · 7 by 30 yrs out
Nearby sold comps map
Loading sold comps map…
Walkable amenities ~0.75 mi
Loading nearby amenities…
Taxation est. · year 1
- Rental income
- $30,765
- − Mortgage interest
- −$13,164
- − Property taxes
- −$6,498
- − Insurance
- −$1,175
- − Repairs & maintenance
- −$2,461
- − Management
- −$2,461
- − Depreciation
- −$6,836
- Taxable loss
- −$1,830
- Est. tax savings @ 24.0%
- +$439
- After-tax cash flow
- $2,283/yr
For passive investors: Depreciation is non-cash, so a rental often shows a tax loss while cash-flowing — sheltering income. Rental losses are passive: they offset passive income freely, and up to $25,000/yr can offset ordinary (W-2) income if you actively participate and your MAGI is under $100k (phasing out to $0 by $150k); unused losses carry forward. On sale, claimed depreciation is recaptured at up to 25%, and gains may owe capital-gains tax (a 1031 exchange can defer both). Figures are a year-1 estimate at your 24.0% rate — not tax advice; consult a CPA.
Schools (NCES district)
- District
- Indianapolis Public Schools
- NCES district ID
- 1804770
- Math proficiency
- 14% ▼ -7.00%
- Reading proficiency
- 20% ▼ -3.00%
- Median HH income
- $32,034
- Composite
- 13.69/100
- National rank
- #9499
- State rank
- #286 of 301 in IN
Livability — Indianapolis city (balance)
No livability data for this city. (Only ~50 U.S. cities are tracked.)
Census & demographics
- Census place
- Indianapolis city (balance), IN
- County
- Marion County · 998,460 people
- City population
- 881,119
- Metro
- Indianapolis-Carmel-Anderson, IN
- Population (ZIP)
- 28,259
- Household income
- $72,417
- Rent vs Own
- Severe rent burden
- 1149.0
Population outlook (Marion County) Hauer SSP2
- Today (2025)
- 1,025,572 people
- By 2030
- 1,065,727 · +3.9%
- By 2040
- 1,141,577 · +11.3%
- By 2050
- 1,208,920 · +17.9%
- By 2075
- 1,367,288 · +33.3%
- By 2100
- 1,438,201 · +40.2%
Race, ethnicity, and origin ACS 2023
- Neighborhood character
- Diverse neighborhood (Simpson 0.64)
- Race & ethnicity
- White 50% Black 32% Two or more races 10% Hispanic / Latino 7% Asian 3%
- Hispanic origin (detail)
- Mexican 4%
- Common ancestry
- Italian 3% Slovak 2% Romanian 2%
- Foreign-born
- 5% · Canada
- Languages at home
- 89% English-only · Spanish 6% Other Indo-European 2% German/W. Germanic 1%
Political lean MEDSL · Marion
- 2024 margin
- Strong D (+27.7) · D 63.0% · R 35.3% · Other 1.7%
- 2008→2024 swing
- -0.7pp no change · 2008: 28.4pp · 2024: 27.7pp
- All cycles
- 2024: D+27.7 2020: D+29.1 2016: D+22.8 2012: D+22.2 2008: D+28.4
Not yet ingested
- Civics
- —
Market trends
- HPI YoY
- ▼ -322.77%
- Current HPI
- 380.5407
- Rent YoY
- ▲ 6.21%
- Metro
- Indianapolis-Carmel-Anderson, IN
- State GDP YoY
- ▲ 2.90%
- F500 in state
- 18
Industry mix (Fortune 500 HQ in IN)
| Industry | F500 HQs | Revenue |
|---|---|---|
| Industrial Machinery | 2 | $37B |
|
||
| Healthcare | 1 | $177B |
|
||
| Pharmaceuticals | 1 | $45B |
|
||
| Metals / Steel | 1 | $18B |
|
||
| Agriculture | 1 | $17B |
|
||
| Packaging | 1 | $12B |
|
||
Price history
+113.6% since first listed22 events — show timeline
- 2026-05-08 Price Changed $235,000 MIBOR as Distributed by MLS Grid
- 2026-03-23 Relisted — MIBOR as Distributed by MLS Grid
- 2026-03-02 Pending — MIBOR as Distributed by MLS Grid
- 2026-02-24 Listed $250,000 MIBOR as Distributed by MLS Grid
- 2024-01-25 Rental Removed $2,500 RENTEC
- 2023-11-19 Price Changed $2,500 RENTEC
- 2023-10-20 Price Changed $2,750 RENTEC
- 2023-08-30 Listed for Rent $3,000 RENTEC
- 2019-06-03 Sold (MLS) $180,000 MIBOR as Distributed by MLS Grid
- 2019-04-17 Pending — MIBOR as Distributed by MLS Grid
- 2019-04-04 Price Changed $219,900 MIBOR as Distributed by MLS Grid
- 2019-03-10 Listed $229,900 MIBOR as Distributed by MLS Grid
- 2008-07-18 Sold (MLS) $29,500 MIBOR as Distributed by MLS Grid
- 2008-04-04 Listed $29,500 MIBOR as Distributed by MLS Grid
- 2008-04-04 Listing Removed — MIBOR as Distributed by MLS Grid
- 2008-03-24 Listing Removed — MIBOR as Distributed by MLS Grid
- 2008-01-17 Listed $37,500 MIBOR as Distributed by MLS Grid
- 2007-12-10 Listing Removed — MIBOR as Distributed by MLS Grid
- 2007-10-23 Listed $49,900 MIBOR as Distributed by MLS Grid
- 2006-01-21 Listed $84,000 MIBOR as Distributed by MLS Grid
- 2005-12-07 Listing Removed — MIBOR as Distributed by MLS Grid
- 2005-06-08 Listed $110,000 MIBOR as Distributed by MLS Grid
Property tax history
+28.3%/yrLatest (2025): $6,498 · +11.4% YoY. Source: county tax records.
Cash-flow waterfall
monthlySold comps — $/sqft
last 12 mo · ≤1 miLoading sold comps…