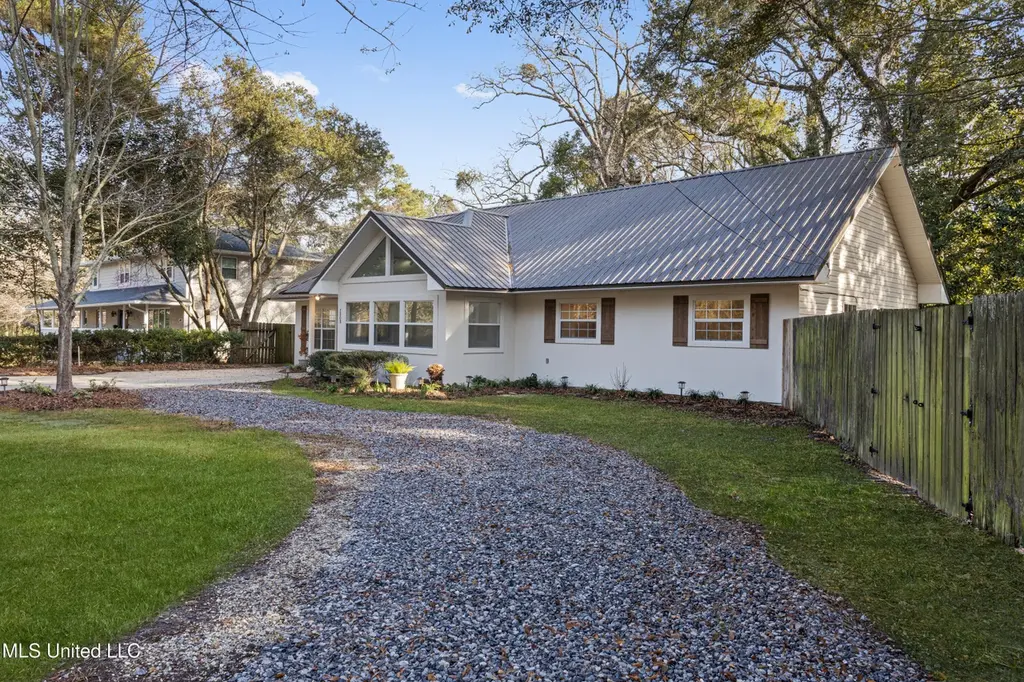
5808 Ridge Rd · Gulf Hills, MS
Flood risk 1/10 · Minimal
- FEMA flood zone
- X (unshaded)
- Chance of flooding over 30 yrs
- 0.0%
- Est. flood insurance / yr
- $507 – $1,088
Fire risk 4/10 · Minor
- Est. fire insurance / yr
- $1,241 – $2,305
Heat risk 10/10 · Severe
- Hot days now (above 107°F)
- 7 days/yr
- Hot days in 30 yrs
- 22 days/yr
Wind risk 9/10 · Severe
- Chance of severe wind over 30 yrs
- 99.0%
Air-quality risk 2/10 · Minimal
- Unhealthy air days now
- 1 days/yr
- Unhealthy air days in 30 yrs
- 2 days/yr
Risk factors via First Street. Map © Google.
Why this score? — see what drove the D grade
The composite is a weighted blend of 9 inputs, each scored 0–100. Each bar is that input's sub-score; the figure is the points it added to the 100-point composite (weight × sub-score).
- ARV discount +14.1/15.0
- Cash flow +10.6/30.0
- Schools +4.4/10.0
- Livability +3.6/5.0
- DSCR +3.0/10.0
- Rent growth +2.8/5.0
- Condition / age +2.5/5.0
- 1% rule +2.4/10.0
- Appreciation +0.0/10.0
$349,500
🖨 Deal sheet 📄 Offer letter ✓ Due diligence
Listing remarks MLS
DON'T MISS OUT! PRICED OVER 10K BELOW RECENT APPRAISAL! ALL REPAIRS ARE MADE FROM RECENT INSPECTION. METAL ROOF HAS ALL NEW FASTENERS! NOT IN A FLOOD ZONE. Located in the heart of Gulf Hills -- one of the Coast's most desirable golf cart-friendly communities -- this beautifully updated 4 bedroom, 3 bath home offers 2,720 square feet of comfortable, spacious living just steps from the golf course. This home has already had the big-ticket items taken care of, including updated electrical, a new HVAC system, new hot water heater, and a metal roof with all new fasteners recently installed -- offering true peace of mind for the next owner. Inside, you'll find brand-new stainless steel appliances, granite countertops, and a well-designed layout that makes both everyday living and entertaining feel easy and natural. The backyard is tucked away and private, creating a quiet space to relax and unwind after a long day. The location is hard to beat: Minutes to downtown Ocean Springs Approximately 10 minutes to Keesler Air Force Base About 10 minutes to the beach, casinos, dining, and entertainment And it's not located in a flood zone. If you've been searching for a home with space, updates, and that laid-back coastal lifestyle in a golf cart community, this one is definitely worth a look.
Key facts
- Updated electrical
- Metal roof
- Private backyard
Tags
Neighborhood map
What this means for you Summary
Snapshot
- This is a 4-bed/3.0-bath single-family listed at $350k.
Deal economics
- At list price, monthly cash flow is $-174 ($-2k/yr) — negative.
- To cash-flow at today's rent, offer at most $319k (8.8% below list).
- To meet the 1% rule (rent ≥ 1% of price), the offer needs to be $258k (26.1% below list).
- Recommended offer: $258k (26.1% below list) — sets the bar for 1% rule.
- Cap rate 5.7% vs local median 4.5% in Gulf Hills — meaningfully above typical; check what's discounted (condition, days-on-market, listing class) to confirm the premium yield is real.
Location & tenants
- Location reads 71/100 on livability (#38 in MS) — a middle-class / working-renter tenant base. Strengths: crime A+, cost of living A+, housing A+; Watch: employment D+, schools F, amenities F.
- Jackson County School District (rural): math 53% / reading 48% proficiency, ranked #10 of 130 in MS (top 8%) — acceptable for families but not a draw, mixed tenant base, ~2y average lease.
- Market conditions: Rents rising (+1.3%/yr); 714 active listings in the ZIP; 4 comparable units currently listed for rent nearby; rentals lingering (median 44d on market — plan ~5-8 weeks vacancy on turnover, expect pricing pressure); 75% of comp listings sitting > 30 days — soft ceiling on asking rent; solid renter incomes; 516 units permitted in Jackson County in 2024 (6 in 5+ unit buildings).
- This rent runs 39% of the median local income ($79k/yr) — at the standard rent-burdened threshold; future hikes will face affordability resistance.
Forward outlook
- Local home prices are declining (-3.0%/yr); year-one equity from $2k of loan paydown is wiped out by about $10k of value loss. Plan a longer hold.
Negotiation context
- It's been on market 83 days — a 6% lower offer ($329k) is reasonable based on typical stale-listing flexibility.
- 5 sale attempts since 8y ago with the ask held roughly flat each time — persistent listings suggest the price (not the market) is what's stuck; bring a comps-based counter.
Risks & watch-outs
- Watch-outs: built in 1950 — expect roof / HVAC / electrical / plumbing capex.
- Climate carrying-cost: severe wind risk, 99% chance of damaging wind over 30y; extreme-heat days projected 7→22/yr by 2055 (HVAC capex compounding) — expect insurance premiums to compound above CPI over the hold.
Questions for the listing agent
- What do current leases actually rent for vs. the listed asking? Can we see a recent rent roll and the last 12 months of T-12 income?
- It's been on market 83 days. Have you received any prior offers? Is the seller open to a 26% concession, seller financing, or rate buy-down credit?
- Built in 1950 — when were the roof, HVAC, electrical panel, plumbing, and water heater last replaced?
- What does the HOA fee cover, when was the last increase, and are there any pending special assessments or reserve-fund shortfalls?
- Why hasn't it sold? Are there any deal-killer items the seller is aware of (foundation, flood, title, zoning, code violations)?
- Is there a deadline driving the sale (1031 exchange, divorce, estate, relocation)? That informs how much negotiation room exists.
- Schools are F-rated, which usually means shorter tenancies and higher turnover. Who's the typical renter profile here, and what's been the actual vacancy rate?
- The area grade is low — what's the realistic commute time and amenity access for the typical tenant pool here? Any planned neighborhood developments (good or bad) we should know about?
- What's the average days-on-market for RENTAL listings here right now (not sales)? A rising rental-DOM trend means longer vacancies and softer asking-rent achievability than the comps imply.
- What's the recent tenant-quality profile in this submarket — average credit score on applications, eviction rate, late-payment / NSF rate, and stable-employment percentage? A property-management company in the area should have these aggregated.
- How much new for-sale + rental construction is in the pipeline within 1–3 miles? Heavy new supply typically softens prices + rents 12–24 months out; constrained supply supports both.
Investment metrics
- 1% rule
- 0.74% ✗
- Cap rate
- 5.70%
- Cash-on-cash
- -2.14%
- DSCR
- 0.90
- GRM
- 11.3
CMA / ARV
- ARV (median comp)
- $409,930
- List price
- $349,500
- Delta
- -14.74%
- Verdict
- UNDERPRICED
- Comps
- 20 within 1.0 mi
Show comp detail 12 sales within ~0.75 mi
| Address | Dist | Beds/Ba | Sqft | Sold | Price | $/sf | Match |
|---|---|---|---|---|---|---|---|
| 5809 David Davis Pl | 0.25mi | 3/2.0 (-1) | 2,263 (-4%) | 0mo | $400,000 | $177 | 73 |
| 6009 Switzer Cv | 0.67mi | 4/2.5 | 2,386 (+2%) | 0mo | $499,999 | $210 | 63 |
| 13517 Garland Rd | 0.58mi | 4/3.0 | 2,219 (-5%) | 1mo | $379,990 | $171 | 63 |
| 6001 Ridge Rd | 0.23mi | 3/3.0 (-1) | 2,176 (-7%) | 11mo | $330,000 | $152 | 63 |
| 13140 Hanover Dr | 0.17mi | 3/3.0 (-1) | 2,115 (-10%) | 13mo | $365,000 | $173 | 60 |
| 13152 Hanover Dr | 0.21mi | 4/3.0 | 2,650 (+13%) | 11mo | $1,195,000 | $451 | 59 |
| 13505 Garland Rd | 0.71mi | 4/3.0 | 2,219 (-5%) | 6mo | $364,990 | $164 | 53 |
| 6705 Afton Cv | 0.64mi | 5/3.0 (+1) | 2,513 (+7%) | 7mo | $419,900 | $167 | 47 |
| 1215 Sunset Ave | 0.62mi | 3/3.0 (-1) | 2,567 (+10%) | 6mo | $637,755 | $248 | 45 |
| 13501 Garland Rd | 0.73mi | 4/2.0 | 2,114 (-10%) | 6mo | $384,990 | $182 | 41 |
| 6303 Prado Rd | 0.63mi | 3/2.5 (-1) | 2,056 (-12%) | 5mo | $360,000 | $175 | 39 |
| 13565 Garland Rd | 0.72mi | 3/2.0 (-1) | 2,049 (-13%) | 2mo | $397,990 | $194 | 35 |
Match score weights: distance 35% · size 25% · config 20% · recency 20%. Top-matched comps best support the ARV.
Projected returns pro-forma
-3.0% appreciation · 1.31% rent growth · sell at horizon
- IRR
- -21.6%
- Equity multiple
- 0.26×
- Total profit
- $-72,131
- Equity at exit
- $52,112
- IRR
- -19.5%
- Equity multiple
- 0.03×
- Total profit
- $-94,575
- Equity at exit
- $30,218
Cash invested: $97,860 (down + closing). Projections, not guarantees.
Landlord ↔ Tenant lean methodology
- Overall (STATE)
- 90 Strongly Landlord-Friendly
- State Mississippi
- 90 Strongly Landlord-Friendly · R+11
- County
- — inherits STATE
- City
- — inherits STATE
ZIP-level market 39564
- Home prices YoY
- -26.8%
- Rents YoY
- 1.3%
- Active inventory
- 714
- Price-to-rent
- 11.3×
Monthly cashflow live
- Estimated rent
- $2,584 medium interval (Pro) →
- Mortgage (P&I)
- −$1,833
- Tax from tax record
- −$233 /mo · $2,802/yr
- Insurance
- −$146
- HOA
- −$4
- Vacancy / Maint / Mgmt
- −$543
- Net cashflow
- $-174
Break-even live
UW: 25.0% down · 7.5% · 30yr · 1.5% tax · 5.0% vac · 8.0% maint · 8.0% mgmt
Financing live
Cash to close
- Down payment
- $87,375
- Closing costs
- $10,485
- Reserves months
- —
- Total cash needed
- —
Loan-product check · same deal, 3 products live
Conventional
25% down · 7.5% · 30yr
- Down + closing
- —
- Monthly P&I
- —
- Monthly cashflow
- —
- DSCR
- —
- Eligible?
- —
Personal DTI + credit; lowest rate.
DSCR
20% down · 8.5% · 30yr
- Down + closing
- —
- Monthly P&I
- —
- Monthly cashflow
- —
- DSCR
- —
- Eligible?
- —
No personal income docs; deal must DSCR.
Hard money
10% down · 12.0% · 12mo
- Down + closing
- —
- Monthly P&I
- —
- Monthly cashflow
- —
- DSCR
- —
- Eligible?
- —
Short-term bridge; refi at stabilization.
Rent comps 4 comps
| Address | Beds | Baths | Sqft | Rent | $/sqft | DOM | Units | Dist |
|---|---|---|---|---|---|---|---|---|
| 6428 Poco Rd Ocean Springs, MS | 3.0 | 2.0 | 1990 | $2,500 | $1.26 | 43d | 1 | 0.69mi |
| 1109 Le Badine Ct Ocean Springs, MS | 3.0 | 2.0 | 1650 | $2,250 | $1.36 | 43d | 1 | 0.89mi |
| 1109 Le Badine Ct Ocean Springs, MS | 3.0 | 2.0 | 1650 | $2,250 | $1.36 | 13d | 1 | 0.89mi |
| 107 Surgeres Pl Ocean Springs, MS | 4.0 | 2.5 | 2830 | $3,400 | $1.20 | 44d | 1 | 1.02mi |
HOA detail
- Monthly dues
- $4 · $48/yr
- Likely covers
- waterelectric
Listing history 26 events
-
2026-06-18days on market $349,500 Active 83 DOM
-
2026-06-17days on market $349,500 Active 82 DOM
-
2026-06-16days on market $349,500 Active 81 DOM
-
2026-06-15days on market $349,500 Active 80 DOM
-
2026-06-14days on market $349,500 Active 78 DOM
-
2026-06-13days on market $349,500 Active 77 DOM
-
2026-06-10days on market $349,500 Active 75 DOM
-
2026-06-09days on market $349,500 Active 74 DOM
-
2026-06-08days on market $349,500 Active 73 DOM
-
2026-06-07days on market $349,500 Active 72 DOM
-
2026-06-05days on market $349,500 Active 69 DOM
-
2026-06-03days on market $349,500 Active 68 DOM
-
2026-06-02days on market $349,500 Active 67 DOM
-
2026-06-01days on market $349,500 Active 66 DOM
-
2026-05-31days on market $349,500 Active 65 DOM
-
2026-05-30days on market $349,500 Active 64 DOM
-
2026-03-27$349,500 Active 1304-char remark
Show marketing remark (1304 chars)
DON'T MISS OUT! PRICED OVER 10K BELOW RECENT APPRAISAL! ALL REPAIRS ARE MADE FROM RECENT INSPECTION. METAL ROOF HAS ALL NEW FASTENERS! NOT IN A FLOOD ZONE. Located in the heart of Gulf Hills -- one of the Coast's most desirable golf cart-friendly communities -- this beautifully updated 4 bedroom, 3 bath home offers 2,720 square feet of comfortable, spacious living just steps from the golf course. This home has already had the big-ticket items taken care of, including updated electrical, a new HVAC system, new hot water heater, and a metal roof with all new fasteners recently installed -- offering true peace of mind for the next owner. Inside, you'll find brand-new stainless steel appliances, granite countertops, and a well-designed layout that makes both everyday living and entertaining feel easy and natural. The backyard is tucked away and private, creating a quiet space to relax and unwind after a long day. The location is hard to beat: Minutes to downtown Ocean Springs Approximately 10 minutes to Keesler Air Force Base About 10 minutes to the beach, casinos, dining, and entertainment And it's not located in a flood zone. If you've been searching for a home with space, updates, and that laid-back coastal lifestyle in a golf cart community, this one is definitely worth a look.
-
2026-03-16status Active
-
2026-02-25status Pending
-
2026-02-25historical
-
2026-02-19$344,900 Active
-
2025-12-30historical
-
2025-09-22price $347,900
-
2025-07-14$359,900 Active
-
2018-08-23soldstatus
-
2018-08-20$209,000
ⓘ Source: listings_history table (triggers on properties + properties_extension) + one-shot
backfill from property_details.listing_events for pre-trigger history.
Tax reassessment forecast MS · Resets to sale price
- Current annual tax
- $2,802 · $233/mo
- Projected year-2 tax
- $2,802 · $233/mo
- Expected delta
- $0/yr ($0/mo · -0.0%)
ⓘ Screening estimate from a state-policy table — verify with the county assessor before closing.
Climate risk First Street
- Flood 1/10 Low FEMA zone X (unshaded) · 0% chance over 30 yrs
- Wildfire 4/10 Moderate
- Heat 10/10 Extreme 7 d/yr ≥107°F today · 22 d/yr by 30 yrs out
- Wind 9/10 Extreme 99% chance of damaging wind over 30 yrs
- Air quality 2/10 Low 1 unhealthy d/yr today · 2 by 30 yrs out
Nearby sold comps map
Loading sold comps map…
Walkable amenities ~0.75 mi
Loading nearby amenities…
Taxation est. · year 1
- Rental income
- $31,014
- − Mortgage interest
- −$19,577
- − Property taxes
- −$2,802
- − Insurance
- −$1,748
- − Repairs & maintenance
- −$2,481
- − Management
- −$2,481
- − HOA
- −$48
- − Depreciation
- −$10,167
- Taxable loss
- −$8,290
- Est. tax savings @ 24.0%
- +$1,990
- After-tax cash flow
- $-100/yr
For passive investors: Depreciation is non-cash, so a rental often shows a tax loss while cash-flowing — sheltering income. Rental losses are passive: they offset passive income freely, and up to $25,000/yr can offset ordinary (W-2) income if you actively participate and your MAGI is under $100k (phasing out to $0 by $150k); unused losses carry forward. On sale, claimed depreciation is recaptured at up to 25%, and gains may owe capital-gains tax (a 1031 exchange can defer both). Figures are a year-1 estimate at your 24.0% rate — not tax advice; consult a CPA.
Schools (NCES district)
- District
- Jackson County School District
- NCES district ID
- 2802160
- Math proficiency
- 53% ▼ -5.00%
- Reading proficiency
- 48% ▼ -5.00%
- Median HH income
- $53,569
- Composite
- 43.57/100
- National rank
- #2980
- State rank
- #10 of 130 in MS
Livability — Gulf Hills
- Score
- 71/100
- State rank
- #38
- US rank
- #7310
Category grades
Schools grade is shown separately in the Schools card above.
Census & demographics
- Census place
- Gulf Hills, MS
- County
- Jackson County · 82,196 people
- Metro
- Gulfport-Biloxi, MS
- Population (ZIP)
- 43,240
- Household income
- $78,596
- Rent vs Own
- Severe rent burden
- 734.0
Population outlook (Jackson County) Hauer SSP2
- Today (2025)
- 146,926 people
- By 2030
- 148,442 · +1.0%
- By 2040
- 149,631 · +1.8%
- By 2050
- 148,723 · +1.2%
- By 2075
- 147,845 · +0.6%
- By 2100
- 144,510 · -1.6%
Race, ethnicity, and origin ACS 2023
- Neighborhood character
- Predominantly White (74%)
- Race & ethnicity
- White 74% Black 10% Hispanic / Latino 8% Two or more races 7% Asian 4%
- Hispanic origin (detail)
- Mexican 3% Puerto Rican 2%
- Common ancestry
- Lithuanian 5% Slovak 4% Romanian 2%
- Foreign-born
- 5% · Canada, South Korea, Vietnam
- Languages at home
- 93% English-only · Spanish 3% Vietnamese 2% Tagalog/Filipino 1%
Political lean MEDSL · Jackson
- 2024 margin
- Solid R (+39.9) · D 29.5% · R 69.4% · Other 1.1%
- 2008→2024 swing
- -6.4pp toward R · 2008: -33.5pp · 2024: -39.9pp
- All cycles
- 2024: R+39.9 2020: R+34.6 2016: R+39.9 2012: R+36.1 2008: R+33.5
Not yet ingested
- Civics
- —
Market trends
- HPI YoY
- ▼ -74.77%
- Current HPI
- 204.2244
- Rent YoY
- ▲ 1.31%
- Metro
- Gulfport-Biloxi, MS
- State GDP YoY
- —
- F500 in state
- 0
Price history
+67.2% since first listed10 events — show timeline
- 2026-03-27 Listed $349,500 MLSU
- 2026-03-16 Relisted — MLSU
- 2026-02-25 Pending — MLSU
- 2026-02-25 Listing Removed — MLSU
- 2026-02-19 Listed $344,900 MLSU
- 2025-12-30 Listing Removed — MLSU
- 2025-09-22 Price Changed $347,900 MLSU
- 2025-07-14 Listed $359,900 MLSU
- 2018-08-23 Sold (MLS) — MLSU
- 2018-08-20 Listed $209,000 MLSU
Property tax history
+7.2%/yrLatest (2025): $2,802 · +1.5% YoY. Source: county tax records.
Cash-flow waterfall
monthlySold comps — $/sqft
last 12 mo · ≤1 miLoading sold comps…