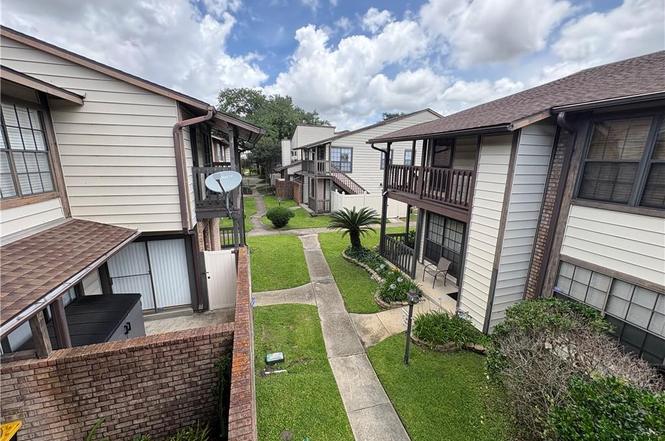
2932 Manhattan Blvd · Harvey, LA
Flood risk 9/10 · Severe
- FEMA flood zone
- X (shaded)
- Chance of flooding over 30 yrs
- 0.6%
- Est. flood insurance / yr
- $507 – $1,088
Fire risk 1/10 · Minimal
- Est. fire insurance / yr
- $1,269 – $2,357
Heat risk 10/10 · Severe
- Hot days now (above 108°F)
- 7 days/yr
- Hot days in 30 yrs
- 21 days/yr
Wind risk 10/10 · Severe
- Chance of severe wind over 30 yrs
- 99.0%
Air-quality risk 2/10 · Minimal
- Unhealthy air days now
- 2 days/yr
- Unhealthy air days in 30 yrs
- 2 days/yr
Risk factors via First Street. Map © Google.
Why this score? — see what drove the D+ grade
The composite is a weighted blend of 9 inputs, each scored 0–100. Each bar is that input's sub-score; the figure is the points it added to the 100-point composite (weight × sub-score).
- Cash flow +17.9/30.0
- 1% rule +7.8/10.0
- ARV discount +7.5/15.0
- DSCR +5.6/10.0
- Livability +3.2/5.0
- Schools +2.5/10.0
- Condition / age +2.5/5.0
- Rent growth +1.5/5.0
- Appreciation +0.0/10.0
$89,900
🖨 Deal sheet (PDF) 📄 Offer letter ✓ Due diligence
Listing remarks
Low-Maintenance 1-Bedroom Condo in Harvey Move-in ready 1-bedroom, 1-bathroom condo located on the second floor at 2932 Manhattan Blvd (#175). The interior features durable ceramic tile flooring throughout, and the unit includes a fenced bottom area. The $210 monthly HOA fee covers property insurance, water, trash, and general exterior maintenance. This location offers excellent convenience, situated just blocks from the Jane O'Brien Chatelain West Bank Regional Library, major retail shopping, dining, and Lapalco Blvd. Great fit for a turnkey investment or affordable, straightforward living
Key facts
- Fenced bottom area
- Turnkey investment
- Affordable living
Tags
Property features AI
Finance
- Other: Located near Lapalco Blvd (directions reference)
- HOA & community: Association fee $210 monthly
Exterior
- Utilities: Electric service: Entergy
- Home design: Single family residence
- Construction: Vinyl siding construction; Composition roof
- Exterior features: Composition roof; Vinyl siding
Interior
- Bathrooms: 1 full bathroom
- Heating & cooling: Central heating; Central air conditioning
- Interior features: Bedroom 1
Neighborhood map
What this means for you Summary
Snapshot
- This is a 1-bed/1.0-bath single-family listed at $90k.
Deal economics
- At list price, monthly cash flow is $9 ($110/yr) — positive.
- The deal already cash-flows at list — no discount required.
- Meets the 1% rule at list price ($1k rent vs $90k).
- Cap rate 7.3% vs local median 4.8% in Harvey — top-decile yield for the area; either an underpriced asset or a hidden risk that comps aren't pricing in. Stress-test before assuming the spread holds.
Location & tenants
- Location reads 64/100 on livability (#166 in LA) — a middle-class / working-renter tenant base. Strengths: cost of living A+, housing A+; Watch: crime F, amenities F, commute F.
- Jefferson Parish (suburban): math 24% / reading 34% proficiency, ranked #44 of 98 in LA (top 45%) — low school quality limits family demand, transient renter base, plan for 1-2y turnover; 70% free/reduced lunch — lower-income household profile, screen leases tightly.
- Zoned schools: Woodland West School (math 14% / reading 23%, grade F, #467 of 646 statewide, top 73%, 782 students, 75% FRL); L.H. Marrero Middle School (math 15% / reading 28%, grade F, #158 of 218 statewide, top 73%, 672 students, 65% FRL); Helen Cox High School (math 6% / reading 22%, grade F, #228 of 265 statewide, top 86%, 904 students, 66% FRL) — zoned schools at 68% FRL track the district average.
- Market conditions: Rents falling (-3.9%/yr); 189 active listings in the ZIP; 9 comparable units currently listed for rent nearby; rentals leasing fast (median 5d on market — plan ~1-2 weeks tenant-placement turnaround); 518 units permitted in Jefferson Parish in 2024 (43 in 5+ unit buildings).
Forward outlook
- Local home prices are declining (-3.0%/yr); year-one equity from $622 of loan paydown is wiped out by about $3k of value loss. Plan a longer hold.
Negotiation context
- Only 6 days on market — expect competitive offers; lowballing is unlikely to land.
- 4 sale attempts since 24y ago with the ask held roughly flat each time — persistent listings suggest the price (not the market) is what's stuck; bring a comps-based counter.
Risks & watch-outs
- Watch-outs: flood insurance adds $66/mo.
- Climate carrying-cost: severe flood risk; severe wind risk, 99% chance of damaging wind over 30y; extreme-heat days projected 7→21/yr by 2055 (HVAC capex compounding) — expect insurance premiums to compound above CPI over the hold.
Questions for the listing agent
- Built in 1970 — when were the roof, HVAC, electrical panel, plumbing, and water heater last replaced?
- What's the actual annual flood-insurance premium (NFIP or private), and is the property in a SFHA with mandatory coverage?
- What does the HOA fee cover, when was the last increase, and are there any pending special assessments or reserve-fund shortfalls?
- Is there a deadline driving the sale (1031 exchange, divorce, estate, relocation)? That informs how much negotiation room exists.
- Schools are D-rated, which usually means shorter tenancies and higher turnover. Who's the typical renter profile here, and what's been the actual vacancy rate?
- Crime grade is F in this area — have there been break-ins, vandalism, or insurance claims at this property in the last 3 years? What carrier currently insures it and at what premium?
- The area grade is low — what's the realistic commute time and amenity access for the typical tenant pool here? Any planned neighborhood developments (good or bad) we should know about?
- What's the average days-on-market for RENTAL listings here right now (not sales)? A rising rental-DOM trend means longer vacancies and softer asking-rent achievability than the comps imply.
- What's the recent tenant-quality profile in this submarket — average credit score on applications, eviction rate, late-payment / NSF rate, and stable-employment percentage? A property-management company in the area should have these aggregated.
- How much new for-sale + rental construction is in the pipeline within 1–3 miles? Heavy new supply typically softens prices + rents 12–24 months out; constrained supply supports both.
Investment metrics
- 1% rule
- 1.28% ✓
- Cap rate
- 7.30%
- Cash-on-cash
- 3.60%
- DSCR
- 1.16
- GRM
- 6.5
CMA / ARV
No comps found within radius.
Projected returns pro-forma
-3.0% appreciation · 0.0% rent growth · sell at horizon
- IRR
- -20.4%
- Equity multiple
- 0.32×
- Total profit
- $-17,162
- Equity at exit
- $13,404
- IRR
- -28.1%
- Equity multiple
- -0.05×
- Total profit
- $-26,434
- Equity at exit
- $7,773
Cash invested: $25,172 (down + closing). Projections, not guarantees.
Landlord ↔ Tenant lean methodology
- Overall (STATE)
- 90 Strongly Landlord-Friendly
- State Louisiana
- 90 Strongly Landlord-Friendly · R+12
- County
- — inherits STATE
- City
- — inherits STATE
ZIP-level market 70058
- Rents YoY
- -3.9%
- Active inventory
- 189
- Price-to-rent
- 6.5×
Monthly cashflow live
- Estimated rent
- $1,148 high interval (Pro) →
- Mortgage (P&I)
- −$471
- Tax est. 1.5%
- −$112 /mo · $1,348/yr
- Insurance
- −$37
- Flood insurance flood zone
- −$66 /mo · $798/yr
- HOA
- −$210
- Vacancy / Maint / Mgmt
- −$241
- Net cashflow
- $9
Break-even live
Sensitivity live
| Price | -10% $71 | -5% $40 | +0% $9 | +5% $-22 | +10% $-53 |
|---|---|---|---|---|---|
| Rent | -10% $-82 | -5% $-36 | +0% $9 | +5% $54 | +10% $100 |
| Rate | -1.0pp $54 | -0.5pp $32 | base $9 | +0.5pp $-14 | +1.0pp $-38 |
UW: 25.0% down · 7.5% · 30yr · 1.5% tax · 5.0% vac · 8.0% maint · 8.0% mgmt
Financing live
Cash to close
- Down payment
- $22,475
- Closing costs
- $2,697
- Reserves months
- —
- Total cash needed
- —
Loan-product check · same deal, 3 products live
Conventional
25% down · 7.5% · 30yr
- Down + closing
- —
- Monthly P&I
- —
- Monthly cashflow
- —
- DSCR
- —
- Eligible?
- —
Personal DTI + credit; lowest rate.
DSCR
20% down · 8.5% · 30yr
- Down + closing
- —
- Monthly P&I
- —
- Monthly cashflow
- —
- DSCR
- —
- Eligible?
- —
No personal income docs; deal must DSCR.
Hard money
10% down · 12.0% · 12mo
- Down + closing
- —
- Monthly P&I
- —
- Monthly cashflow
- —
- DSCR
- —
- Eligible?
- —
Short-term bridge; refi at stabilization.
Rent comps 9 comps
| Address | Beds | Baths | Sqft | Rent | $/sqft | DOM | Units | Dist |
|---|---|---|---|---|---|---|---|---|
| 2912 Manhattan Blvd #132 Harvey, LA | 1.0 | 1.0 | 660 | $1,200 | $1.82 | 45d | 1 | 0.04mi |
| 1500 Lorene Dr Harvey, LA | 3.0 | 1.0–2.0 | 766 | $1,266 | $1.65 | 5d | 8 | 0.84mi |
| 3320 Wall Blvd Gretna, LA | 1.0 | 1.0 | 693 | $1,230 | $1.77 | 45d | 1 | 0.88mi |
| 3300 Wall Blvd Gretna, LA | 2.0 | 1.0–2.0 | 720 | $1,090 | $1.51 | 16d | 1 | 0.90mi |
| 2700 Whitney Ave Harvey, LA | 3.0 | 1.0–2.0 | 844 | $1,187 | $1.41 | 4d | 11 | 0.93mi |
| 2201 Manhattan Blvd Harvey, LA | 1.0–2.0 | 1.0–2.0 | 780 | $863 | $1.11 | 3d | 27 | 1.06mi |
| 3251 Wall Blvd Gretna, LA | 1.0–3.0 | 1.0–2.0 | 1174 | $1,320 | $1.12 | 3d | 1 | 1.10mi |
| 520 Wall Blvd Gretna, LA | 1.0–3.0 | 1.0–2.0 | 1000 | $850 | $0.85 | 45d | 9 | 1.14mi |
| 1499 Central Park Blvd Harvey, LA | 1.0–3.0 | 1.0–2.0 | 1002 | $1,545 | $1.54 | 5d | 18 | 1.27mi |
HOA detail
- Monthly dues
- $210 · $2,520/yr
- Likely covers
- watertrashexterior maint.
Listing history 7 events
-
2026-06-21days on market $89,900 Active 6 DOM
-
2026-06-18days on market $89,900 Active 3 DOM
-
2026-06-17days on market $89,900 Active 2 DOM
-
2026-06-16days on market $89,900 Active 1 DOM
-
2026-06-15days on market $89,900 Active 3 DOM
-
2026-06-13remarks 597-char remark
-
2026-06-13$89,900 Active 1 DOM
ⓘ Source: listings_history table (triggers on properties + properties_extension) + one-shot
backfill from property_details.listing_events for pre-trigger history.
Climate risk First Street
- Flood 9/10 Extreme FEMA zone X (shaded) · 60% chance over 30 yrs
- Wildfire 1/10 Low
- Heat 10/10 Extreme 7 d/yr ≥108°F today · 21 d/yr by 30 yrs out
- Wind 10/10 Extreme 99% chance of damaging wind over 30 yrs
- Air quality 2/10 Low 2 unhealthy d/yr today · 2 by 30 yrs out
Nearby sold comps map
Loading sold comps map…
Walkable amenities ~0.75 mi
Loading nearby amenities…
Taxation est. · year 1
- Rental income
- $13,776
- − Mortgage interest
- −$5,036
- − Property taxes
- −$1,348
- − Insurance
- −$1,247
- − Repairs & maintenance
- −$1,102
- − Management
- −$1,102
- − HOA
- −$2,520
- − Depreciation
- −$2,615
- Taxable loss
- −$1,195
- Est. tax savings @ 24.0%
- +$287
- After-tax cash flow
- $397/yr
For passive investors: Depreciation is non-cash, so a rental often shows a tax loss while cash-flowing — sheltering income. Rental losses are passive: they offset passive income freely, and up to $25,000/yr can offset ordinary (W-2) income if you actively participate and your MAGI is under $100k (phasing out to $0 by $150k); unused losses carry forward. On sale, claimed depreciation is recaptured at up to 25%, and gains may owe capital-gains tax (a 1031 exchange can defer both). Figures are a year-1 estimate at your 24.0% rate — not tax advice; consult a CPA.
Schools (NCES district)
- District
- Jefferson Parish
- NCES district ID
- 2200840
- Math proficiency
- 24% ▼ -36.00%
- Reading proficiency
- 34% ▼ -30.00%
- Median HH income
- $48,421
- Composite
- 25.19/100
- National rank
- #7511
- State rank
- #44 of 98 in LA
Livability — Harvey
- Score
- 64/100
- State rank
- #166
- US rank
- #13980
Category grades
Schools grade is shown separately in the Schools card above.
Census & demographics
- Census place
- Harvey, LA
- County
- Jefferson Parish · 426,999 people
- City population
- 39,578
- Metro
- New Orleans-Metairie, LA
- Population (ZIP)
- 39,578
- Household income
- $62,416
- Rent vs Own
- Severe rent burden
- 1992.0
Population outlook (Jefferson County) Hauer SSP2
- Today (2025)
- 451,696 people
- By 2030
- 455,451 · +0.8%
- By 2040
- 458,308 · +1.5%
- By 2050
- 461,031 · +2.1%
- By 2075
- 476,351 · +5.5%
- By 2100
- 499,377 · +10.6%
Race, ethnicity, and origin ACS 2023
- Neighborhood character
- Diverse neighborhood (Simpson 0.60)
- Race & ethnicity
- Black 58% White 20% Hispanic / Latino 13% Asian 7% Two or more races 4%
- Hispanic origin (detail)
- Mexican 1% Dominican 1%
- Common ancestry
- Lithuanian 4% Hispanic 1%
- Foreign-born
- 13% · Canada, Vietnam
- Languages at home
- 81% English-only · Spanish 10% Vietnamese 5% French/Haitian/Cajun 2%
Political lean MEDSL · Jefferson
- 2024 margin
- R (+12.9) · D 42.5% · R 55.5% · Other 2.1%
- 2008→2024 swing
- +13.6pp toward D · 2008: -26.6pp · 2024: -12.9pp
- All cycles
- 2024: R+12.9 2020: R+11.1 2016: R+14.8 2012: R+18.4 2008: R+26.6
Not yet ingested
- Civics
- —
Market trends
- HPI YoY
- ▼ -96.82%
- Current HPI
- 156.1052
- Rent YoY
- ▼ -3.88%
- Metro
- New Orleans-Metairie, LA
- State GDP YoY
- ▲ 3.29%
- F500 in state
- 10
Industry mix (Fortune 500 HQ in LA)
| Industry | F500 HQs | Revenue |
|---|---|---|
| Telecommunications | 2 | $23B |
|
||
| Utilities | 1 | $12B |
|
||
| Wholesale / Distribution | 1 | $5B |
|
||
| Advertising | 1 | $2B |
|
||
Price history
+66.5% since first listed6 events — show timeline
- 2026-06-11 Listed $89,900 AcadianaMLS
- 2026-06-02 Rental Removed $985 RAAMLS
- 2026-05-29 Listed for Rent $985 RAAMLS
- 2026-03-14 Rental Removed $1,400 TURBOTENANT
- 2026-02-13 Listed for Rent $1,400 TURBOTENANT
- 2002-02-15 Listed $54,000 AcadianaMLS
Cash-flow waterfall
monthlySold comps — $/sqft
last 12 mo · ≤1 miLoading sold comps…