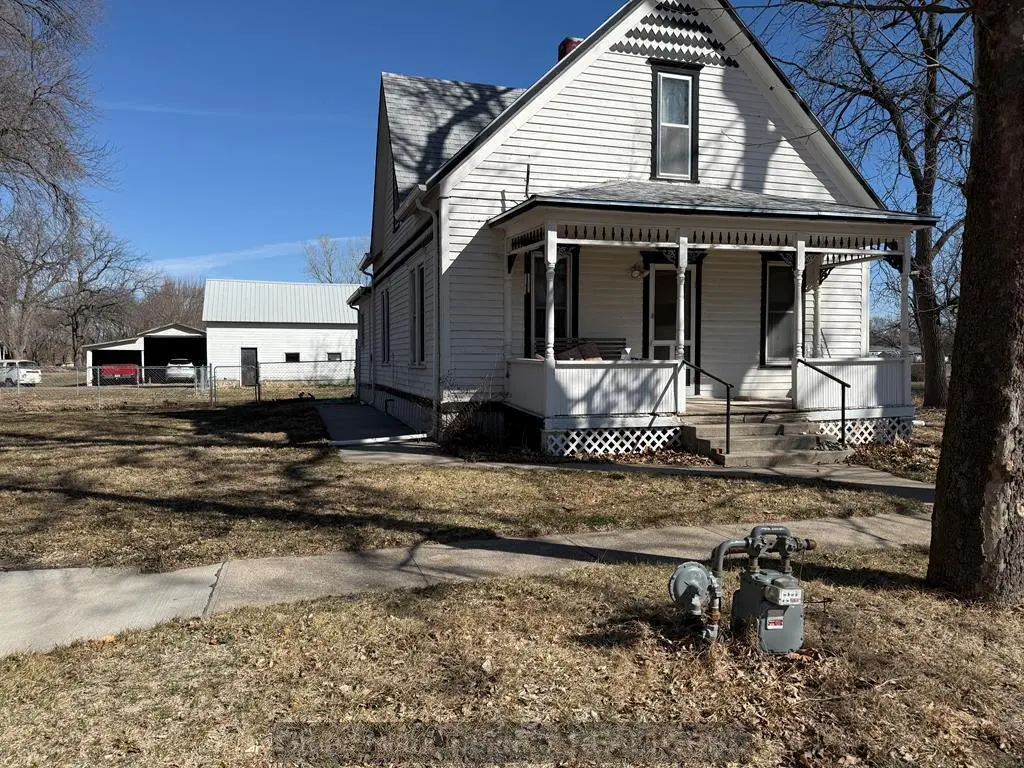
410 E Roger Welsch Ave · Dannebrog, NE
Flood risk 1/10 · Minimal
- FEMA flood zone
- AE
- Chance of flooding over 30 yrs
- 0.0%
- Est. flood insurance / yr
- $2,026 – $9,024
Fire risk 3/10 · Minor
- Est. fire insurance / yr
- $1,161 – $2,155
Heat risk 3/10 · Minor
- Hot days now (above 101°F)
- 7 days/yr
- Hot days in 30 yrs
- 16 days/yr
Wind risk 2/10 · Minimal
- Chance of severe wind over 30 yrs
- —
Air-quality risk 2/10 · Minimal
- Unhealthy air days now
- 1 days/yr
- Unhealthy air days in 30 yrs
- 1 days/yr
Risk factors via First Street. Map © Google.
Why this score? — see what drove the B grade
The composite is a weighted blend of 9 inputs, each scored 0–100. Each bar is that input's sub-score; the figure is the points it added to the 100-point composite (weight × sub-score).
- Cash flow +23.1/30.0
- ARV discount +15.0/15.0
- DSCR +7.4/10.0
- Appreciation +7.0/10.0
- 1% rule +5.5/10.0
- Schools +5.0/10.0
- Livability +3.2/5.0
- Rent growth +2.5/5.0
- Condition / age +2.5/5.0
$110,000
🖨 Deal sheet 📄 Offer letter ✓ Due diligence
Listing remarks MLS
There is operating toilet in basement and a shower a base in basement
Key facts
- 0.55 acre lot
- Garage
- Built 1910
Tags
Neighborhood map
What this means for you Summary
Snapshot
- This is a 3-bed/1.0-bath single-family listed at $110k.
Deal economics
- At list price, monthly cash flow is $-262 ($-3k/yr) — negative.
- To cash-flow at today's rent, offer at most $64k (42.1% below list).
- Meets the 1% rule at list price ($1k rent vs $110k).
- Recommended offer: $64k (42.1% below list) — sets the bar for cash-flow.
Location & tenants
- Location reads 63/100 on livability (#405 in NE) — a middle-class / working-renter tenant base. Strengths: cost of living A+, housing A+; Watch: health & safety C-, employment D+, schools F.
- Centura Public Schools (rural): math 59% / reading 58% proficiency, ranked #22 of 111 in NE (top 20%) — acceptable for families but not a draw, mixed tenant base, ~2y average lease.
- Market conditions: 5 active listings in the ZIP; 21 units permitted in Howard County in 2024 (0 in 5+ unit buildings).
Forward outlook
- In year one you build about $5k of equity ($761 loan paydown + $5k appreciation (4.1% local appreciation)).
- Howard County population projected at +5% by 2050 — modest demand growth; plan on rents tracking national, not racing it.
- By year 7, paydown + projected appreciation supports a ~$34k cash-out refi (75% LTV) — recoverable capital for the next deal without selling this one.
Negotiation context
- It's been on market 94 days — a 9% lower offer ($100k) is reasonable based on typical stale-listing flexibility.
- Current owner paid $88k; 25% above their basis — modest negotiation headroom, anchor on the comps not their cost.
Risks & watch-outs
- Watch-outs: flood insurance adds $460/mo; built in 1910 — expect roof / HVAC / electrical / plumbing capex.
- Climate carrying-cost: in FEMA flood zone AE (mandatory federal flood insurance) — expect insurance premiums to compound above CPI over the hold.
Questions for the listing agent
- What do current leases actually rent for vs. the listed asking? Can we see a recent rent roll and the last 12 months of T-12 income?
- It's been on market 94 days. Have you received any prior offers? Is the seller open to a 42% concession, seller financing, or rate buy-down credit?
- Built in 1910 — when were the roof, HVAC, electrical panel, plumbing, and water heater last replaced?
- What's the actual annual flood-insurance premium (NFIP or private), and is the property in a SFHA with mandatory coverage?
- Why hasn't it sold? Are there any deal-killer items the seller is aware of (foundation, flood, title, zoning, code violations)?
- Is there a deadline driving the sale (1031 exchange, divorce, estate, relocation)? That informs how much negotiation room exists.
- Schools are F-rated, which usually means shorter tenancies and higher turnover. Who's the typical renter profile here, and what's been the actual vacancy rate?
- What's the average days-on-market for RENTAL listings here right now (not sales)? A rising rental-DOM trend means longer vacancies and softer asking-rent achievability than the comps imply.
- What's the recent tenant-quality profile in this submarket — average credit score on applications, eviction rate, late-payment / NSF rate, and stable-employment percentage? A property-management company in the area should have these aggregated.
- How much new for-sale + rental construction is in the pipeline within 1–3 miles? Heavy new supply typically softens prices + rents 12–24 months out; constrained supply supports both.
Investment metrics
- 1% rule
- 1.05% ✓
- Cap rate
- 8.45%
- Cash-on-cash
- 7.72%
- DSCR
- 1.34
- GRM
- 7.9
CMA / ARV
- ARV (median comp)
- $159,047
- List price
- $110,000
- Delta
- -30.84%
- Verdict
- UNDERPRICED
- Comps
- 4 within 1.0 mi
Projected returns pro-forma
4.1% appreciation · 3.0% rent growth · sell at horizon
- IRR
- 1.8%
- Equity multiple
- 1.11×
- Total profit
- $3,334
- Equity at exit
- $56,399
- IRR
- 5.2%
- Equity multiple
- 1.91×
- Total profit
- $27,995
- Equity at exit
- $92,749
Cash invested: $30,800 (down + closing). Projections, not guarantees.
Landlord ↔ Tenant lean methodology
- Overall (STATE)
- 83 Strongly Landlord-Friendly
- State Nebraska
- 83 Strongly Landlord-Friendly · R+13
- County
- — inherits STATE
- City
- — inherits STATE
ZIP-level market 68831
- Home prices YoY
- 2.1%
- Active inventory
- 5
- Price-to-rent
- 7.9×
Monthly cashflow live
- Estimated rent
- $1,155 medium interval (Pro) →
- Mortgage (P&I)
- −$577
- Tax from tax record
- −$92 /mo · $1,105/yr
- Insurance
- −$46
- Flood insurance flood zone
- −$460 /mo · $5,525/yr
- HOA
- −$0
- Vacancy / Maint / Mgmt
- −$243
- Net cashflow
- $-262
Break-even live
UW: 25.0% down · 7.5% · 30yr · 1.5% tax · 5.0% vac · 8.0% maint · 8.0% mgmt
Financing live
Cash to close
- Down payment
- $27,500
- Closing costs
- $3,300
- Reserves months
- —
- Total cash needed
- —
Loan-product check · same deal, 3 products live
Conventional
25% down · 7.5% · 30yr
- Down + closing
- —
- Monthly P&I
- —
- Monthly cashflow
- —
- DSCR
- —
- Eligible?
- —
Personal DTI + credit; lowest rate.
DSCR
20% down · 8.5% · 30yr
- Down + closing
- —
- Monthly P&I
- —
- Monthly cashflow
- —
- DSCR
- —
- Eligible?
- —
No personal income docs; deal must DSCR.
Hard money
10% down · 12.0% · 12mo
- Down + closing
- —
- Monthly P&I
- —
- Monthly cashflow
- —
- DSCR
- —
- Eligible?
- —
Short-term bridge; refi at stabilization.
Listing history 16 events
-
2026-06-19days on market $110,000 Active 94 DOM
-
2026-06-18days on market $110,000 Active 93 DOM
-
2026-06-17days on market $110,000 Active 92 DOM
-
2026-06-16days on market $110,000 Active 91 DOM
-
2026-06-15days on market $110,000 Active 90 DOM
-
2026-06-14days on market $110,000 Active 88 DOM
-
2026-06-12days on market $110,000 Active 87 DOM
-
2026-06-09days on market $110,000 Active 84 DOM
-
2026-06-08days on market $110,000 Active 83 DOM
-
2026-06-07days on market $110,000 Active 82 DOM
-
2026-06-02days on market $110,000 Active 77 DOM
-
2026-06-01days on market $110,000 Active 76 DOM
-
2026-05-31days on market $110,000 Active 75 DOM
-
2026-05-30days on market $110,000 Active 74 DOM
-
2026-03-17$110,000 Active 69-char remark
Show marketing remark (69 chars)
There is operating toilet in basement and a shower a base in basement
-
2021-11-22soldstatus $88,000
ⓘ Source: listings_history table (triggers on properties + properties_extension) + one-shot
backfill from property_details.listing_events for pre-trigger history.
Tax reassessment forecast NE · Resets to sale price
- Current annual tax
- $1,105 · $92/mo
- Projected year-2 tax
- $1,903 · $159/mo
- Expected delta
- +$798/yr (+$66/mo · 72.1%)
ⓘ Screening estimate from a state-policy table — verify with the county assessor before closing.
Climate risk First Street
- Flood 1/10 Low FEMA zone AE · 0% chance over 30 yrs
- Wildfire 3/10 Moderate
- Heat 3/10 Moderate 7 d/yr ≥101°F today · 16 d/yr by 30 yrs out
- Wind 2/10 Low
- Air quality 2/10 Low 1 unhealthy d/yr today · 1 by 30 yrs out
Nearby sold comps map
Loading sold comps map…
Walkable amenities ~0.75 mi
Loading nearby amenities…
Taxation est. · year 1
- Rental income
- $13,866
- − Mortgage interest
- −$6,162
- − Property taxes
- −$1,105
- − Insurance
- −$6,075
- − Repairs & maintenance
- −$1,109
- − Management
- −$1,109
- − Depreciation
- −$3,200
- Taxable loss
- −$4,895
- Est. tax savings @ 24.0%
- +$1,175
- After-tax cash flow
- $-1,974/yr
For passive investors: Depreciation is non-cash, so a rental often shows a tax loss while cash-flowing — sheltering income. Rental losses are passive: they offset passive income freely, and up to $25,000/yr can offset ordinary (W-2) income if you actively participate and your MAGI is under $100k (phasing out to $0 by $150k); unused losses carry forward. On sale, claimed depreciation is recaptured at up to 25%, and gains may owe capital-gains tax (a 1031 exchange can defer both). Figures are a year-1 estimate at your 24.0% rate — not tax advice; consult a CPA.
Schools (NCES district)
- District
- Centura Public Schools
- NCES district ID
- 3162950
- Math proficiency
- 59% ▲ 2.00%
- Reading proficiency
- 58% ▲ 2.00%
- Median HH income
- $55,438
- Composite
- 50.37/100
- National rank
- #1874
- State rank
- #22 of 111 in NE
Livability — Dannebrog
- Score
- 63/100
- State rank
- #405
- US rank
- #15427
Category grades
Schools grade is shown separately in the Schools card above.
Census & demographics
- Census place
- Dannebrog, NE
- Population (ZIP)
- 768
Population outlook (Howard County) Hauer SSP2
- Today (2025)
- 6,621 people
- By 2030
- 6,709 · +1.3%
- By 2040
- 6,859 · +3.6%
- By 2050
- 6,955 · +5.0%
- By 2075
- 7,308 · +10.4%
- By 2100
- 7,266 · +9.7%
Race, ethnicity, and origin ACS 2023
- Neighborhood character
- Predominantly White (93%)
- Race & ethnicity
- White 93% Hispanic / Latino 5% Two or more races 3%
- Common ancestry
- Romanian 6% Portuguese 2% Slovak 2%
- Foreign-born
- 1% · Canada
- Languages at home
- 96% English-only · Spanish 4%
Political lean MEDSL · Howard
- 2024 margin
- Solid R (+62.7) · D 18.1% · R 80.8% · Other 1.1%
- 2008→2024 swing
- -37.2pp toward R · 2008: -25.5pp · 2024: -62.7pp
- All cycles
- 2024: R+62.7 2020: R+60.9 2016: R+58.8 2012: R+34.2 2008: R+25.5
Not yet ingested
- Civics
- —
Market trends
- HPI YoY
- ▲ 4.10%
- Current HPI
- 200.6578
- Rent YoY
- —
- Metro
- —
- State GDP YoY
- ▲ 0.68%
- F500 in state
- 2
Industry mix (Fortune 500 HQ in NE)
| Industry | F500 HQs | Revenue |
|---|---|---|
| Conglomerate | 1 | $371B |
|
||
Price history
+25.0% since first listed2 events — show timeline
- 2026-03-17 Listed $110,000 GIBOR
- 2021-11-22 Sold (Public Records) $88,000 Public Records
Property tax history
+24.5%/yrLatest (2025): $1,105 · -3.2% YoY. Source: county tax records.
Cash-flow waterfall
monthlySold comps — $/sqft
last 12 mo · ≤1 miLoading sold comps…