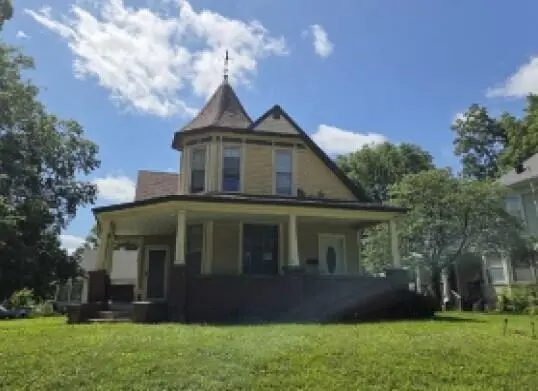
2001 1st Ave · Perry, IA
Flood risk 1/10 · Minimal
- FEMA flood zone
- X (unshaded)
- Chance of flooding over 30 yrs
- 0.0%
- Est. flood insurance / yr
- $473 – $860
Fire risk 3/10 · Minor
- Est. fire insurance / yr
- $902 – $1,676
Heat risk 3/10 · Minor
- Hot days now (above 103°F)
- 7 days/yr
- Hot days in 30 yrs
- 15 days/yr
Wind risk 2/10 · Minimal
- Chance of severe wind over 30 yrs
- —
Air-quality risk 1/10 · Minimal
- Unhealthy air days now
- 0 days/yr
- Unhealthy air days in 30 yrs
- 0 days/yr
Risk factors via First Street. Map © Google.
Why this score? — see what drove the D+ grade
The composite is a weighted blend of 9 inputs, each scored 0–100. Each bar is that input's sub-score; the figure is the points it added to the 100-point composite (weight × sub-score).
- ARV discount +15.0/15.0
- Cash flow +11.3/30.0
- Schools +4.6/10.0
- 1% rule +4.0/10.0
- Livability +3.7/5.0
- DSCR +3.3/10.0
- Rent growth +2.5/5.0
- Condition / age +2.5/5.0
- Appreciation +0.0/10.0
$115,500
🖨 Deal sheet 📄 Offer letter ✓ Due diligence
Listing remarks MLS
This inviting 1.5 story home blends timeless architecture with functional layout. The main level offers a comfortable flow and features a spacious living room, formal dining room, bedroom, a full bath and nice sized kitchen with plenty of workspace. The second floor includes 2 additional bedrooms, and a bath, plus an unfinished basement and attached garage Auction, cash only, no physical access and no showings
Key facts
- Formal dining room
- Unfinished basement
- Functional layout
Tags
Neighborhood map
What this means for you Summary
Snapshot
- This is a 3-bed/2.0-bath other listed at $116k.
Deal economics
- At list price, monthly cash flow is $-42 ($-509/yr) — negative.
- To cash-flow at today's rent, offer at most $108k (6.5% below list).
- To meet the 1% rule (rent ≥ 1% of price), the offer needs to be $104k (10.3% below list).
- Recommended offer: $104k (10.3% below list) — sets the bar for 1% rule.
- Cap rate 5.9% vs local median 3.9% in Perry — top-decile yield for the area; either an underpriced asset or a hidden risk that comps aren't pricing in. Stress-test before assuming the spread holds.
Location & tenants
- Location reads 73/100 on livability (#273 in IA) — a middle-class / working-renter tenant base. Strengths: cost of living A+, housing A+, health & safety A+; Watch: amenities F, commute F, employment D-.
- Perry Community School District (town): math 51% / reading 59% proficiency, ranked #266 of 289 in IA (top 92%) — acceptable for families but not a draw, mixed tenant base, ~2y average lease; 61% free/reduced lunch — lower-income household profile, screen leases tightly.
- Market conditions: 49 active listings in the ZIP; 8 comparable units currently listed for rent nearby; rentals lingering (median 44d on market — plan ~5-8 weeks vacancy on turnover, expect pricing pressure); 62% of comp listings sitting > 30 days — soft ceiling on asking rent; 1,503 units permitted in Dallas County in 2024 (630 in 5+ unit buildings).
Forward outlook
- Local home prices are declining (-3.0%/yr); year-one equity from $799 of loan paydown is wiped out by about $3k of value loss. Plan a longer hold.
- Dallas County population projected at +74% by 2050 — long-run rental-demand tailwind backs the buy-and-hold thesis.
Negotiation context
- It's been on market 106 days — a 9% lower offer ($105k) is reasonable based on typical stale-listing flexibility.
- 3 sale attempts since 8y ago with the ask held roughly flat each time — persistent listings suggest the price (not the market) is what's stuck; bring a comps-based counter.
Risks & watch-outs
- Watch-outs: built in 1890 — expect roof / HVAC / electrical / plumbing capex.
Questions for the listing agent
- What do current leases actually rent for vs. the listed asking? Can we see a recent rent roll and the last 12 months of T-12 income?
- It's been on market 106 days. Have you received any prior offers? Is the seller open to a 10% concession, seller financing, or rate buy-down credit?
- Built in 1890 — when were the roof, HVAC, electrical panel, plumbing, and water heater last replaced?
- Why hasn't it sold? Are there any deal-killer items the seller is aware of (foundation, flood, title, zoning, code violations)?
- Is there a deadline driving the sale (1031 exchange, divorce, estate, relocation)? That informs how much negotiation room exists.
- The area grade is low — what's the realistic commute time and amenity access for the typical tenant pool here? Any planned neighborhood developments (good or bad) we should know about?
- What's the average days-on-market for RENTAL listings here right now (not sales)? A rising rental-DOM trend means longer vacancies and softer asking-rent achievability than the comps imply.
- What's the recent tenant-quality profile in this submarket — average credit score on applications, eviction rate, late-payment / NSF rate, and stable-employment percentage? A property-management company in the area should have these aggregated.
- How much new for-sale + rental construction is in the pipeline within 1–3 miles? Heavy new supply typically softens prices + rents 12–24 months out; constrained supply supports both.
Investment metrics
- 1% rule
- 0.90% ✗
- Cap rate
- 5.85%
- Cash-on-cash
- -1.57%
- DSCR
- 0.93
- GRM
- 9.3
CMA / ARV
- ARV (median comp)
- $173,195
- List price
- $115,500
- Delta
- -33.31%
- Verdict
- UNDERPRICED
- Comps
- 20 within 1.0 mi
Projected returns pro-forma
-3.0% appreciation · 3.0% rent growth · sell at horizon
- IRR
- -18.8%
- Equity multiple
- 0.34×
- Total profit
- $-21,363
- Equity at exit
- $17,221
- IRR
- -11.2%
- Equity multiple
- 0.32×
- Total profit
- $-21,860
- Equity at exit
- $9,986
Cash invested: $32,340 (down + closing). Projections, not guarantees.
Landlord ↔ Tenant lean methodology
- Overall (STATE)
- 83 Strongly Landlord-Friendly
- State Iowa
- 83 Strongly Landlord-Friendly · R+6
- County
- — inherits STATE
- City
- — inherits STATE
ZIP-level market 50220
- Home prices YoY
- -30.2%
- Active inventory
- 49
- Price-to-rent
- 9.3×
Monthly cashflow live
- Estimated rent
- $1,036 high interval (Pro) →
- Mortgage (P&I)
- −$606
- Tax from tax record
- −$207 /mo · $2,486/yr
- Insurance
- −$48
- HOA
- −$0
- Vacancy / Maint / Mgmt
- −$218
- Net cashflow
- $-42
Break-even live
UW: 25.0% down · 7.5% · 30yr · 1.5% tax · 5.0% vac · 8.0% maint · 8.0% mgmt
Financing live
Cash to close
- Down payment
- $28,875
- Closing costs
- $3,465
- Reserves months
- —
- Total cash needed
- —
Loan-product check · same deal, 3 products live
Conventional
25% down · 7.5% · 30yr
- Down + closing
- —
- Monthly P&I
- —
- Monthly cashflow
- —
- DSCR
- —
- Eligible?
- —
Personal DTI + credit; lowest rate.
DSCR
20% down · 8.5% · 30yr
- Down + closing
- —
- Monthly P&I
- —
- Monthly cashflow
- —
- DSCR
- —
- Eligible?
- —
No personal income docs; deal must DSCR.
Hard money
10% down · 12.0% · 12mo
- Down + closing
- —
- Monthly P&I
- —
- Monthly cashflow
- —
- DSCR
- —
- Eligible?
- —
Short-term bridge; refi at stabilization.
Rent comps 8 comps
| Address | Beds | Baths | Sqft | Rent | $/sqft | DOM | Units | Dist |
|---|---|---|---|---|---|---|---|---|
| 1313 1st Ave Perry, IA | 2.0 | 1.0 | 806 | $700 | $0.87 | 43d | 1 | 0.48mi |
| 2709 1st Ave Perry, IA | 2.0 | 1.5 | 992 | $950 | $0.96 | 43d | 1 | 0.65mi |
| 913 Willis Ave Perry, IA | 1.0–2.0 | 1.0–2.0 | 882 | $1,000 | $1.13 | 14d | 1 | 0.70mi |
| 1011 Evelyn St Unit 1 Perry, IA | 2.0 | 2.0 | 1000 | $895 | $0.90 | 14d | 1 | 0.82mi |
| 2105 Willis Ave Perry, IA | 3.0 | 2.5 | 1029 | $1,595 | $1.55 | 43d | 1 | 0.99mi |
| 2103 Willis Ave Perry, IA | 3.0 | 2.5 | 1029 | $1,595 | $1.55 | 23d | 1 | 1.02mi |
| 303 8th St Unit 1 Perry, IA | 2.0 | 1.0 | 750 | $850 | $1.13 | 43d | 1 | 1.36mi |
| 2516 Perry Park Ave Unit A Perry, IA | 3.0 | 1.0 | 966 | $850 | $0.88 | 43d | 1 | 1.38mi |
Listing history 27 events
-
2026-06-18days on market $115,500 Active 106 DOM
-
2026-06-17days on market $115,500 Active 105 DOM
-
2026-06-16days on market $115,500 Active 104 DOM
-
2026-06-15days on market $115,500 Active 103 DOM
-
2026-06-14days on market $115,500 Active 101 DOM
-
2026-06-10days on market $115,500 Active 98 DOM
-
2026-06-09days on market $115,500 Active 97 DOM
-
2026-06-08days on market $115,500 Active 96 DOM
-
2026-06-07days on market $115,500 Active 95 DOM
-
2026-06-05days on market $115,500 Active 92 DOM
-
2026-06-03days on market $115,500 Active 91 DOM
-
2026-06-02days on market $115,500 Active 90 DOM
-
2026-06-01days on market $115,500 Active 89 DOM
-
2026-05-31days on market $115,500 Active 88 DOM
-
2026-05-31days on market $115,500 Active 87 DOM
-
2026-03-03$115,500 Active 413-char remark
Show marketing remark (413 chars)
This inviting 1.5 story home blends timeless architecture with functional layout. The main level offers a comfortable flow and features a spacious living room, formal dining room, bedroom, a full bath and nice sized kitchen with plenty of workspace. The second floor includes 2 additional bedrooms, and a bath, plus an unfinished basement and attached garage Auction, cash only, no physical access and no showings
-
2024-02-29historical
-
2024-01-31price $115,000
-
2024-01-24price $125,000
-
2024-01-05$138,000 Active
-
2018-09-28soldstatus $114,875
-
2018-09-26soldstatus $115,000 Sold
-
2018-09-10status Pending
-
2018-08-20$115,000 Active
-
2015-05-07soldstatus $73,500
-
2006-12-08soldstatus $68,000
-
2000-05-26soldstatus $45,000
ⓘ Source: listings_history table (triggers on properties + properties_extension) + one-shot
backfill from property_details.listing_events for pre-trigger history.
Tax reassessment forecast IA · Partial reset (capped growth)
- Current annual tax
- $2,486 · $207/mo
- Projected year-2 tax
- $2,486 · $207/mo
- Expected delta
- $0/yr ($0/mo · 0.0%)
ⓘ Screening estimate from a state-policy table — verify with the county assessor before closing.
Climate risk First Street
- Flood 1/10 Low FEMA zone X (unshaded) · 0% chance over 30 yrs
- Wildfire 3/10 Moderate
- Heat 3/10 Moderate 7 d/yr ≥103°F today · 15 d/yr by 30 yrs out
- Wind 2/10 Low
- Air quality 1/10 Low 0 unhealthy d/yr today · 0 by 30 yrs out
Nearby sold comps map
Loading sold comps map…
Walkable amenities ~0.75 mi
Loading nearby amenities…
Taxation est. · year 1
- Rental income
- $12,434
- − Mortgage interest
- −$6,470
- − Property taxes
- −$2,486
- − Insurance
- −$578
- − Repairs & maintenance
- −$995
- − Management
- −$995
- − Depreciation
- −$3,360
- Taxable loss
- −$2,449
- Est. tax savings @ 24.0%
- +$588
- After-tax cash flow
- $79/yr
For passive investors: Depreciation is non-cash, so a rental often shows a tax loss while cash-flowing — sheltering income. Rental losses are passive: they offset passive income freely, and up to $25,000/yr can offset ordinary (W-2) income if you actively participate and your MAGI is under $100k (phasing out to $0 by $150k); unused losses carry forward. On sale, claimed depreciation is recaptured at up to 25%, and gains may owe capital-gains tax (a 1031 exchange can defer both). Figures are a year-1 estimate at your 24.0% rate — not tax advice; consult a CPA.
Schools (NCES district)
- District
- Perry Community School District
- NCES district ID
- 1922530
- Math proficiency
- 51% ▼ -8.00%
- Reading proficiency
- 59% ▲ 3.00%
- Median HH income
- $44,382
- Composite
- 46.37/100
- National rank
- #2460
- State rank
- #266 of 289 in IA
Livability — Perry
- Score
- 73/100
- State rank
- #273
- US rank
- #5276
Category grades
Schools grade is shown separately in the Schools card above.
Census & demographics
- Census place
- Perry, IA
- City population
- 9,251
- Population (ZIP)
- 9,251
Population outlook (Dallas County) Hauer SSP2
- Today (2025)
- 111,904 people
- By 2030
- 127,807 · +14.2%
- By 2040
- 160,576 · +43.5%
- By 2050
- 194,154 · +73.5%
- By 2075
- 271,895 · +143.0%
- By 2100
- 326,525 · +191.8%
Race, ethnicity, and origin ACS 2023
- Neighborhood character
- Predominantly White (69%)
- Race & ethnicity
- White 69% Hispanic / Latino 27% Two or more races 8% Black 2% Native American 1%
- Hispanic origin (detail)
- Mexican 24%
- Common ancestry
- Iranian 2% Slovak 2% Portuguese 2%
- Foreign-born
- 16% · Canada
- Languages at home
- 75% English-only · Spanish 22% German/W. Germanic 1% Arabic 0%
Political lean MEDSL · Dallas
- 2024 margin
- Toss-up / Even · D 46.9% · R 51.7% · Other 1.4%
- 2008→2024 swing
- +0.8pp no change · 2008: -5.5pp · 2024: -4.8pp
- All cycles
- 2024: R+4.8 2020: R+2.0 2016: R+9.6 2012: R+11.8 2008: R+5.5
Not yet ingested
- Civics
- —
Market trends
- HPI YoY
- ▼ -91.94%
- Current HPI
- 212.8459
- Rent YoY
- —
- Metro
- —
- State GDP YoY
- ▲ 2.48%
- F500 in state
- 4
Industry mix (Fortune 500 HQ in IA)
| Industry | F500 HQs | Revenue |
|---|---|---|
| Financial Services | 1 | $16B |
|
||
| Retail / Convenience | 1 | $15B |
|
||
Price history
+156.7% since first listed12 events — show timeline
- 2026-03-03 Listed $115,500 SWIAR
- 2024-02-29 Listing Removed — DMMLS
- 2024-01-31 Price Changed $115,000 DMMLS
- 2024-01-24 Price Changed $125,000 DMMLS
- 2024-01-05 Listed $138,000 DMMLS
- 2018-09-28 Sold (Public Records) $114,875 Public Records
- 2018-09-26 Sold (MLS) $115,000 DMMLS
- 2018-09-10 Pending — DMMLS
- 2018-08-20 Listed $115,000 DMMLS
- 2015-05-07 Sold (Public Records) $73,500 Public Records
- 2006-12-08 Sold (Public Records) $68,000 Public Records
- 2000-05-26 Sold (Public Records) $45,000 Public Records
Property tax history
+6.7%/yrLatest (2025): $2,486 · +1.3% YoY. Source: county tax records.
Cash-flow waterfall
monthlySold comps — $/sqft
last 12 mo · ≤1 miLoading sold comps…