4550 Biddeford Ave #42 · West Palm Beach, FL
Flood risk 1/10 · Minimal
- FEMA flood zone
- X (unshaded)
- Chance of flooding over 30 yrs
- 0.0%
- Est. flood insurance / yr
- $507 – $1,088
Fire risk 1/10 · Minimal
- Est. fire insurance / yr
- $947 – $1,759
Heat risk 10/10 · Severe
- Hot days now (above 106°F)
- 7 days/yr
- Hot days in 30 yrs
- 27 days/yr
Wind risk 10/10 · Severe
- Chance of severe wind over 30 yrs
- 99.0%
Air-quality risk 2/10 · Minimal
- Unhealthy air days now
- 1 days/yr
- Unhealthy air days in 30 yrs
- 1 days/yr
Risk factors via First Street. Map © Google.
Why this score? — see what drove the D grade
The composite is a weighted blend of 9 inputs, each scored 0–100. Each bar is that input's sub-score; the figure is the points it added to the 100-point composite (weight × sub-score).
- Cash flow +12.3/30.0
- ARV discount +7.5/15.0
- Schools +4.3/10.0
- Livability +4.1/5.0
- 1% rule +4.0/10.0
- DSCR +3.6/10.0
- Rent growth +2.5/5.0
- Condition / age +2.5/5.0
- Appreciation +0.0/10.0
$339,000
🖨 Deal sheet 📄 Offer letter ✓ Due diligence
Listing remarks MLS
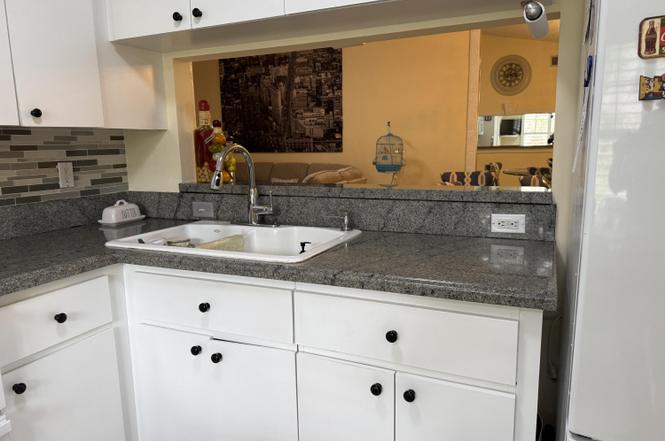
Come and see this upgraded 3/2 condo home. Freshly painted with new carpeting, this home features granite counters in the kitchen, plantation shutters, double sink in the master bath with walk in closet and space for any home owner. This home has hurricane shutters for the entire unit Come and see soon. This home won't last long on the market.
Key facts
- Cbs corner villa
- Clubhouse has a gym
- 4,665 sq ft lot
Tags
Property features AI
Finance
- HOA & community: Homeowners association with monthly fee of $465; Association amenities include jogging path; Pets allowed with possible restrictions and breed limitations
Exterior
- Parking: Attached garage (1 car); 1 covered parking space
- Utilities: Public water; Public sewer; Water and sewer available
- Home design: Villa; Single-story; Faces east; Resale property
- Construction: Concrete / CBS construction; Built with public-records living area of 1,263 (total building area 1,640)
- Exterior features: Patio; Not waterfront
Interior
- Kitchen: Disposal; Dishwasher; Electric range; Microwave; Refrigerator
- Bedrooms: Main-level bedroom
- Bathrooms: 2 full bathrooms (1 on main level)
- Heating & cooling: Central electric heating; Central air conditioning; Ceiling fans
- Interior features: Walk-in closets; Split bedroom layout; Unfurnished
Neighborhood map
What this means for you Summary
Snapshot
- This is a 3-bed/2.0-bath single-family listed at $339k.
Deal economics
- At list price, monthly cash flow is $-63 ($-758/yr) — negative.
- To cash-flow at today's rent, offer at most $328k (3.3% below list).
- To meet the 1% rule (rent ≥ 1% of price), the offer needs to be $306k (9.8% below list).
- Recommended offer: $298k (12.0% below list) — sets the bar for market timing.
- Cap rate 6.1% vs local median 3.8% in West Palm Beach — top-decile yield for the area; either an underpriced asset or a hidden risk that comps aren't pricing in. Stress-test before assuming the spread holds.
Location & tenants
- Location reads 82/100 on livability (#75 in FL, #1,255 nationally) — a professional / high-income tenant draw. Strengths: commute A+, housing A+, health & safety A+; Watch: employment C-, crime F.
- Palm Beach (suburban): math 46% / reading 53% proficiency, ranked #34 of 73 in FL (top 47%) — families likely to look elsewhere, expect single-tenant / working-renter base with shorter leases.
- Market conditions: Rents flat; 473 active listings in the ZIP; 11 comparable units currently listed for rent nearby; rentals at typical pace (median 18d on market — plan ~3-4 weeks tenant-placement turnaround); 3,974 units permitted in Palm Beach County in 2024 (1,012 in 5+ unit buildings).
- At $3,057/mo this rent would consume 71% of the median local household income ($52k/yr) (locally 2548% of renters already pay >50% of income on rent) — very limited rent-growth headroom before tenants either downsize or default.
Forward outlook
- Local home prices are declining (-3.0%/yr); year-one equity from $2k of loan paydown is wiped out by about $10k of value loss. Plan a longer hold.
- Palm Beach County population projected at +30% by 2050 — long-run rental-demand tailwind backs the buy-and-hold thesis.
Negotiation context
- It's been on market 126 days — a 12% lower offer ($298k) is reasonable based on typical stale-listing flexibility.
- 14 sale attempts since 26y ago with the ask held roughly flat each time — persistent listings suggest the price (not the market) is what's stuck; bring a comps-based counter.
- Current owner paid $120k; list at $339k implies a 182% gain — meaningful room to come down on a strong offer.
Risks & watch-outs
- Climate carrying-cost: severe wind risk, 99% chance of damaging wind over 30y; extreme-heat days projected 7→27/yr by 2055 (HVAC capex compounding) — expect insurance premiums to compound above CPI over the hold.
Questions for the listing agent
- What do current leases actually rent for vs. the listed asking? Can we see a recent rent roll and the last 12 months of T-12 income?
- It's been on market 126 days. Have you received any prior offers? Is the seller open to a 12% concession, seller financing, or rate buy-down credit?
- What does the HOA fee cover, when was the last increase, and are there any pending special assessments or reserve-fund shortfalls?
- Why hasn't it sold? Are there any deal-killer items the seller is aware of (foundation, flood, title, zoning, code violations)?
- Is there a deadline driving the sale (1031 exchange, divorce, estate, relocation)? That informs how much negotiation room exists.
- Crime grade is F in this area — have there been break-ins, vandalism, or insurance claims at this property in the last 3 years? What carrier currently insures it and at what premium?
- The area grade is low — what's the realistic commute time and amenity access for the typical tenant pool here? Any planned neighborhood developments (good or bad) we should know about?
- What's the average days-on-market for RENTAL listings here right now (not sales)? A rising rental-DOM trend means longer vacancies and softer asking-rent achievability than the comps imply.
- What's the recent tenant-quality profile in this submarket — average credit score on applications, eviction rate, late-payment / NSF rate, and stable-employment percentage? A property-management company in the area should have these aggregated.
- How much new for-sale + rental construction is in the pipeline within 1–3 miles? Heavy new supply typically softens prices + rents 12–24 months out; constrained supply supports both.
Investment metrics
- 1% rule
- 0.90% ✗
- Cap rate
- 6.07%
- Cash-on-cash
- -0.80%
- DSCR
- 0.96
- GRM
- 9.2
CMA / ARV
No comps found within radius.
Projected returns pro-forma
-3.0% appreciation · 0.02% rent growth · sell at horizon
- IRR
- -21.2%
- Equity multiple
- 0.29×
- Total profit
- $-67,726
- Equity at exit
- $50,546
- IRR
- -24.4%
- Equity multiple
- -0.03×
- Total profit
- $-98,041
- Equity at exit
- $29,311
Cash invested: $94,920 (down + closing). Projections, not guarantees.
Landlord ↔ Tenant lean methodology
- Overall (STATE)
- 87 Strongly Landlord-Friendly
- State Florida
- 87 Strongly Landlord-Friendly · R+3
- County
- — inherits STATE
- City
- — inherits STATE
ZIP-level market 33417
- Home prices YoY
- -29.2%
- Rents YoY
- 0.0%
- Active inventory
- 473
- Price-to-rent
- 9.2×
Monthly cashflow live
- Estimated rent
- $3,057 high interval (Pro) →
- Mortgage (P&I)
- −$1,778
- Tax from tax record
- −$94 /mo · $1,132/yr
- Insurance
- −$141
- HOA
- −$465
- Vacancy / Maint / Mgmt
- −$642
- Net cashflow
- $-63
Break-even live
UW: 25.0% down · 7.5% · 30yr · 1.5% tax · 5.0% vac · 8.0% maint · 8.0% mgmt
Financing live
Cash to close
- Down payment
- $84,750
- Closing costs
- $10,170
- Reserves months
- —
- Total cash needed
- —
Loan-product check · same deal, 3 products live
Conventional
25% down · 7.5% · 30yr
- Down + closing
- —
- Monthly P&I
- —
- Monthly cashflow
- —
- DSCR
- —
- Eligible?
- —
Personal DTI + credit; lowest rate.
DSCR
20% down · 8.5% · 30yr
- Down + closing
- —
- Monthly P&I
- —
- Monthly cashflow
- —
- DSCR
- —
- Eligible?
- —
No personal income docs; deal must DSCR.
Hard money
10% down · 12.0% · 12mo
- Down + closing
- —
- Monthly P&I
- —
- Monthly cashflow
- —
- DSCR
- —
- Eligible?
- —
Short-term bridge; refi at stabilization.
Rent comps 11 comps
| Address | Beds | Baths | Sqft | Rent | $/sqft | DOM | Units | Dist |
|---|---|---|---|---|---|---|---|---|
| 4400 Portofino Way West Palm Beach, FL | 1.0–3.0 | 1.0–2.0 | 1222 | $3,108 | $2.54 | 17d | 60 | 0.18mi |
| 4385 Willow Brook Cir West Palm Beach, FL | 3.0 | 2.0 | 1468 | $3,200 | $2.18 | 22d | 1 | 0.25mi |
| 4567 Brook Dr West Palm Beach, FL | 3.0 | 2.0 | 1528 | $3,000 | $1.96 | 24d | 1 | 0.29mi |
| 1912 Stratford Way West Palm Beach, FL | 2.0 | 2.5 | 1350 | $3,000 | $2.22 | 24d | 1 | 0.56mi |
| 1211 Pine Sage Cir West Palm Beach, FL | 3.0 | 2.0 | 1367 | $3,200 | $2.34 | 5d | 1 | 1.01mi |
| 3810 Rowena Cir West Palm Beach, FL | 2.0 | 2.0 | 1505 | $3,000 | $1.99 | 7d | 1 | 1.07mi |
| 3810 Rowena Cir West Palm Beach, FL | 2.0 | 2.0 | 1505 | $3,150 | $2.09 | 13d | 1 | 1.07mi |
| 3590 Village Blvd West Palm Beach, FL | 1.0–3.0 | 1.0–2.0 | 1074 | $3,385 | $3.15 | 1d | 29 | 1.36mi |
| 2480 Presidential Way #902 West Palm Beach, FL | 2.0 | 2.0 | 1855 | $4,650 | $2.51 | 5d | 1 | 1.46mi |
| 2480 Presidential Way #1903 West Palm Beach, FL | 2.0 | 2.0 | 1855 | $4,650 | $2.51 | 24d | 1 | 1.46mi |
| 1979 Brandywine Rd Unit 1979-108 West Palm Beach, FL | 3.0 | 2.0 | 1395 | $3,205 | $2.30 | 24d | 1 | 1.49mi |
HOA detail
- Monthly dues
- $465 · $5,580/yr
Listing history 46 events
-
2026-06-07status $339,000 Pending 126 DOM
-
2026-06-04days on market $339,000 Active 126 DOM
-
2026-06-03days on market $339,000 Active 125 DOM
-
2026-06-01days on market $339,000 Active 123 DOM
-
2026-05-31days on market $339,000 Active 122 DOM
-
2026-03-18price $339,000
-
2026-01-29$349,000 Active
-
2024-08-04status Pending
-
2024-08-03historical
-
2024-05-05price $395,000
-
2024-03-07price $429,000
-
2024-02-14$449,500 Active
-
2015-03-16soldstatus $120,000
-
2015-03-12soldstatus $120,000 Closed 345-char remark
Show marketing remark (345 chars)
Come and see this upgraded 3/2 condo home. Freshly painted with new carpeting, this home features granite counters in the kitchen, plantation shutters, double sink in the master bath with walk in closet and space for any home owner. This home has hurricane shutters for the entire unit Come and see soon. This home won't last long on the market.
-
2015-03-01status Pending 345-char remark
Show marketing remark (345 chars)
Come and see this upgraded 3/2 condo home. Freshly painted with new carpeting, this home features granite counters in the kitchen, plantation shutters, double sink in the master bath with walk in closet and space for any home owner. This home has hurricane shutters for the entire unit Come and see soon. This home won't last long on the market.
-
2015-02-04price $129,000 345-char remark
Show marketing remark (345 chars)
Come and see this upgraded 3/2 condo home. Freshly painted with new carpeting, this home features granite counters in the kitchen, plantation shutters, double sink in the master bath with walk in closet and space for any home owner. This home has hurricane shutters for the entire unit Come and see soon. This home won't last long on the market.
-
2015-01-14price $131,500 345-char remark
Show marketing remark (345 chars)
Come and see this upgraded 3/2 condo home. Freshly painted with new carpeting, this home features granite counters in the kitchen, plantation shutters, double sink in the master bath with walk in closet and space for any home owner. This home has hurricane shutters for the entire unit Come and see soon. This home won't last long on the market.
-
2014-12-17$135,000 Active 345-char remark
Show marketing remark (345 chars)
Come and see this upgraded 3/2 condo home. Freshly painted with new carpeting, this home features granite counters in the kitchen, plantation shutters, double sink in the master bath with walk in closet and space for any home owner. This home has hurricane shutters for the entire unit Come and see soon. This home won't last long on the market.
-
2014-10-11historical
-
2014-06-09$125,000 Active
-
2014-05-31historical
-
2014-05-14status Active
-
2014-04-21status Pending
-
2014-04-14status Active
-
2014-04-08status Pending
-
2014-03-14$125,000 Active
-
2013-09-22historical
-
2013-09-21historical
-
2010-01-27historical
-
2009-12-08$150,000
-
2008-01-29historical
-
2007-09-28$199,500
-
2007-02-02$249,900
-
2001-09-17soldstatus $98,000
-
2001-08-31soldstatus $98,000
-
2001-08-08historical
-
2001-07-19historical
-
2001-07-17$102,000
-
2001-03-21$100,900
-
2001-02-20$100,900
-
2000-08-30soldstatus $95,000
-
2000-08-25soldstatus $95,000
-
2000-08-03historical
-
2000-07-26$96,500
-
1996-07-03soldstatus $79,800
-
1987-04-01soldstatus $72,500
ⓘ Source: listings_history table (triggers on properties + properties_extension) + one-shot
backfill from property_details.listing_events for pre-trigger history.
Tax reassessment forecast FL · Resets to sale price
- Current annual tax
- $1,132 · $94/mo
- Projected year-2 tax
- $2,814 · $234/mo
- Expected delta
- +$1,682/yr (+$140/mo · 148.5%)
ⓘ Screening estimate from a state-policy table — verify with the county assessor before closing.
Climate risk First Street
- Flood 1/10 Low FEMA zone X (unshaded) · 0% chance over 30 yrs
- Wildfire 1/10 Low
- Heat 10/10 Extreme 7 d/yr ≥106°F today · 27 d/yr by 30 yrs out
- Wind 10/10 Extreme 99% chance of damaging wind over 30 yrs
- Air quality 2/10 Low 1 unhealthy d/yr today · 1 by 30 yrs out
Nearby sold comps map
Loading sold comps map…
Walkable amenities ~0.75 mi
Loading nearby amenities…
Taxation est. · year 1
- Rental income
- $36,687
- − Mortgage interest
- −$18,989
- − Property taxes
- −$1,132
- − Insurance
- −$1,695
- − Repairs & maintenance
- −$2,935
- − Management
- −$2,935
- − HOA
- −$5,580
- − Depreciation
- −$9,862
- Taxable loss
- −$6,441
- Est. tax savings @ 24.0%
- +$1,546
- After-tax cash flow
- $788/yr
For passive investors: Depreciation is non-cash, so a rental often shows a tax loss while cash-flowing — sheltering income. Rental losses are passive: they offset passive income freely, and up to $25,000/yr can offset ordinary (W-2) income if you actively participate and your MAGI is under $100k (phasing out to $0 by $150k); unused losses carry forward. On sale, claimed depreciation is recaptured at up to 25%, and gains may owe capital-gains tax (a 1031 exchange can defer both). Figures are a year-1 estimate at your 24.0% rate — not tax advice; consult a CPA.
Schools (NCES district)
- District
- Palm Beach
- NCES district ID
- 1201500
- Math proficiency
- 46% ▼ -16.00%
- Reading proficiency
- 53% ▼ -4.00%
- Median HH income
- $53,943
- Composite
- 42.72/100
- National rank
- #3160
- State rank
- #34 of 73 in FL
Livability — West Palm Beach
- Score
- 82/100
- State rank
- #75
- US rank
- #1255
Category grades
Schools grade is shown separately in the Schools card above.
Census & demographics
- County
- Palm Beach County · 1,438,312 people
- City population
- 222,012
- Metro
- Miami-Fort Lauderdale-Pompano Beach, FL
- Population (ZIP)
- 38,079
- Household income
- $51,605
- Rent vs Own
- Severe rent burden
- 2548.0
Population outlook (Palm Beach County) Hauer SSP2
- Today (2025)
- 1,637,487 people
- By 2030
- 1,743,255 · +6.5%
- By 2040
- 1,948,712 · +19.0%
- By 2050
- 2,132,979 · +30.3%
- By 2075
- 2,530,027 · +54.5%
- By 2100
- 2,706,979 · +65.3%
Race, ethnicity, and origin ACS 2023
- Neighborhood character
- Highly diverse neighborhood (Simpson 0.72)
- Race & ethnicity
- White 34% Black 30% Hispanic / Latino 27% Two or more races 16% Asian 3%
- Hispanic origin (detail)
- Mexican 3% Puerto Rican 6% Cuban 5% Dominican 2%
- Common ancestry
- Hispanic 10% Romanian 3% Scotch-Irish 1%
- Foreign-born
- 34% · Canada, Jamaica
- Languages at home
- 58% English-only · Spanish 24% French/Haitian/Cajun 11% Other Indo-European 3%
Political lean MEDSL · Palm Beach
- 2024 margin
- Toss-up / Even · D 50.0% · R 49.2%
- 2008→2024 swing
- -22.1pp toward R · 2008: 22.9pp · 2024: 0.8pp
- All cycles
- 2024: D+0.8 2020: D+12.8 2016: D+15.3 2012: D+17.0 2008: D+22.9
Not yet ingested
- Civics
- —
Market trends
- HPI YoY
- ▼ -138.62%
- Current HPI
- 335.8396
- Rent YoY
- ▬ 0.02%
- Metro
- Miami-Fort Lauderdale-Pompano Beach, FL
- State GDP YoY
- ▲ 3.28%
- F500 in state
- 36
Industry mix (Fortune 500 HQ in FL)
| Industry | F500 HQs | Revenue |
|---|---|---|
| Industrial Technology | 2 | $29B |
|
||
| Insurance | 2 | $17B |
|
||
| Retail | 1 | $60B |
|
||
| Technology Distribution | 1 | $58B |
|
||
| Homebuilding | 1 | $35B |
|
||
| Technology Manufacturing | 1 | $35B |
|
||
Price history
+367.6% since first listed41 events — show timeline
- 2026-03-18 Price Changed $339,000 Beaches MLS
- 2026-01-29 Listed $349,000 Beaches MLS
- 2024-08-04 Pending — Beaches MLS
- 2024-08-03 Listing Removed — Beaches MLS
- 2024-05-05 Price Changed $395,000 Beaches MLS
- 2024-03-07 Price Changed $429,000 Beaches MLS
- 2024-02-14 Listed $449,500 Beaches MLS
- 2015-03-16 Sold (Public Records) $120,000 Public Records
- 2015-03-12 Sold (MLS) $120,000 Beaches MLS
- 2015-03-01 Pending — Beaches MLS
- 2015-02-04 Price Changed $129,000 Beaches MLS
- 2015-01-14 Price Changed $131,500 Beaches MLS
- 2014-12-17 Listed $135,000 Beaches MLS
- 2014-10-11 Listing Removed — Beaches MLS
- 2014-06-09 Listed $125,000 Beaches MLS
- 2014-05-31 Listing Removed — Beaches MLS
- 2014-05-14 Relisted — Beaches MLS
- 2014-04-21 Pending — Beaches MLS
- 2014-04-14 Relisted — Beaches MLS
- 2014-04-08 Pending — Beaches MLS
- 2014-03-14 Listed $125,000 Beaches MLS
- 2013-09-22 Listing Removed — Beaches MLS
- 2013-09-21 Listing Removed — Beaches MLS
- 2010-01-27 Listing Removed — Beaches MLS
- 2009-12-08 Listed $150,000 Beaches MLS
- 2008-01-29 Listing Removed — Beaches MLS
- 2007-09-28 Listed $199,500 Beaches MLS
- 2007-02-02 Listed $249,900 Beaches MLS
- 2001-09-17 Sold (Public Records) $98,000 Public Records
- 2001-08-31 Sold (MLS) $98,000 Beaches MLS
- 2001-08-08 Listing Removed — Beaches MLS
- 2001-07-19 Listing Removed — Beaches MLS
- 2001-07-17 Listed $102,000 Beaches MLS
- 2001-03-21 Listed $100,900 Beaches MLS
- 2001-02-20 Listed $100,900 Beaches MLS
- 2000-08-30 Sold (Public Records) $95,000 Public Records
- 2000-08-25 Sold (MLS) $95,000 Beaches MLS
- 2000-08-03 Listing Removed — Beaches MLS
- 2000-07-26 Listed $96,500 Beaches MLS
- 1996-07-03 Sold (Public Records) $79,800 Public Records
- 1987-04-01 Sold (Public Records) $72,500 Public Records
Property tax history
-4.0%/yrLatest (2025): $1,132 · +4.5% YoY. Source: county tax records.
Cash-flow waterfall
monthlySold comps — $/sqft
last 12 mo · ≤1 miLoading sold comps…