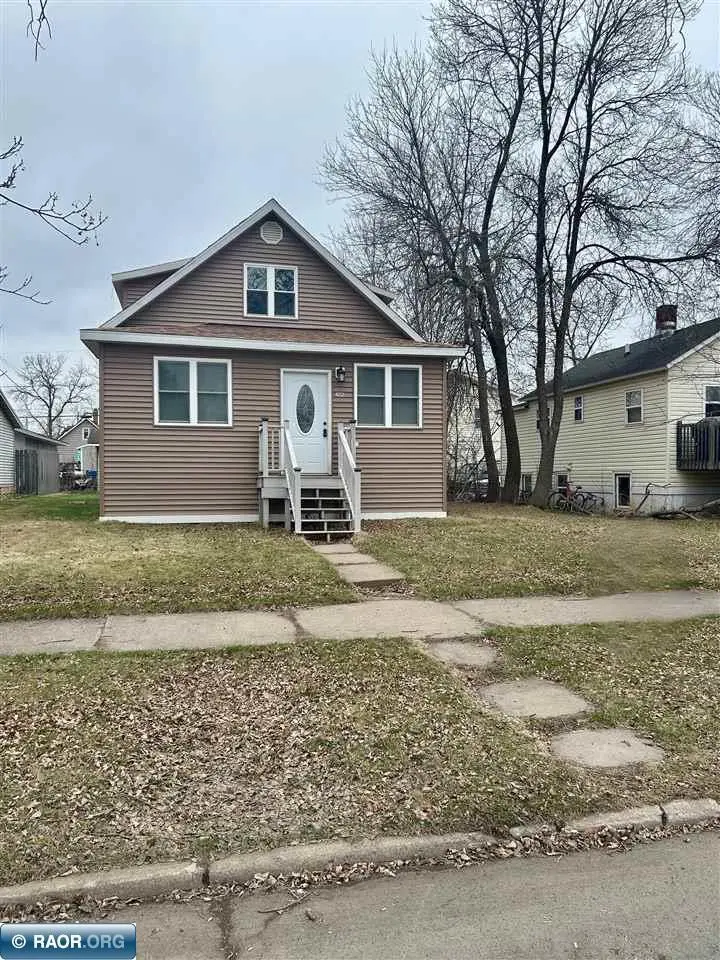
2605 E 4th Ave · Hibbing, MN
Flood risk 1/10 · Minimal
- FEMA flood zone
- X
- Chance of flooding over 30 yrs
- 0.0%
- Est. flood insurance / yr
- $473 – $860
Fire risk 5/10 · Moderate
- Est. fire insurance / yr
- $888 – $1,650
Heat risk 1/10 · Minimal
- Hot days now (above 90°F)
- 7 days/yr
- Hot days in 30 yrs
- 12 days/yr
Wind risk 1/10 · Minimal
- Chance of severe wind over 30 yrs
- —
Air-quality risk 2/10 · Minimal
- Unhealthy air days now
- 0 days/yr
- Unhealthy air days in 30 yrs
- 1 days/yr
Risk factors via First Street. Map © Google.
Why this score? — see what drove the C grade
The composite is a weighted blend of 9 inputs, each scored 0–100. Each bar is that input's sub-score; the figure is the points it added to the 100-point composite (weight × sub-score).
- Cash flow +26.9/30.0
- DSCR +9.3/10.0
- 1% rule +7.0/10.0
- Schools +4.1/10.0
- Livability +4.0/5.0
- Rent growth +2.5/5.0
- Condition / age +2.5/5.0
- ARV discount +0.0/15.0
- Appreciation +0.0/10.0
$148,500
🖨 Deal sheet 📄 Offer letter ✓ Due diligence
Listing remarks
Welcome home to this charming, move-in-ready residence featuring a versatile layout. A large, welcoming front entryway/mud room leads you into the main level, which boasts a spacious living room, a formal dining room - perfect for entertaining, a well-appointed kitchen, a full bathroom, and the flexibility of one or two bedrooms. Brand new appliances include a microwave, electric range, and refrigerator. Upstairs, you'll discover a peaceful retreat. This level features two bedrooms, a very large full bathroom, and bountiful storage options. Make sure you take time to peak at the storage in the East bedroom. The soft, plush carpeting on the stairs and in all upper-level bedrooms is in great
Key facts
- Formal dining room
- Full bathroom
- Spacious living room
Tags
Property features AI
Exterior
- Parking: Detached 1-car garage
- Utilities: Public water; Public sewer
- Home design: Residential property
- Construction: Frame construction; Metal siding
- Exterior features: Asphalt shingle roof
Interior
- Kitchen: Dishwasher; Electric range; Microwave; Refrigerator
- Heating & cooling: Steam heating
- Interior features: Dishwasher; Dryer; Electric range; Microwave; Refrigerator; Washer
- Laundry & utility: Electric dryer hookup; Washer; Dryer
Neighborhood map
What this means for you Summary
Snapshot
- This is a 4-bed/2.0-bath other listed at $148k.
Deal economics
- At list price, monthly cash flow is $412 ($5k/yr) — positive.
- The deal already cash-flows at list — no discount required.
- Meets the 1% rule at list price ($2k rent vs $148k).
- Recommended offer: $144k (3.0% below list) — sets the bar for market timing.
- Cap rate 9.6% vs local median 6.4% in Hibbing — top-decile yield for the area; either an underpriced asset or a hidden risk that comps aren't pricing in. Stress-test before assuming the spread holds.
Location & tenants
- Location reads 79/100 on livability (#103 in MN, #2,307 nationally) — a middle-class / working-renter tenant base. Strengths: crime A+, cost of living A+, housing A+; Watch: employment D+, amenities F, commute F.
- Hibbing Public School District (town): math 43% / reading 54% proficiency, ranked #150 of 301 in MN (top 50%) — families likely to look elsewhere, expect single-tenant / working-renter base with shorter leases.
- Market conditions: 96 active listings in the ZIP; 2 comparable units currently listed for rent nearby; 639 units permitted in St. Louis County in 2024 (338 in 5+ unit buildings).
- This rent runs 38% of the median local income ($56k/yr) — at the standard rent-burdened threshold; future hikes will face affordability resistance.
Forward outlook
- Local home prices are declining (-3.0%/yr); year-one equity from $1k of loan paydown is wiped out by about $4k of value loss. Plan a longer hold.
- At projected returns (-3.0% appreciation + 3.0% rent growth), your $42k cash investment doubles in ~10 years — after that, you're playing with house money.
Negotiation context
- It's been on market 53 days — a 3% lower offer ($144k) is reasonable based on typical stale-listing flexibility.
- 4 sale attempts since 3y ago; this cycle's ask is 8635% above the opening price — seller raised mid-cycle; expect resistance to lowballs.
- Current owner paid $30k; list at $148k implies a 395% gain — meaningful room to come down on a strong offer.
Risks & watch-outs
- Watch-outs: built in 1940 — expect roof / HVAC / electrical / plumbing capex.
- Climate carrying-cost: moderate wildfire risk — expect insurance premiums to compound above CPI over the hold.
Questions for the listing agent
- It's been on market 53 days. Have you received any prior offers? Is the seller open to a 3% concession, seller financing, or rate buy-down credit?
- Built in 1940 — when were the roof, HVAC, electrical panel, plumbing, and water heater last replaced?
- Is there a deadline driving the sale (1031 exchange, divorce, estate, relocation)? That informs how much negotiation room exists.
- Schools are A-rated — typically a magnet for longer-tenancy family renters. What's the average tenant stay here, and is there a school-zone premium baked into asking?
- What's the average days-on-market for RENTAL listings here right now (not sales)? A rising rental-DOM trend means longer vacancies and softer asking-rent achievability than the comps imply.
- What's the recent tenant-quality profile in this submarket — average credit score on applications, eviction rate, late-payment / NSF rate, and stable-employment percentage? A property-management company in the area should have these aggregated.
- How much new for-sale + rental construction is in the pipeline within 1–3 miles? Heavy new supply typically softens prices + rents 12–24 months out; constrained supply supports both.
Investment metrics
- 1% rule
- 1.20% ✓
- Cap rate
- 9.62%
- Cash-on-cash
- 11.89%
- DSCR
- 1.53
- GRM
- 7.0
CMA / ARV
- ARV (median comp)
- $115,029
- List price
- $148,500
- Delta
- 29.10%
- Verdict
- OVERPRICED
- Comps
- 20 within 1.0 mi
Projected returns pro-forma
-3.0% appreciation · 3.0% rent growth · sell at horizon
- IRR
- 1.4%
- Equity multiple
- 1.05×
- Total profit
- $2,176
- Equity at exit
- $22,142
- IRR
- 11.0%
- Equity multiple
- 1.86×
- Total profit
- $35,697
- Equity at exit
- $12,840
Cash invested: $41,580 (down + closing). Projections, not guarantees.
Landlord ↔ Tenant lean methodology
- Overall (STATE)
- 46 Balanced
- State Minnesota
- 46 Balanced · D+2
- County
- — inherits STATE
- City
- — inherits STATE
ZIP-level market 55746
- Home prices YoY
- -18.7%
- Active inventory
- 96
- Price-to-rent
- 7.0×
Monthly cashflow live
- Estimated rent
- $1,776 medium interval (Pro) →
- Mortgage (P&I)
- −$779
- Tax from tax record
- −$151 /mo · $1,810/yr
- Insurance
- −$62
- HOA
- −$0
- Vacancy / Maint / Mgmt
- −$373
- Net cashflow
- $412
Break-even live
UW: 25.0% down · 7.5% · 30yr · 1.5% tax · 5.0% vac · 8.0% maint · 8.0% mgmt
Financing live
Cash to close
- Down payment
- $37,125
- Closing costs
- $4,455
- Reserves months
- —
- Total cash needed
- —
Loan-product check · same deal, 3 products live
Conventional
25% down · 7.5% · 30yr
- Down + closing
- —
- Monthly P&I
- —
- Monthly cashflow
- —
- DSCR
- —
- Eligible?
- —
Personal DTI + credit; lowest rate.
DSCR
20% down · 8.5% · 30yr
- Down + closing
- —
- Monthly P&I
- —
- Monthly cashflow
- —
- DSCR
- —
- Eligible?
- —
No personal income docs; deal must DSCR.
Hard money
10% down · 12.0% · 12mo
- Down + closing
- —
- Monthly P&I
- —
- Monthly cashflow
- —
- DSCR
- —
- Eligible?
- —
Short-term bridge; refi at stabilization.
Rent comps 2 comps
| Address | Beds | Baths | Sqft | Rent | $/sqft | DOM | Units | Dist |
|---|---|---|---|---|---|---|---|---|
| 1627 E 29th St Hibbing, MN | 3.0 | 1.0 | 1200 | $1,535 | $1.28 | 44d | 1 | 1.03mi |
| 100 Southview Dr Hibbing, MN | 1.0–3.0 | 1.0 | 833 | $1,072 | $1.29 | 13d | 1 | 1.07mi |
Listing history 23 events
-
2026-06-19days on market $148,500 Active 53 DOM
-
2026-06-18days on market $148,500 Active 52 DOM
-
2026-06-17days on market $148,500 Active 51 DOM
-
2026-06-16days on market $148,500 Active 50 DOM
-
2026-06-15days on market $148,500 Active 49 DOM
-
2026-06-14days on market $148,500 Active 47 DOM
-
2026-06-13pricedays on market $148,500 Active 46 DOM
-
2026-06-10days on market $149,500 Active 44 DOM
-
2026-06-09days on market $149,500 Active 43 DOM
-
2026-06-08days on market $149,500 Active 42 DOM
-
2026-06-07days on market $149,500 Active 41 DOM
-
2026-06-05days on market $149,500 Active 38 DOM
-
2026-06-03days on market $149,500 Active 37 DOM
-
2026-06-02days on market $149,500 Active 36 DOM
-
2026-06-01days on market $149,500 Active 35 DOM
-
2026-05-31days on market $149,500 Active 34 DOM
-
2026-05-30days on market $149,500 Active 33 DOM
-
2026-05-14price $149,500 838-char remark
-
2026-05-08$1,700
-
2026-04-23$155,000 Active 838-char remark
-
2023-10-01historical $1,200
-
2023-09-19$1,200
-
1999-10-07soldstatus $30,000
ⓘ Source: listings_history table (triggers on properties + properties_extension) + one-shot
backfill from property_details.listing_events for pre-trigger history.
Tax reassessment forecast MN · Partial reset (capped growth)
- Current annual tax
- $1,810 · $151/mo
- Projected year-2 tax
- $1,810 · $151/mo
- Expected delta
- $0/yr ($0/mo · 0.0%)
ⓘ Screening estimate from a state-policy table — verify with the county assessor before closing.
Climate risk First Street
- Flood 1/10 Low FEMA zone X · 0% chance over 30 yrs
- Wildfire 5/10 Major
- Heat 1/10 Low 7 d/yr ≥90°F today · 12 d/yr by 30 yrs out
- Wind 1/10 Low
- Air quality 2/10 Low 0 unhealthy d/yr today · 1 by 30 yrs out
Nearby sold comps map
Loading sold comps map…
Walkable amenities ~0.75 mi
Loading nearby amenities…
Taxation est. · year 1
- Rental income
- $21,317
- − Mortgage interest
- −$8,318
- − Property taxes
- −$1,810
- − Insurance
- −$742
- − Repairs & maintenance
- −$1,705
- − Management
- −$1,705
- − Depreciation
- −$4,320
- Taxable income
- $2,715
- Est. tax owed @ 24.0%
- −$652
- After-tax cash flow
- $4,291/yr
For passive investors: Depreciation is non-cash, so a rental often shows a tax loss while cash-flowing — sheltering income. Rental losses are passive: they offset passive income freely, and up to $25,000/yr can offset ordinary (W-2) income if you actively participate and your MAGI is under $100k (phasing out to $0 by $150k); unused losses carry forward. On sale, claimed depreciation is recaptured at up to 25%, and gains may owe capital-gains tax (a 1031 exchange can defer both). Figures are a year-1 estimate at your 24.0% rate — not tax advice; consult a CPA.
Schools (NCES district)
- District
- Hibbing Public School District
- NCES district ID
- 2713980
- Math proficiency
- 43% ▼ -14.00%
- Reading proficiency
- 54% ▼ -13.00%
- Median HH income
- $41,666
- Composite
- 40.7/100
- National rank
- #3667
- State rank
- #150 of 301 in MN
Livability — Hibbing
- Score
- 79/100
- State rank
- #103
- US rank
- #2307
Category grades
Schools grade is shown separately in the Schools card above.
Census & demographics
- Census place
- Hibbing, MN
- County
- Saint Louis County · 115,152 people
- City population
- 16,730
- Metro
- Duluth, MN-WI
- Population (ZIP)
- 16,730
- Household income
- $55,823
- Rent vs Own
- Severe rent burden
- 623.0
Population outlook (St. Louis County) Hauer SSP2
- Today (2025)
- 202,411 people
- By 2030
- 203,234 · +0.4%
- By 2040
- 202,520 · +0.1%
- By 2050
- 200,853 · -0.8%
- By 2075
- 200,943 · -0.7%
- By 2100
- 192,058 · -5.1%
Race, ethnicity, and origin ACS 2023
- Neighborhood character
- Predominantly White (93%)
- Race & ethnicity
- White 93% Two or more races 4% Black 2% Hispanic / Latino 2%
- Common ancestry
- Portuguese 10% Lithuanian 2% Romanian 2%
- Foreign-born
- 2% · Canada
- Languages at home
- 96% English-only · Spanish 1% German/W. Germanic 1%
Political lean MEDSL · St. Louis
- 2024 margin
- D (+13.7) · D 55.9% · R 42.2% · Other 1.8%
- 2008→2024 swing
- -18.8pp toward R · 2008: 32.5pp · 2024: 13.7pp
- All cycles
- 2024: D+13.7 2020: D+15.6 2016: D+11.8 2012: D+29.6 2008: D+32.5
Not yet ingested
- Civics
- —
Market trends
- HPI YoY
- ▼ -50.85%
- Current HPI
- 220.7198
- Rent YoY
- —
- Metro
- Duluth, MN-WI
- State GDP YoY
- ▲ 2.41%
- F500 in state
- 34
Industry mix (Fortune 500 HQ in MN)
| Industry | F500 HQs | Revenue |
|---|---|---|
| Healthcare | 2 | $407B |
|
||
| Retail | 2 | $150B |
|
||
| Consumer Goods | 2 | $32B |
|
||
| Industrial Machinery | 2 | $6B |
|
||
| Agriculture | 1 | $40B |
|
||
| Healthcare / Medical Devices | 1 | $32B |
|
||
Price history
+395.0% since first listed10 events — show timeline
- 2026-06-10 Price Changed $148,500 RAOR
- 2026-05-24 Rental Removed $1,700 BUILDIUM
- 2026-05-24 Relisted — RAOR
- 2026-05-20 Delisted — RAOR
- 2026-05-14 Price Changed $149,500 RAOR
- 2026-05-08 Listed for Rent $1,700 BUILDIUM
- 2026-04-23 Listed $155,000 RAOR
- 2023-10-01 Rental Removed $1,200 BUILDIUM
- 2023-09-19 Listed for Rent $1,200 BUILDIUM
- 1999-10-07 Sold (Public Records) $30,000 Public Records
Property tax history
+20.7%/yrLatest (2026): $1,810 · +14.8% YoY. Source: county tax records.
Cash-flow waterfall
monthlySold comps — $/sqft
last 12 mo · ≤1 miLoading sold comps…