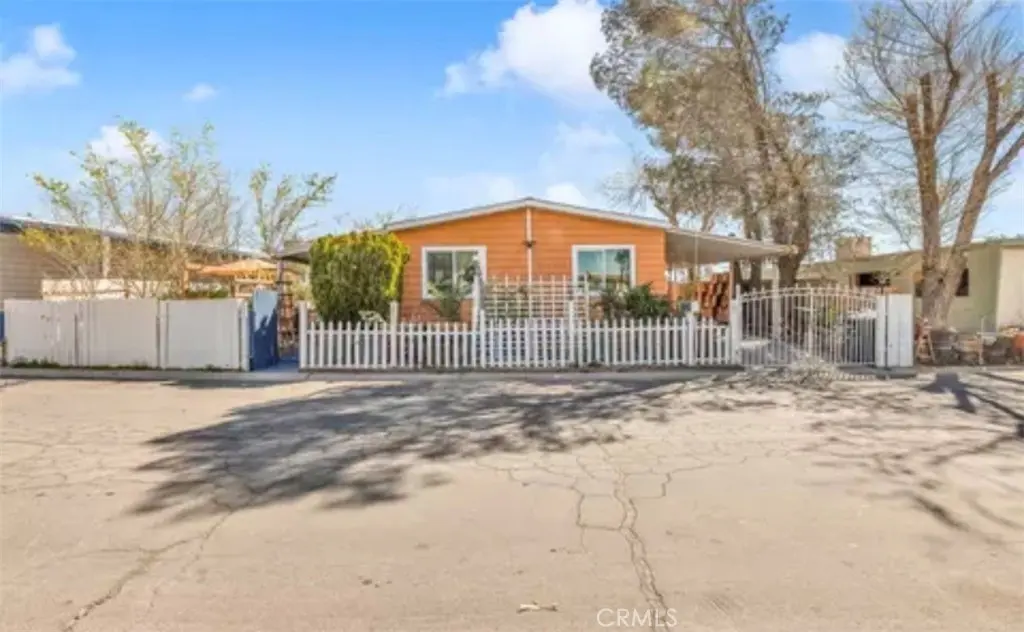
3300 15th St W #64 · Rosamond, CA
Flood risk 1/10 · Minimal
- FEMA flood zone
- X (shaded)
- Chance of flooding over 30 yrs
- 0.0%
- Est. flood insurance / yr
- $507 – $1,088
Fire risk 5/10 · Moderate
- Est. fire insurance / yr
- $659 – $1,223
Heat risk 7/10 · Major
- Hot days now (above 101°F)
- 5 days/yr
- Hot days in 30 yrs
- 14 days/yr
Wind risk 1/10 · Minimal
- Chance of severe wind over 30 yrs
- —
Air-quality risk 7/10 · Major
- Unhealthy air days now
- 14 days/yr
- Unhealthy air days in 30 yrs
- 18 days/yr
Risk factors via First Street. Map © Google.
Why this score? — see what drove the B- grade
The composite is a weighted blend of 9 inputs, each scored 0–100. Each bar is that input's sub-score; the figure is the points it added to the 100-point composite (weight × sub-score).
- Cash flow +30.0/30.0
- DSCR +10.0/10.0
- 1% rule +9.2/10.0
- Appreciation +6.2/10.0
- ARV discount +4.4/15.0
- Rent growth +2.5/5.0
- Livability +2.5/5.0
- Condition / age +2.5/5.0
- Schools +2.2/10.0
$177,000
🖨 Deal sheet 📄 Offer letter ✓ Due diligence
Key facts
- Newer windows
- Updated flooring
- Newer interior walls
Tags
Property features AI
Finance
- Financial info: Land lease of $720 (land lease community); Rent includes trash and water
- HOA & community: Part of an association with pool and community amenities; Park requires manager approval
Exterior
- Parking: Carport; Located in Desert Oasis mobile home park
- Utilities: Public sewer; District/public water; Natural gas available
- Home design: Single-story home; Mobile home on site
- Construction: Mobile home (34 ft x 180 ft); Year built per builder
- Exterior features: Community pool; Street lighting, sidewalks, and park in the neighborhood
Interior
- Bathrooms: 2 full bathrooms; Shower in tub
- Heating & cooling: Wall/window cooling; Evaporative cooling
- Interior features: Front entry; Entry at ground level
- Laundry & utility: Indoor laundry
Neighborhood map
What this means for you Summary
Snapshot
- This is a 3-bed/2.0-bath manufactured listed at $177k.
Deal economics
- At list price, monthly cash flow is $764 ($9k/yr) — positive.
- The deal already cash-flows at list — no discount required.
- Meets the 1% rule at list price ($3k rent vs $177k).
- Recommended offer: $174k (1.5% below list) — sets the bar for market timing.
- Cap rate 11.5% vs local median 4.3% in Rosamond — top-decile yield for the area; either an underpriced asset or a hidden risk that comps aren't pricing in. Stress-test before assuming the spread holds.
Location & tenants
- Location reads 49/100 on livability (#1,178 in CA) — a working-class tenant base; expect higher turnover. Strengths: housing A+; Watch: schools F, crime F, amenities F.
- Southern Kern Unified (town): math 25% / reading 25% proficiency, ranked #387 of 517 in CA (top 75%) — low school quality limits family demand, transient renter base, plan for 1-2y turnover; 67% free/reduced lunch — lower-income household profile, screen leases tightly.
- Market conditions: 458 active listings in the ZIP; 11 comparable units currently listed for rent nearby; rentals leasing fast (median 10d on market — plan ~1-2 weeks tenant-placement turnaround); solid renter incomes; 3,244 units permitted in Kern County in 2024 (73 in 5+ unit buildings).
- This rent runs 39% of the median local income ($77k/yr) — at the standard rent-burdened threshold; future hikes will face affordability resistance.
Forward outlook
- In year one you build about $5k of equity ($1k loan paydown + $4k appreciation (2.4% local appreciation)).
- Kern County population projected at +17% by 2050 — long-run rental-demand tailwind backs the buy-and-hold thesis.
- At projected returns (2.4% appreciation + 3.0% rent growth), your $50k cash investment doubles in ~4 years — after that, you're playing with house money.
- By year 7, paydown + projected appreciation supports a ~$35k cash-out refi (75% LTV) — recoverable capital for the next deal without selling this one.
Negotiation context
- It's been on market 26 days — a 2% lower offer ($174k) is reasonable based on typical stale-listing flexibility.
- 7 sale attempts since 4y ago with the ask held roughly flat each time — persistent listings suggest the price (not the market) is what's stuck; bring a comps-based counter.
Risks & watch-outs
- Climate carrying-cost: moderate wildfire risk; extreme-heat days projected 5→14/yr by 2055 (HVAC capex compounding) — expect insurance premiums to compound above CPI over the hold.
Questions for the listing agent
- Built in 1979 — when were the roof, HVAC, electrical panel, plumbing, and water heater last replaced?
- Is there a deadline driving the sale (1031 exchange, divorce, estate, relocation)? That informs how much negotiation room exists.
- Schools are F-rated, which usually means shorter tenancies and higher turnover. Who's the typical renter profile here, and what's been the actual vacancy rate?
- Crime grade is F in this area — have there been break-ins, vandalism, or insurance claims at this property in the last 3 years? What carrier currently insures it and at what premium?
- What's the average days-on-market for RENTAL listings here right now (not sales)? A rising rental-DOM trend means longer vacancies and softer asking-rent achievability than the comps imply.
- What's the recent tenant-quality profile in this submarket — average credit score on applications, eviction rate, late-payment / NSF rate, and stable-employment percentage? A property-management company in the area should have these aggregated.
- How much new for-sale + rental construction is in the pipeline within 1–3 miles? Heavy new supply typically softens prices + rents 12–24 months out; constrained supply supports both.
Investment metrics
- 1% rule
- 1.42% ✓
- Cap rate
- 11.48%
- Cash-on-cash
- 18.51%
- DSCR
- 1.82
- GRM
- 5.9
CMA / ARV
- ARV (on-the-fly)
- $165,600
- Comps found
- 1
Show comp detail 1 sale within ~0.75 mi
| Address | Dist | Beds/Ba | Sqft | Sold | Price | $/sf | Match |
|---|---|---|---|---|---|---|---|
| 3300 W 15th St Spc 376 | 0.00mi | 4/2.0 (+1) | 1,584 (-14%) | 9mo | $142,400 | $90 | 64 |
Match score weights: distance 35% · size 25% · config 20% · recency 20%. Top-matched comps best support the ARV.
Projected returns pro-forma
2.4% appreciation · 3.0% rent growth · sell at horizon
- IRR
- 23.6%
- Equity multiple
- 2.30×
- Total profit
- $64,537
- Equity at exit
- $73,725
- IRR
- 25.1%
- Equity multiple
- 4.40×
- Total profit
- $168,615
- Equity at exit
- $109,257
Cash invested: $49,560 (down + closing). Projections, not guarantees.
Landlord ↔ Tenant lean methodology
- Overall (STATE)
- 18 Strongly Tenant-Friendly
- State California
- 18 Strongly Tenant-Friendly · D+13
- County
- — inherits STATE
- City
- — inherits STATE
ZIP-level market 93560
- Home prices YoY
- 0.6%
- Active inventory
- 458
- Price-to-rent
- 5.9×
Monthly cashflow live
- Estimated rent
- $2,516 high interval (Pro) →
- Mortgage (P&I)
- −$928
- Tax est. 1.5%
- −$221 /mo · $2,655/yr
- Insurance
- −$74
- HOA
- −$0
- Vacancy / Maint / Mgmt
- −$528
- Net cashflow
- $764
Break-even live
UW: 25.0% down · 7.5% · 30yr · 1.5% tax · 5.0% vac · 8.0% maint · 8.0% mgmt
Financing live
Cash to close
- Down payment
- $44,250
- Closing costs
- $5,310
- Reserves months
- —
- Total cash needed
- —
Loan-product check · same deal, 3 products live
Conventional
25% down · 7.5% · 30yr
- Down + closing
- —
- Monthly P&I
- —
- Monthly cashflow
- —
- DSCR
- —
- Eligible?
- —
Personal DTI + credit; lowest rate.
DSCR
20% down · 8.5% · 30yr
- Down + closing
- —
- Monthly P&I
- —
- Monthly cashflow
- —
- DSCR
- —
- Eligible?
- —
No personal income docs; deal must DSCR.
Hard money
10% down · 12.0% · 12mo
- Down + closing
- —
- Monthly P&I
- —
- Monthly cashflow
- —
- DSCR
- —
- Eligible?
- —
Short-term bridge; refi at stabilization.
Rent comps 11 comps
| Address | Beds | Baths | Sqft | Rent | $/sqft | DOM | Units | Dist |
|---|---|---|---|---|---|---|---|---|
| 2910 B St Rosamond, CA | 2.0 | 1.5 | 1775 | $1,542 | $0.87 | 19d | 1 | 0.86mi |
| 1838 Center St Unit A Rosamond, CA | 3.0 | 2.5 | 1475 | $2,000 | $1.36 | 10d | 1 | 0.87mi |
| 1838 Center St Unit A Rosamond, CA | 3.0 | 2.5 | 1495 | $2,000 | $1.34 | 1d | 1 | 0.87mi |
| 2416 W Valley Vis Rosamond, CA | 3.0 | 2.0 | 1343 | $2,250 | $1.68 | 15d | 1 | 1.07mi |
| 2436 Horizon Dr Rosamond, CA | 3.0 | 2.0 | 1416 | $4,500 | $3.18 | 43d | 1 | 1.10mi |
| 2516 Starbrite Ave Rosamond, CA | 3.0 | 2.0 | 1542 | $2,900 | $1.88 | 1d | 1 | 1.20mi |
| 2051 Candice Ave Rosamond, CA | 3.0 | 2.0 | 1345 | $2,395 | $1.78 | 15d | 1 | 1.21mi |
| 2608 Starbrite Ave Rosamond, CA | 4.0 | 2.0 | 1542 | $2,795 | $1.81 | 1d | 1 | 1.28mi |
| 3317 Dale Ct Rosamond, CA | 3.0 | 2.0 | 1330 | $800 | $0.60 | 1d | 1 | 1.34mi |
| 1953 Marie Ave Apt A Rosamond, CA | 4.0 | 3.0 | 1753 | $2,550 | $1.45 | 43d | 1 | 1.49mi |
| 1953 Marie Ave Apt A Rosamond, CA | 4.0 | 3.0 | 1753 | $2,550 | $1.45 | 3d | 1 | 1.49mi |
Listing history 30 events
-
2026-06-18days on market $177,000 Active 26 DOM
-
2026-06-17days on market $177,000 Active 25 DOM
-
2026-06-16days on market $177,000 Active 24 DOM
-
2026-06-15days on market $177,000 Active 23 DOM
-
2026-06-13days on market $177,000 Active 21 DOM
-
2026-06-13days on market $177,000 Active 20 DOM
-
2026-06-09days on market $177,000 Active 17 DOM
-
2026-06-08days on market $177,000 Active 16 DOM
-
2026-06-07days on market $177,000 Active 15 DOM
-
2026-06-04days on market $177,000 Active 12 DOM
-
2026-06-03days on market $177,000 Active 11 DOM
-
2026-06-02days on market $177,000 Active 10 DOM
-
2026-06-01days on market $177,000 Active 9 DOM
-
2026-05-31days on market $177,000 Active 8 DOM
-
2026-05-23$177,000 Active
-
2025-03-14status Active
-
2025-03-14historical
-
2025-03-06status Pending Sale
-
2024-11-01$175,000 Active
-
2023-09-01status Pending Sale
-
2023-09-01historical
-
2023-04-12$175,000 Active
-
2022-07-18status Active
-
2022-07-18historical
-
2022-06-21status Pending Sale
-
2022-06-10status Active
-
2022-05-31status Pending Sale
-
2022-05-06price $155,000
-
2022-05-06price $155,000
-
2022-03-16$163,000 Active
ⓘ Source: listings_history table (triggers on properties + properties_extension) + one-shot
backfill from property_details.listing_events for pre-trigger history.
Climate risk First Street
- Flood 1/10 Low FEMA zone X (shaded) · 0% chance over 30 yrs
- Wildfire 5/10 Major
- Heat 7/10 Severe 5 d/yr ≥101°F today · 14 d/yr by 30 yrs out
- Wind 1/10 Low
- Air quality 7/10 Severe 14 unhealthy d/yr today · 18 by 30 yrs out
Nearby sold comps map
Loading sold comps map…
Walkable amenities ~0.75 mi
Loading nearby amenities…
Taxation est. · year 1
- Rental income
- $30,192
- − Mortgage interest
- −$9,915
- − Property taxes
- −$2,655
- − Insurance
- −$885
- − Repairs & maintenance
- −$2,415
- − Management
- −$2,415
- − Depreciation
- −$5,149
- Taxable income
- $6,757
- Est. tax owed @ 24.0%
- −$1,622
- After-tax cash flow
- $7,551/yr
For passive investors: Depreciation is non-cash, so a rental often shows a tax loss while cash-flowing — sheltering income. Rental losses are passive: they offset passive income freely, and up to $25,000/yr can offset ordinary (W-2) income if you actively participate and your MAGI is under $100k (phasing out to $0 by $150k); unused losses carry forward. On sale, claimed depreciation is recaptured at up to 25%, and gains may owe capital-gains tax (a 1031 exchange can defer both). Figures are a year-1 estimate at your 24.0% rate — not tax advice; consult a CPA.
Schools (NCES district)
- District
- Southern Kern Unified
- NCES district ID
- 0637620
- Math proficiency
- 25% ▲ 7.00%
- Reading proficiency
- 25% ▼ -8.00%
- Median HH income
- $54,523
- Composite
- 22.5/100
- National rank
- #8093
- State rank
- #387 of 517 in CA
Livability — Rosamond
- Score
- 49/100
- State rank
- #1178
- US rank
- #25952
Category grades
Schools grade is shown separately in the Schools card above.
Census & demographics
- Census place
- Rosamond, CA
- County
- Kern County · 710,371 people
- City population
- 22,119
- Metro
- Bakersfield, CA
- Population (ZIP)
- 22,119
- Household income
- $77,431
- Rent vs Own
- Severe rent burden
- 425.0
Population outlook (Kern County) Hauer SSP2
- Today (2025)
- 947,286 people
- By 2030
- 978,984 · +3.3%
- By 2040
- 1,045,018 · +10.3%
- By 2050
- 1,105,232 · +16.7%
- By 2075
- 1,229,538 · +29.8%
- By 2100
- 1,238,059 · +30.7%
Race, ethnicity, and origin ACS 2023
- Neighborhood character
- Diverse neighborhood (Simpson 0.68)
- Race & ethnicity
- Hispanic / Latino 45% White 32% Two or more races 17% Black 13% Asian 3% Native American 1%
- Hispanic origin (detail)
- Mexican 35%
- Common ancestry
- Portuguese 2% Italian 2% Lithuanian 1%
- Foreign-born
- 13% · Canada
- Languages at home
- 68% English-only · Spanish 28% Other Indo-European 2% Other Asian/Pacific 1%
Political lean MEDSL · Kern
- 2024 margin
- Strong R (+21.1) · D 38.2% · R 59.3% · Other 2.5%
- 2008→2024 swing
- -3.3pp toward R · 2008: -17.8pp · 2024: -21.1pp
- All cycles
- 2024: R+21.1 2020: R+10.2 2016: R+15.0 2012: R+20.9 2008: R+17.8
Not yet ingested
- Civics
- —
Market trends
- HPI YoY
- ▲ 2.40%
- Current HPI
- 403.7206
- Rent YoY
- —
- Metro
- Bakersfield, CA
- State GDP YoY
- ▲ 3.21%
- F500 in state
- 116
Industry mix (Fortune 500 HQ in CA)
| Industry | F500 HQs | Revenue |
|---|---|---|
| Technology | 27 | $1,492B |
|
||
| Financial Services | 3 | $174B |
|
||
| Retail | 3 | $44B |
|
||
| Insurance | 3 | $26B |
|
||
| Media / Entertainment | 2 | $115B |
|
||
| Pharmaceuticals / Biotech | 2 | $62B |
|
||
Price history
+8.6% since first listed16 events — show timeline
- 2026-05-23 Listed $177,000 CRMLS
- 2025-03-14 Relisted — CRMLS
- 2025-03-14 Listing Removed — CRMLS
- 2025-03-06 Pending — CRMLS
- 2024-11-01 Listed $175,000 CRMLS
- 2023-09-01 Pending — CRMLS
- 2023-09-01 Listing Removed — CRMLS
- 2023-04-12 Listed $175,000 CRMLS
- 2022-07-18 Relisted — CRMLS
- 2022-07-18 Listing Removed — CRMLS
- 2022-06-21 Pending — CRMLS
- 2022-06-10 Relisted — CRMLS
- 2022-05-31 Pending — CRMLS
- 2022-05-06 Price Changed $155,000 AVMLS
- 2022-05-06 Price Changed $155,000 CRMLS
- 2022-03-16 Listed $163,000 CRMLS
Property tax history
+2.3%/yrLatest (2025): $133 · +7.2% YoY. Source: county tax records.
Cash-flow waterfall
monthlySold comps — $/sqft
last 12 mo · ≤1 miLoading sold comps…