410 S 1St St Spc 62 · El Cajon, CA
Flood risk 4/10 · Minor
- FEMA flood zone
- X (shaded)
- Chance of flooding over 30 yrs
- 0.2%
- Est. flood insurance / yr
- $507 – $1,088
Fire risk 1/10 · Minimal
- Est. fire insurance / yr
- $659 – $1,223
Heat risk 5/10 · Moderate
- Hot days now (above 99°F)
- 6 days/yr
- Hot days in 30 yrs
- 18 days/yr
Wind risk 1/10 · Minimal
- Chance of severe wind over 30 yrs
- —
Air-quality risk 4/10 · Minor
- Unhealthy air days now
- 6 days/yr
- Unhealthy air days in 30 yrs
- 7 days/yr
Risk factors via First Street. Map © Google.
Why this score? — see what drove the D grade
The composite is a weighted blend of 9 inputs, each scored 0–100. Each bar is that input's sub-score; the figure is the points it added to the 100-point composite (weight × sub-score).
- Cash flow +15.0/30.0
- ARV discount +7.5/15.0
- 1% rule +5.0/10.0
- DSCR +5.0/10.0
- Schools +4.0/10.0
- Livability +3.5/5.0
- Condition / age +2.2/5.0
- Rent growth +1.8/5.0
- Appreciation +0.0/10.0
$40,000
🖨 Deal sheet (PDF) 📄 Offer letter ✓ Due diligence
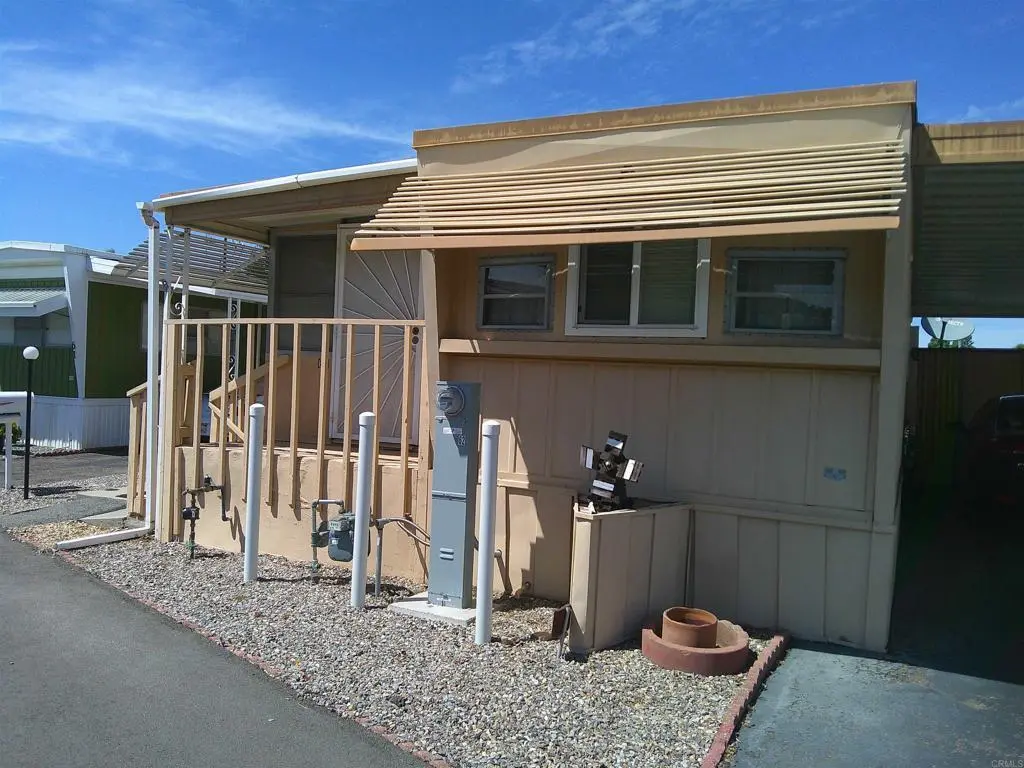
Listing remarks
Senior 55+ Community with amenities and activities!! 2-bedroom, 2-full-bath home features indoor laundry and a spacious addition that includes an enclosed front patio room, den, second bedroom, and a primary bath with closet and laundry. Newer dual-pane windows bring in abundant natural light. A must see!
Key facts
- Dual-pane windows
- Indoor laundry
- Spacious addition
Tags
Property features AI
Finance
- Other: Lot size source: public records
- Financial info: Land lease of $796 per month
- HOA & community: Senior community; Park requires manager approval
Exterior
- Parking: Located in El Cajon Valley Mobile Home Park
- Utilities: Utilities details not provided
- Home design: Single-story mobile home; Mobile home remains on lot; Mobile home dimensions approximately 10 ft by 55 ft
- Construction: Construction details not provided
- Exterior features: Community pool; Located in a suburban community; 11–15 units per acre (lot density)
Interior
- Kitchen: Kitchen
- Bedrooms: Bedrooms information not provided
- Bathrooms: 2 full bathrooms
- Heating & cooling: Central cooling
- Interior features: One-level layout; Front door entry
- Laundry & utility: Laundry inside
Neighborhood map
What this means for you Summary
Snapshot
- This is a 2-bed/2.0-bath manufactured listed at $40k. Condition is rated fair.
Deal economics
- At list price, monthly cash flow is $2k ($20k/yr) — positive.
- The deal already cash-flows at list — no discount required.
- Meets the 1% rule at list price ($2k rent vs $40k).
- Recommended offer: $38k (6.0% below list) — sets the bar for market timing.
- Cap rate 56.8% vs local median 2.4% in El Cajon — top-decile yield for the area; either an underpriced asset or a hidden risk that comps aren't pricing in. Stress-test before assuming the spread holds.
Location & tenants
- Location reads 70/100 on livability (#230 in CA) — a middle-class / working-renter tenant base. Strengths: amenities A+, commute A+; Watch: health & safety C-, crime D+, cost of living F.
- Grossmont Union High (suburban): math 31% / reading 60% proficiency, ranked #173 of 517 in CA (top 34%) — families likely to look elsewhere, expect single-tenant / working-renter base with shorter leases; only 17% free/reduced lunch — higher-income household profile.
- Market conditions: Rents soft (-2.6%/yr); 140 active listings in the ZIP; 40 comparable units currently listed for rent nearby; rentals leasing fast (median 0d on market — plan ~1-2 weeks tenant-placement turnaround); solid renter incomes; 11,759 units permitted in San Diego County in 2024 (7,244 in 5+ unit buildings).
Forward outlook
- Local home prices are declining (-3.0%/yr); year-one equity from $277 of loan paydown is wiped out by about $1k of value loss. Plan a longer hold.
- San Diego County population projected at +20% by 2050 — long-run rental-demand tailwind backs the buy-and-hold thesis.
- At projected returns (-3.0% appreciation + 0.0% rent growth), your $11k cash investment doubles in ~1 year — after that, you're playing with house money.
Negotiation context
- It's been on market 79 days — a 6% lower offer ($38k) is reasonable based on typical stale-listing flexibility.
Risks & watch-outs
- Climate carrying-cost: extreme-heat days projected 6→18/yr by 2055 (HVAC capex compounding) — expect insurance premiums to compound above CPI over the hold.
Questions for the listing agent
- It's been on market 79 days. Have you received any prior offers? Is the seller open to a 6% concession, seller financing, or rate buy-down credit?
- Have any recent inspections been done? Can we get a copy of the seller's disclosures and any deferred-maintenance estimates?
- Built in 1960 — when were the roof, HVAC, electrical panel, plumbing, and water heater last replaced?
- Why hasn't it sold? Are there any deal-killer items the seller is aware of (foundation, flood, title, zoning, code violations)?
- Is there a deadline driving the sale (1031 exchange, divorce, estate, relocation)? That informs how much negotiation room exists.
- Crime grade is D in this area — have there been break-ins, vandalism, or insurance claims at this property in the last 3 years? What carrier currently insures it and at what premium?
- The area grade is low — what's the realistic commute time and amenity access for the typical tenant pool here? Any planned neighborhood developments (good or bad) we should know about?
- What's the average days-on-market for RENTAL listings here right now (not sales)? A rising rental-DOM trend means longer vacancies and softer asking-rent achievability than the comps imply.
- What's the recent tenant-quality profile in this submarket — average credit score on applications, eviction rate, late-payment / NSF rate, and stable-employment percentage? A property-management company in the area should have these aggregated.
- How much new for-sale + rental construction is in the pipeline within 1–3 miles? Heavy new supply typically softens prices + rents 12–24 months out; constrained supply supports both.
Investment metrics
- 1% rule
- 6.20% ✓
- Cap rate
- 56.81%
- Cash-on-cash
- 180.43%
- DSCR
- 9.03
- GRM
- 1.3
CMA / ARV
- ARV (on-the-fly)
- $122,000
- Comps found
- 12
Show comp detail 12 sales within ~0.75 mi
| Address | Dist | Beds/Ba | Sqft | Sold | Price | $/sf | Match |
|---|---|---|---|---|---|---|---|
| 410 S 1st St #81 | 0.00mi | 2/2.0 | 983 (-2%) | 14mo | $146,000 | $149 | 86 |
| 150 S Anza St Spc 69 | 0.27mi | 3/2.0 (+1) | 1,000 (0%) | 2mo | $122,000 | $122 | 81 |
| 410 S 1st St #197 | 0.08mi | 2/2.0 | 1,080 (+8%) | 9mo | $114,000 | $106 | 76 |
| 410 S 1st. St #175 | 0.10mi | 2/2.0 | 1,080 (+8%) | 8mo | $125,000 | $116 | 75 |
| 410 S 1st St Spc 26 | 0.08mi | 1/1.0 (-1) | 1,040 (+4%) | 13mo | $79,000 | $76 | 70 |
| 410 S 1st | 0.10mi | 2/2.0 | 880 (-12%) | 11mo | $175,000 | $199 | 66 |
| 410 S 1st St Spc 3 | 0.00mi | 2/2.0 | 1,101 (+10%) | 23mo | $160,000 | $145 | 64 |
| 1174 E MAIN St #81 | 0.50mi | 2/2.0 | 923 (-8%) | 12mo | $111,500 | $121 | 54 |
| 1174 E Main St Spc 102 | 0.53mi | 2/1.0 | 960 (-4%) | 13mo | $135,000 | $141 | 54 |
| 716 S 2nd St #194 | 0.57mi | 2/2.0 | 1,120 (+12%) | 4mo | $125,000 | $112 | 50 |
| 998 E Main St Spc 68 | 0.45mi | 2/1.0 | 900 (-10%) | 13mo | $175,000 | $194 | 48 |
| 1174 E Main St Spc 11 | 0.50mi | 2/2.0 | 1,104 (+10%) | 16mo | $95,000 | $86 | 46 |
Match score weights: distance 35% · size 25% · config 20% · recency 20%. Top-matched comps best support the ARV.
Projected returns pro-forma
-3.0% appreciation · 0.0% rent growth · sell at horizon
- IRR
- —
- Equity multiple
- 9.35×
- Total profit
- $93,538
- Equity at exit
- $5,964
- IRR
- —
- Equity multiple
- 18.11×
- Total profit
- $191,606
- Equity at exit
- $3,458
Cash invested: $11,200 (down + closing). Projections, not guarantees.
Landlord ↔ Tenant lean methodology
- Overall (STATE)
- 18 Strongly Tenant-Friendly
- State California
- 18 Strongly Tenant-Friendly · D+13
- County
- — inherits STATE
- City
- — inherits STATE
ZIP-level market 92019
- Rents YoY
- -2.6%
- Active inventory
- 140
- Price-to-rent
- 1.3×
Monthly cashflow live
- Estimated rent
- $2,482 high interval (Pro) →
- Mortgage (P&I)
- −$210
- Tax est. 1.5%
- −$50 /mo · $600/yr
- Insurance
- −$17
- HOA
- −$0
- Vacancy / Maint / Mgmt
- −$521
- Net cashflow
- $1,684
Break-even live
Sensitivity live
| Price | -10% $1,712 | -5% $1,698 | +0% $1,684 | +5% $1,670 | +10% $1,656 |
|---|---|---|---|---|---|
| Rent | -10% $1,488 | -5% $1,586 | +0% $1,684 | +5% $1,782 | +10% $1,880 |
| Rate | -1.0pp $1,704 | -0.5pp $1,694 | base $1,684 | +0.5pp $1,674 | +1.0pp $1,663 |
UW: 25.0% down · 7.5% · 30yr · 1.5% tax · 5.0% vac · 8.0% maint · 8.0% mgmt
Financing live
Cash to close
- Down payment
- $10,000
- Closing costs
- $1,200
- Reserves months
- —
- Total cash needed
- —
Loan-product check · same deal, 3 products live
Conventional
25% down · 7.5% · 30yr
- Down + closing
- —
- Monthly P&I
- —
- Monthly cashflow
- —
- DSCR
- —
- Eligible?
- —
Personal DTI + credit; lowest rate.
DSCR
20% down · 8.5% · 30yr
- Down + closing
- —
- Monthly P&I
- —
- Monthly cashflow
- —
- DSCR
- —
- Eligible?
- —
No personal income docs; deal must DSCR.
Hard money
10% down · 12.0% · 12mo
- Down + closing
- —
- Monthly P&I
- —
- Monthly cashflow
- —
- DSCR
- —
- Eligible?
- —
Short-term bridge; refi at stabilization.
Rent comps 40 comps
| Address | Beds | Baths | Sqft | Rent | $/sqft | DOM | Units | Dist |
|---|---|---|---|---|---|---|---|---|
| 1041-89 E Lexington Ave El Cajon, CA | 1.0–2.0 | 1.0–2.0 | 838 | $2,355 | $2.81 | 0d | 7 | 0.14mi |
| 639 Bighorn Ct El Cajon, CA | 3.0 | 2.0 | 1150 | $4,300 | $3.74 | 0d | 1 | 0.16mi |
| 588 S Anza St El Cajon, CA | 1.0–2.0 | 1.0 | 767 | $2,100 | $2.74 | 0d | 5 | 0.17mi |
| 1037 E Lexington Ave El Cajon, CA | 1.0–3.0 | 1.0–2.0 | 855 | $2,225 | $2.60 | 0d | 5 | 0.19mi |
| 1065 E Washington Ave El Cajon, CA | 3.0 | 2.0 | 1100 | $2,850 | $2.59 | 0d | 1 | 0.19mi |
| 1065 E Washington Ave Apt N El Cajon, CA | 3.0 | 2.0 | 1100 | $2,850 | $2.59 | 18d | 1 | 0.19mi |
| 265 S Anza St El Cajon, CA | 2.0 | 1.0 | 775 | $2,250 | $2.90 | 3d | 1 | 0.24mi |
| 1137 E Lexington Ave El Cajon, CA | 2.0 | 1.0 | 900 | $1,995 | $2.22 | 0d | 1 | 0.25mi |
| 975 E Washington Ave Apt E El Cajon, CA | 2.0 | 1.0 | 900 | $2,100 | $2.33 | 23d | 1 | 0.25mi |
| 957 E Washington Ave El Cajon, CA | 2.0 | 2.0 | 900 | $2,295 | $2.55 | 0d | 1 | 0.28mi |
| 725 Washington Heights Rd El Cajon, CA | 2.0 | 1.0 | 800 | $2,238 | $2.80 | 0d | 3 | 0.30mi |
| 602 S Mollison Ave Unit C El Cajon, CA | 2.0 | 2.0 | 1024 | $2,600 | $2.54 | 0d | 1 | 0.31mi |
| 390 S Mollison Ave El Cajon, CA | 1.0 | 1.0 | 750 | $1,725 | $2.30 | 0d | 1 | 0.34mi |
| 200 S Mollison Ave El Cajon, CA | 2.0 | 1.0 | 950 | $1,995 | $2.10 | 0d | 1 | 0.40mi |
| 863 S Mollison Ave El Cajon, CA | 2.0 | 1.0 | 850 | $2,095 | $2.46 | 0d | 4 | 0.41mi |
| 800 E Lexington Ave El Cajon, CA | 2.0–3.0 | 2.0 | 1040 | $2,390 | $2.30 | 0d | 5 | 0.41mi |
| 447 S Lincoln Ave El Cajon, CA | 2.0 | 1.5 | 928 | $2,300 | $2.48 | 0d | 1 | 0.41mi |
| 758 S Mollison Ave El Cajon, CA | 2.0 | 1.0 | 875 | $1,945 | $2.22 | 0d | 2 | 0.42mi |
| 187 Ballard St El Cajon, CA | 1.0–2.0 | 1.0–2.0 | 542 | $2,150 | $3.97 | 0d | 2 | 0.42mi |
| 351 S Lincoln Ave El Cajon, CA | 2.0 | 2.0 | 900 | $2,395 | $2.66 | 0d | 1 | 0.45mi |
| 415 S Lincoln Ave El Cajon, CA | 1.0–2.0 | 1.0–2.0 | 749 | $2,359 | $3.15 | 0d | 5 | 0.45mi |
| 685 S Lincoln Ave El Cajon, CA | 2.0 | 2.0 | 800 | $2,300 | $2.88 | 0d | 1 | 0.46mi |
| 444 S Lincoln Ave El Cajon, CA | 2.0 | 1.0 | 748 | $2,000 | $2.67 | 25d | 1 | 0.47mi |
| 570 S Lincoln Ave El Cajon, CA | 1.0–2.0 | 1.0 | 745 | $2,475 | $3.32 | 4d | 2 | 0.49mi |
| 233 N Mollison Ave El Cajon, CA | 1.0–2.0 | 1.0–2.0 | 843 | $2,131 | $2.53 | 0d | 10 | 0.52mi |
| 595 S 2nd St El Cajon, CA | 2.0 | 1.0 | 800 | $2,290 | $2.86 | 0d | 1 | 0.53mi |
| 277 N 1st St El Cajon, CA | 2.0 | 2.0 | 825 | $2,130 | $2.58 | 3d | 1 | 0.53mi |
| 304 N 1st St El Cajon, CA | 2.0 | 1.0 | 769 | $2,334 | $3.04 | 0d | 1 | 0.54mi |
| 620 E Lexington Ave #3 El Cajon, CA | 2.0 | 2.0 | 1000 | $2,900 | $2.90 | 0d | 1 | 0.55mi |
| 360 N 1st St El Cajon, CA | 2.0 | 2.0 | 725 | $1,995 | $2.75 | 17d | 1 | 0.59mi |
| 280 N Mollison Ave El Cajon, CA | 1.0–2.0 | 1.0 | 825 | $2,195 | $2.66 | 0d | 1 | 0.62mi |
| 805 Benny Way El Cajon, CA | 3.0 | 3.0 | 1477 | $4,300 | $2.91 | 4d | 1 | 0.65mi |
| 960 E Chase Ave Unit C El Cajon, CA | 2.0 | 2.0 | 813 | $2,100 | $2.58 | 0d | 1 | 0.67mi |
| 355 Orlando St El Cajon, CA | 1.0 | 1.0 | 725 | $1,725 | $2.38 | 0d | 1 | 0.68mi |
| 200 Taft Ave El Cajon, CA | 2.0 | 2.0 | 700 | $2,175 | $3.11 | 0d | 6 | 0.68mi |
| 148 Taft Ave Unit 7 El Cajon, CA | 2.0 | 1.0 | 875 | $1,870 | $2.14 | 0d | 1 | 0.69mi |
| 432 Dominguez Way Unit 13 El Cajon, CA | 2.0 | 1.5 | 952 | $2,195 | $2.31 | 21d | 1 | 0.70mi |
| 870 E Chase Ave Unit D El Cajon, CA | 2.0 | 1.0 | 795 | $2,440 | $3.07 | 0d | 1 | 0.70mi |
| 346 Jamacha Rd El Cajon, CA | 2.0 | 1.0–2.0 | 887 | $2,442 | $2.75 | 0d | 8 | 0.72mi |
| 301 Shady Ln El Cajon, CA | 1.0–2.0 | 1.0 | 720 | $2,250 | $3.12 | 0d | 6 | 0.72mi |
Listing history 19 events
-
2026-06-21remarks 306-char remark
-
2026-06-21days on market $40,000 Active 79 DOM
-
2026-06-18price $40,000 Active 76 DOM
-
2026-06-18days on market $50,000 Active 76 DOM
-
2026-06-17days on market $50,000 Active 75 DOM
-
2026-06-16days on market $50,000 Active 74 DOM
-
2026-06-15days on market $50,000 Active 73 DOM
-
2026-06-13days on market $50,000 Active 71 DOM
-
2026-06-13days on market $50,000 Active 70 DOM
-
2026-06-09days on market $50,000 Active 67 DOM
-
2026-06-08days on market $50,000 Active 66 DOM
-
2026-06-07days on market $50,000 Active 65 DOM
-
2026-06-04days on market $50,000 Active 62 DOM
-
2026-06-03days on market $50,000 Active 61 DOM
-
2026-06-02days on market $50,000 Active 60 DOM
-
2026-06-01days on market $50,000 Active 59 DOM
-
2026-05-31days on market $50,000 Active 58 DOM
-
2026-05-19price $55,000
-
2026-04-03$59,000 Active
ⓘ Source: listings_history table (triggers on properties + properties_extension) + one-shot
backfill from property_details.listing_events for pre-trigger history.
Climate risk First Street
- Flood 4/10 Moderate FEMA zone X (shaded) · 20% chance over 30 yrs
- Wildfire 1/10 Low
- Heat 5/10 Major 6 d/yr ≥99°F today · 18 d/yr by 30 yrs out
- Wind 1/10 Low
- Air quality 4/10 Moderate 6 unhealthy d/yr today · 7 by 30 yrs out
Nearby sold comps map
Loading sold comps map…
Walkable amenities ~0.75 mi
Loading nearby amenities…
Taxation est. · year 1
- Rental income
- $29,779
- − Mortgage interest
- −$2,241
- − Property taxes
- −$600
- − Insurance
- −$200
- − Repairs & maintenance
- −$2,382
- − Management
- −$2,382
- − Depreciation
- −$1,164
- Taxable income
- $20,810
- Est. tax owed @ 24.0%
- −$4,994
- After-tax cash flow
- $15,214/yr
For passive investors: Depreciation is non-cash, so a rental often shows a tax loss while cash-flowing — sheltering income. Rental losses are passive: they offset passive income freely, and up to $25,000/yr can offset ordinary (W-2) income if you actively participate and your MAGI is under $100k (phasing out to $0 by $150k); unused losses carry forward. On sale, claimed depreciation is recaptured at up to 25%, and gains may owe capital-gains tax (a 1031 exchange can defer both). Figures are a year-1 estimate at your 24.0% rate — not tax advice; consult a CPA.
Condition & rehab AI · 12 photos
This manufactured home requires moderate renovations to update the kitchen and bathroom, paint the interior walls, and replace the carpeted floors. These updates will significantly increase its resale and rental value.
Repairs flagged
- Moderate kitchen cabinets — dated and in need of updating
- Moderate kitchen countertops — dated and in need of updating
- Moderate bathroom vanity — dated and in need of updating
- Moderate kitchen appliances — dated and in need of updating
- Moderate interior walls — wallpaper and peeling paint
Value-add opportunities
- Both update kitchen cabinets and countertops — modernizing the kitchen will appeal to buyers and renters
- Both update bathroom vanity and fixtures — modernizing the bathroom will appeal to buyers and renters
- Both paint interior walls — painting the interior walls will improve the home's curb appeal and make it more appealing to buyers and renters
- Both replace carpeted floors — replacing the carpeted floors with hardwood or tile will improve the home's curb appeal and make it more appealing to buyers and renters
Renovation cost estimate screening
| Repair item | Severity | Est. cost |
|---|---|---|
| kitchen cabinets · dated and in need of updating | Moderate | $3,000–15,000 |
| kitchen countertops · dated and in need of updating | Moderate | $3,000–15,000 |
| bathroom vanity · dated and in need of updating | Moderate | $3,000–15,000 |
| kitchen appliances · dated and in need of updating | Moderate | $3,000–15,000 |
| interior walls · wallpaper and peeling paint | Moderate | $3,000–15,000 |
| Total estimated repair cost · 5 items | $15,000–75,000 |
Value-add ROI direction
- Both update kitchen cabinets and countertops — modernizing the kitchen will appeal to buyers and renters ↑
- Both update bathroom vanity and fixtures — modernizing the bathroom will appeal to buyers and renters ↑
- Both paint interior walls — painting the interior walls will improve the home's curb appeal and make it more appealing to buyers and renters ↑
- Both replace carpeted floors — replacing the carpeted floors with hardwood or tile will improve the home's curb appeal and make it more appealing to buyers and renters ↑
ⓘ Cost ranges are severity-bucket heuristics (US national rule-of-thumb). Get contractor quotes + a written scope before underwriting a rehab budget.
Schools (NCES district)
- District
- Grossmont Union High
- NCES district ID
- 0616230
- Math proficiency
- 31% ▼ -1.00%
- Reading proficiency
- 60% ▲ 5.00%
- Median HH income
- $61,801
- Composite
- 40.07/100
- National rank
- #3810
- State rank
- #173 of 517 in CA
Livability — El Cajon
- Score
- 70/100
- State rank
- #230
- US rank
- #7531
Category grades
Schools grade is shown separately in the Schools card above.
Census & demographics
- Census place
- El Cajon, CA
- County
- San Diego County · 3,178,799 people
- City population
- 173,694
- Metro
- San Diego-Chula Vista-Carlsbad, CA
- Population (ZIP)
- 45,351
- Household income
- $101,973
- Rent vs Own
- Severe rent burden
- 1897.0
Population outlook (San Diego County) Hauer SSP2
- Today (2025)
- 3,678,185 people
- By 2030
- 3,856,546 · +4.8%
- By 2040
- 4,171,407 · +13.4%
- By 2050
- 4,421,607 · +20.2%
- By 2075
- 4,831,599 · +31.4%
- By 2100
- 4,832,502 · +31.4%
Race, ethnicity, and origin ACS 2023
- Neighborhood character
- Predominantly White (67%)
- Race & ethnicity
- White 67% Hispanic / Latino 21% Two or more races 15% Asian 3% Black 2%
- Hispanic origin (detail)
- Mexican 19%
- Common ancestry
- Arab 6% Romanian 2% Lithuanian 2%
- Foreign-born
- 22% · Canada, China
- Languages at home
- 69% English-only · Spanish 11% Arabic 10% Other Indo-European 1%
Political lean MEDSL · San Diego
- 2024 margin
- D (+16.8) · D 56.9% · R 40.1% · Other 2.9%
- 2008→2024 swing
- +6.6pp toward D · 2008: 10.2pp · 2024: 16.8pp
- All cycles
- 2024: D+16.8 2020: D+22.8 2016: D+17.8 2012: D+5.1 2008: D+10.2
Not yet ingested
- Civics
- —
Market trends
- HPI YoY
- ▼ -553.81%
- Current HPI
- 349.3085
- Rent YoY
- ▼ -2.61%
- Metro
- San Diego-Chula Vista-Carlsbad, CA
- State GDP YoY
- ▲ 3.21%
- F500 in state
- 116
Industry mix (Fortune 500 HQ in CA)
| Industry | F500 HQs | Revenue |
|---|---|---|
| Technology | 27 | $1,492B |
|
||
| Financial Services | 3 | $174B |
|
||
| Retail | 3 | $44B |
|
||
| Insurance | 3 | $26B |
|
||
| Media / Entertainment | 2 | $115B |
|
||
| Pharmaceuticals / Biotech | 2 | $62B |
|
||
Price history
-6.8% since first listed2 events — show timeline
- 2026-05-19 Price Changed $55,000 CRMLS
- 2026-04-03 Listed $59,000 CRMLS
Cash-flow waterfall
monthlySold comps — $/sqft
last 12 mo · ≤1 miLoading sold comps…